Paper Menu >>
Journal Menu >>
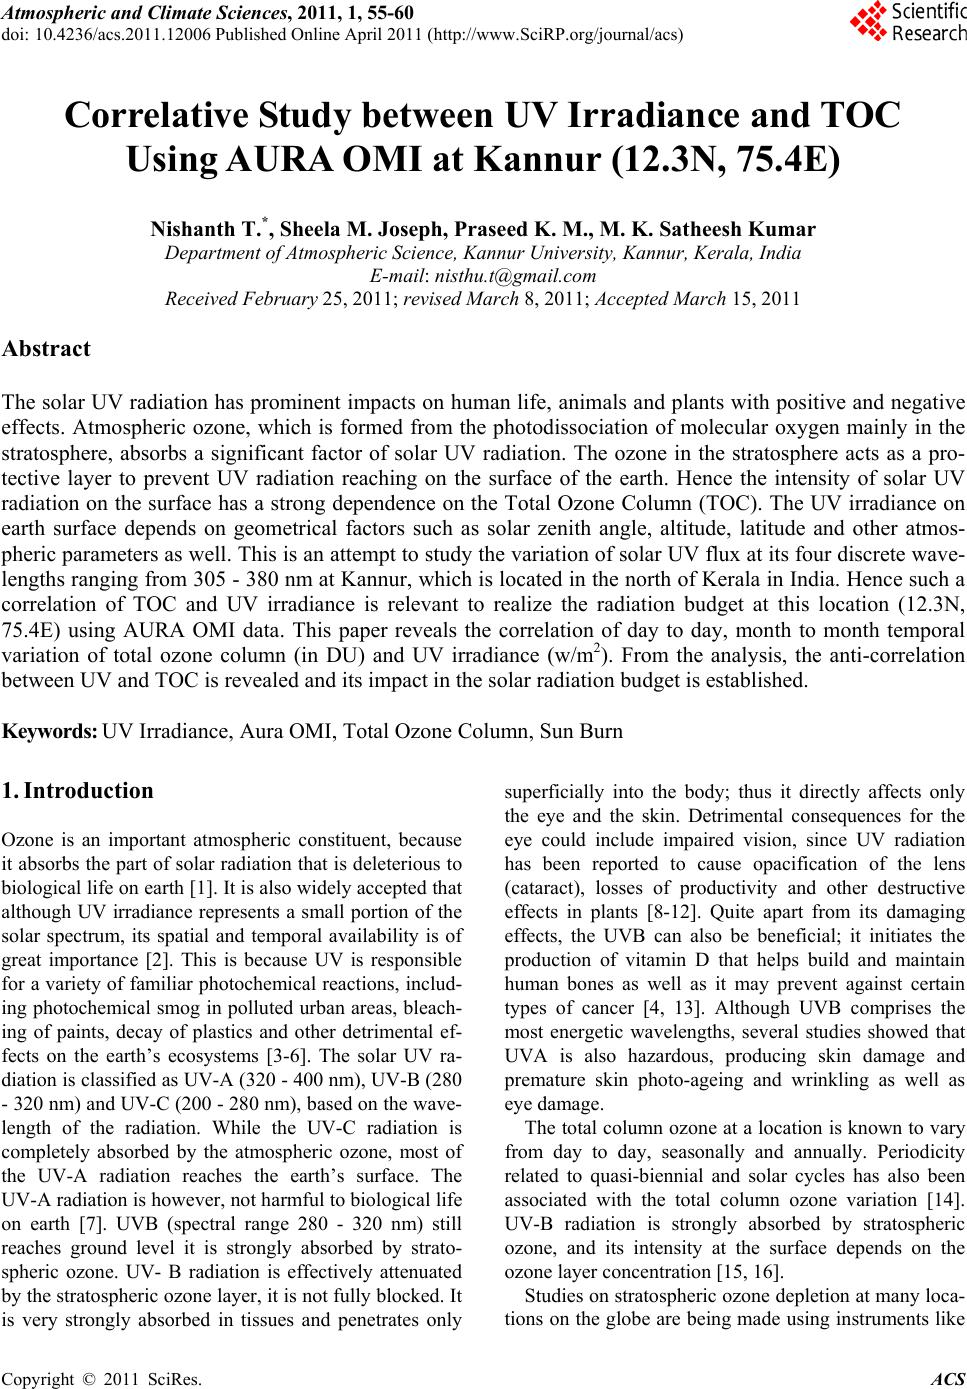 Atmospheric and Climate Sciences, 2011, 1, 55-60 doi: 10.4236/acs.2011.12006 Published Online April 2011 (http://www.SciRP.org/journal/acs) Copyright © 2011 SciRes. ACS Correlative Study between UV Irradiance and TOC Using AURA OMI at Kannur (12.3N, 75.4E) Nishanth T.*, Sheela M. Joseph, Praseed K. M., M. K. Satheesh Kumar Department of Atmospheric Science, Kannur University, Kannur, Kerala, India E-mail: nisthu.t@gmail.com Received February 25 , 20 1 1; revis ed Marc h 8, 2011; Accepted March 15, 2011 Abstract The solar UV radiation has prominent impacts on human life, animals and plants with positive and negative effects. Atmospheric ozone, which is formed from the photodissociation of molecular oxygen mainly in the stratosphere, absorbs a significant factor of solar UV radiation. The ozone in the stratosphere acts as a pro- tective layer to prevent UV radiation reaching on the surface of the earth. Hence the intensity of solar UV radiation on the surface has a strong dependence on the Total Ozone Column (TOC). The UV irradiance on earth surface depends on geometrical factors such as solar zenith angle, altitude, latitude and other atmos- pheric parameters as well. This is an attempt to study the variation of solar UV flux at its four discrete wave- lengths ranging from 305 - 380 nm at Kannur, which is located in the north of Kerala in India. Hence such a correlation of TOC and UV irradiance is relevant to realize the radiation budget at this location (12.3N, 75.4E) using AURA OMI data. This paper reveals the correlation of day to day, month to month temporal variation of total ozone column (in DU) and UV irradiance (w/m2). From the analysis, the anti-correlation between UV and TOC is revealed and its impact in the solar radiation budget is established. Keywords: UV Irradiance, Aura OMI, Total Ozone Column, Sun Burn 1. Introduction Ozone is an important atmospheric constituent, because it absorbs the part of solar radiation that is deleterious to biological life on earth [1]. It is also widely accepted that although UV irradiance represents a small portion of the solar spectrum, its spatial and temporal availability is of great importance [2]. This is because UV is responsible for a variety of familiar photochemical reactions, includ- ing photochemical smog in polluted urban areas, bleach- ing of paints, decay of plastics and other detrimental ef- fects on the earth’s ecosystems [3-6]. The solar UV ra- diation is classified as UV-A (320 - 400 nm), UV-B (280 - 320 nm) and UV-C (200 - 280 nm), based on the wave- length of the radiation. While the UV-C radiation is completely absorbed by the atmospheric ozone, most of the UV-A radiation reaches the earth’s surface. The UV-A radiation is however, not harmful to biological life on earth [7]. UVB (spectral range 280 - 320 nm) still reaches ground level it is strongly absorbed by strato- spheric ozone. UV- B radiation is effectively attenuated by the stratospheric ozone layer, it is no t fully blocked. It is very strongly absorbed in tissues and penetrates only superficially into the body; thus it directly affects only the eye and the skin. Detrimental consequences for the eye could include impaired vision, since UV radiation has been reported to cause opacification of the lens (cataract), losses of productivity and other destructive effects in plants [8-12]. Quite apart from its damaging effects, the UVB can also be beneficial; it initiates the production of vitamin D that helps build and maintain human bones as well as it may prevent against certain types of cancer [4, 13]. Although UVB comprises the most energetic wavelengths, several studies showed that UVA is also hazardous, producing skin damage and premature skin photo-ageing and wrinkling as well as eye damage. The total column ozone at a location is known to vary from day to day, seasonally and annually. Periodicity related to quasi-biennial and solar cycles has also been associated with the total column ozone variation [14]. UV-B radiation is strongly absorbed by stratospheric ozone, and its intensity at the surface depends on the ozone layer concentration [15, 16]. Studies on stratospheric ozone depletion at many loca- tions on the globe are being made using instruments like 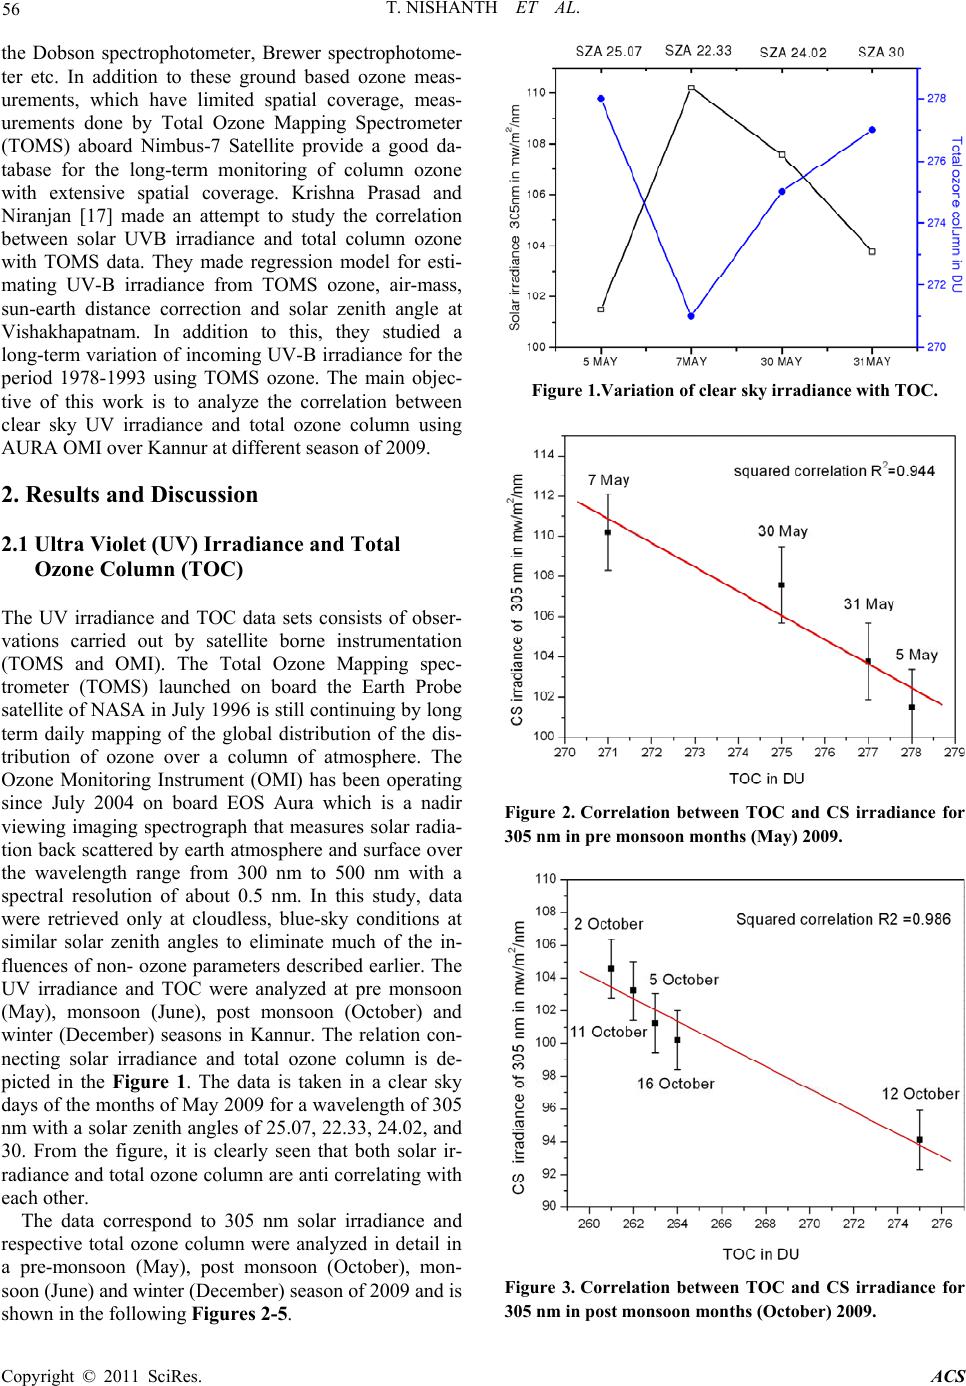 56 T. NISHANTH ET AL. the Dobson spectrophotometer, Brewer spectrophotome- ter etc. In addition to these ground based ozone meas- urements, which have limited spatial coverage, meas- urements done by Total Ozone Mapping Spectrometer (TOMS) aboard Nimbus-7 Satellite provide a good da- tabase for the long-term monitoring of column ozone with extensive spatial coverage. Krishna Prasad and Niranjan [17] made an attempt to study the correlation between solar UVB irradiance and total column ozone with TOMS data. They made regression model for esti- mating UV-B irradiance from TOMS ozone, air-mass, sun-earth distance correction and solar zenith angle at Vishakhapatnam. In addition to this, they studied a long-term variation of incoming UV-B irradiance for the period 1978-1993 using TOMS ozone. The main objec- tive of this work is to analyze the correlation between clear sky UV irradiance and total ozone column using AURA OMI over Kannur at different season of 2009. 2. Results and Discussion 2.1 Ultra Violet (UV) Irradiance and Total Ozone Column (TOC) The UV irradiance and TOC data sets consists of obser- vations carried out by satellite borne instrumentation (TOMS and OMI). The Total Ozone Mapping spec- trometer (TOMS) launched on board the Earth Probe satellite of NASA in Ju ly 1996 is still con tinuing by long term daily mapping of the global distribution of the dis- tribution of ozone over a column of atmosphere. The Ozone Monitoring Instrument (OMI) has been operating since July 2004 on board EOS Aura which is a nadir viewing imaging spectrograph that measures solar radia- tion back scattered by earth atmosphere and surface over the wavelength range from 300 nm to 500 nm with a spectral resolution of about 0.5 nm. In this study, data were retrieved only at cloudless, blue-sky conditions at similar solar zenith angles to eliminate much of the in- fluences of non- ozone parameters described earlier. The UV irradiance and TOC were analyzed at pre monsoon (May), monsoon (June), post monsoon (October) and winter (December) seasons in Kannur. The relation con- necting solar irradiance and total ozone column is de- picted in the Figure 1. The data is taken in a clear sky days of the months of May 2009 for a wavelength of 305 nm with a solar zenith angles of 25.07, 22.33, 24.02, and 30. From the figure, it is clearly seen that both solar ir- radiance and total ozone column are anti correlating with each other. The data correspond to 305 nm solar irradiance and respective total ozone column were analyzed in detail in a pre-monsoon (May), post monsoon (October), mon- soon (June) and winter (December) season of 2009 and is shown in the follo wing Figures 2-5. Figure 1.Variation of clear sky irradiance with TOC. Figure 2. Correlation between TOC and CS irradiance for 305 nm in pre monsoon months (May) 2009. Figure 3. Correlation between TOC and CS irradiance for 305 nm in post monsoon months (October) 2009. Copyright © 2011 SciRes. ACS 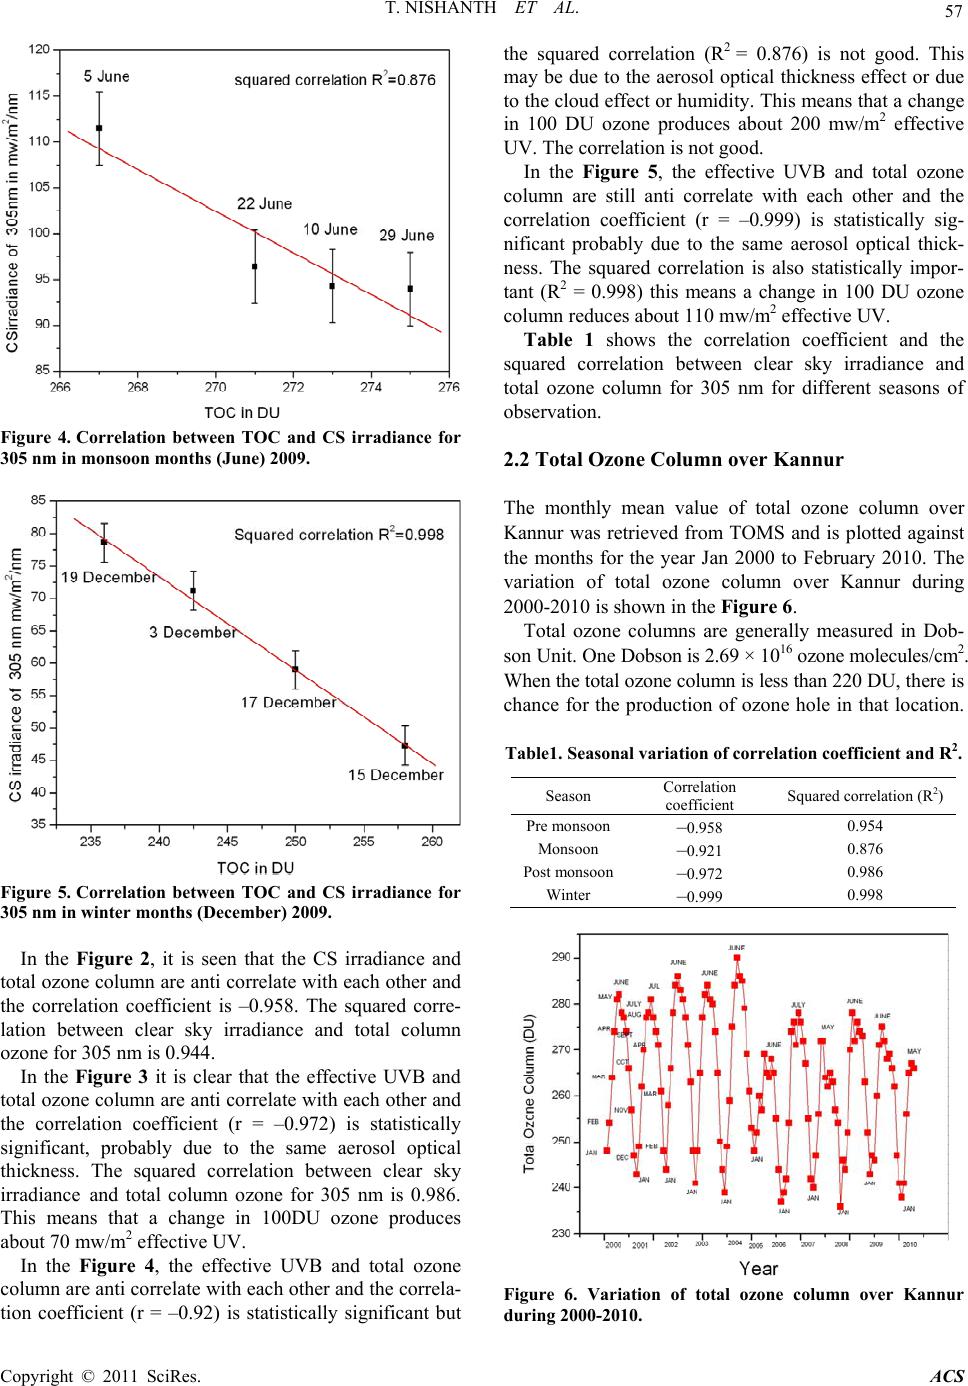 T. NISHANTH ET AL. 57 Figure 4. Correlation between TOC and CS irradiance for 305 nm in monsoon months (June) 2009. Figure 5. Correlation between TOC and CS irradiance for 305 nm in winter months (December) 2009. In the Figure 2, it is seen that the CS irradiance and total ozone column are anti correlate with each other and the correlation coefficient is –0.958. The squared corre- lation between clear sky irradiance and total column ozone for 305 nm is 0.944. In the Figure 3 it is clear that the effective UVB and total ozone column are anti correlate with each other and the correlation coefficient (r = –0.972) is statistically significant, probably due to the same aerosol optical thickness. The squared correlation between clear sky irradiance and total column ozone for 305 nm is 0.986. This means that a change in 100DU ozone produces about 70 mw/m2 effective UV. In the Figure 4, the effective UVB and total ozone column are anti correlate with each other and the correla- tion coefficient (r = –0.92) is statistically significant but the squared correlation (R2 = 0.876) is not good. This may be due to the aerosol optical thickness effect or due to the cloud effect or humidity. This means that a change in 100 DU ozone produces about 200 mw/m2 effective UV. The correlation is not good. In the Figure 5, the effective UVB and total ozone column are still anti correlate with each other and the correlation coefficient (r = –0.999) is statistically sig- nificant probably due to the same aerosol optical thick- ness. The squared correlation is also statistically impor- tant (R2 = 0.998) this means a change in 100 DU ozone column reduces about 110 mw/m2 effective UV. Table 1 shows the correlation coefficient and the squared correlation between clear sky irradiance and total ozone column for 305 nm for different seasons of observation. 2.2 Total Ozone Column over Kannur The monthly mean value of total ozone column over Kannur was retrieved from TOMS and is plotted against the months for the year Jan 2000 to February 2010. The variation of total ozone column over Kannur during 2000-2010 is shown in the Figure 6. Total ozone columns are generally measured in Dob- son Unit . One Dobson is 2.69 × 10¹⁶ ozone molecules/cm2. When the total ozone column is less than 220 DU, ther e i s chance for the production of ozone hole in that location. Table1. Seasonal variation of correlation coefficient and R2. Season Correlation coefficient Squared correlation (R2) Pre monsoon–0.958 0.954 Monsoon –0.921 0.876 Post monsoon–0.972 0.986 Winter –0.999 0.998 Figure 6. Variation of total ozone column over Kannur during 2000-2010. Copyright © 2011 SciRes. ACS 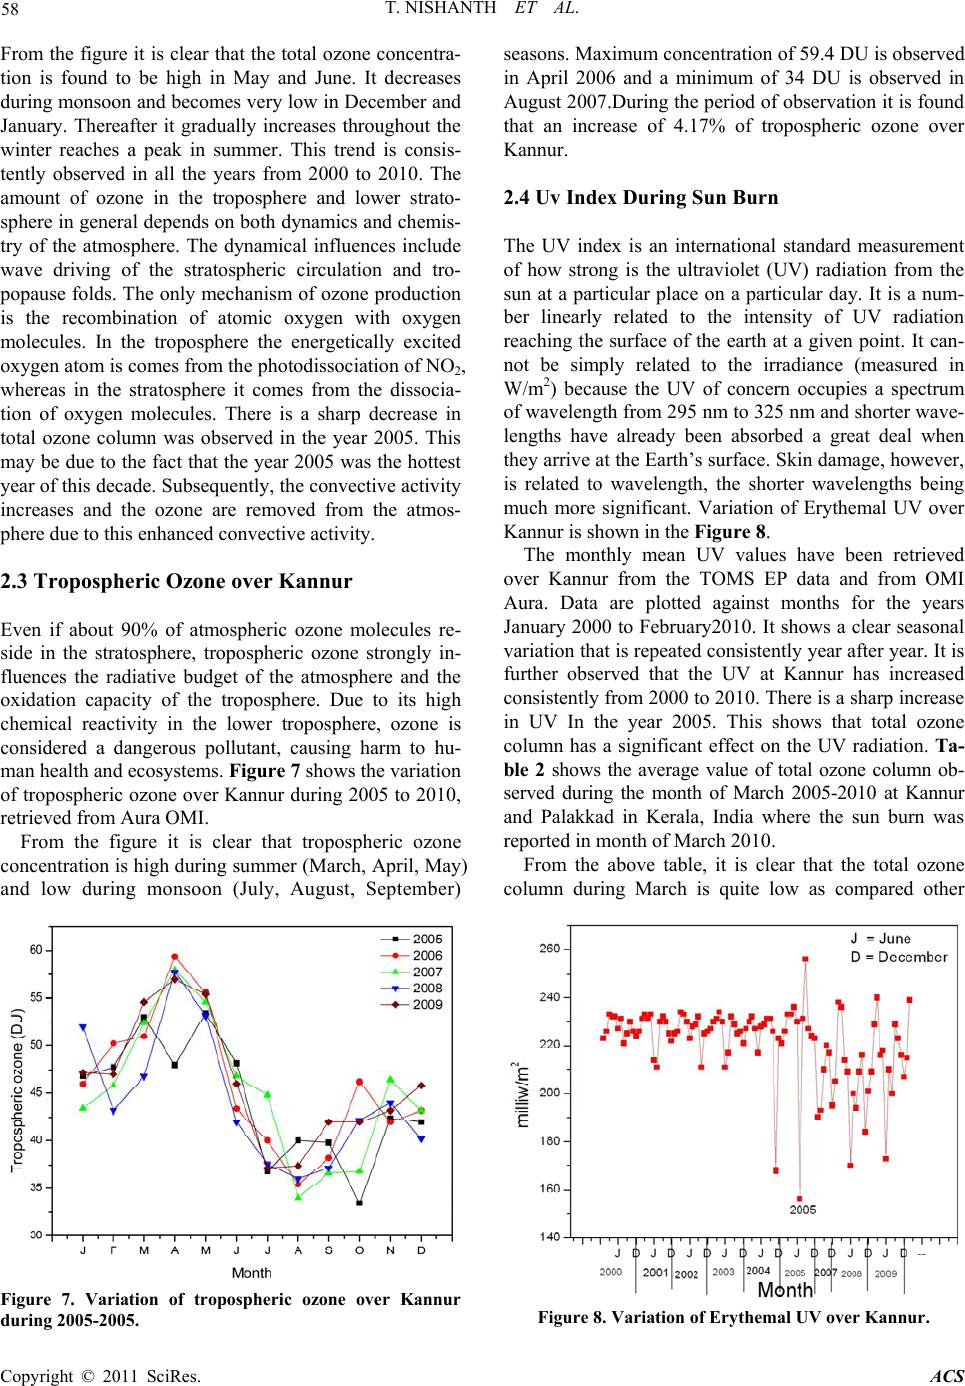 58 T. NISHANTH ET AL. From the figure it is clear that the total ozone concentra- tion is found to be high in May and June. It decreases during monsoon and becomes very low in December and January. Thereafter it gradually increases throughout the winter reaches a peak in summer. This trend is consis- tently observed in all the years from 2000 to 2010. The amount of ozone in the troposphere and lower strato- sphere in general depends on both dynamics and chemis- try of the atmosphere. The dynamical influences include wave driving of the stratospheric circulation and tro- popause folds. The only mechanism of ozone production is the recombination of atomic oxygen with oxygen molecules. In the troposphere the energetically excited oxygen atom is comes from the photodissociation of NO2, whereas in the stratosphere it comes from the dissocia- tion of oxygen molecules. There is a sharp decrease in total ozone column was observed in the year 2005. This may be due to the fact that the year 2005 was the hottest year of this decade. Subsequently, the convectiv e activity increases and the ozone are removed from the atmos- phere due to this enhanced convective activity. 2.3 Tropospheric Ozone over Kannur Even if about 90% of atmospheric ozone molecules re- side in the stratosphere, tropospheric ozone strongly in- fluences the radiative budget of the atmosphere and the oxidation capacity of the troposphere. Due to its high chemical reactivity in the lower troposphere, ozone is considered a dangerous pollutant, causing harm to hu- man health and ecosystems. Figure 7 shows the variation of troposph eric ozone over Kannur during 2005 to 2010, retrieved from Aur a O MI. From the figure it is clear that tropospheric ozone concentration is high during summer (March, April, May) and low during monsoon (July, August, September) Figure 7. Variation of tropospheric ozone over Kannur during 2005-2005. seasons. Maximum concentration of 59.4 DU is observed in April 2006 and a minimum of 34 DU is observed in August 2007.During the period of observation it is found that an increase of 4.17% of tropospheric ozone over Kannur. 2.4 Uv Index During Sun Burn The UV index is an international standard measurement of how strong is the ultraviolet (UV) radiation from the sun at a particular place on a particular day. It is a num- ber linearly related to the intensity of UV radiation reaching the surface of the earth at a given point. It can- not be simply related to the irradiance (measured in W/m2) because the UV of concern occupies a spectrum of wavelength from 295 nm to 325 nm and shorter wave- lengths have already been absorbed a great deal when they arrive at the Earth’s surface. Skin damage, however, is related to wavelength, the shorter wavelengths being much more significant. Variation of Erythemal UV over Kannur is shown in the Figure 8. The monthly mean UV values have been retrieved over Kannur from the TOMS EP data and from OMI Aura. Data are plotted against months for the years January 2000 to February2010. It shows a clear seasonal variation that is repeated consistently year after year. It is further observed that the UV at Kannur has increased consistently from 2000 to 2010. There is a sharp increase in UV In the year 2005. This shows that total ozone column has a significant effect on the UV radiation. Ta- ble 2 shows the average value of total ozone column ob- served during the month of March 2005-2010 at Kannur and Palakkad in Kerala, India where the sun burn was reported in month of Mar ch 2010. From the above table, it is clear that the total ozone column during March is quite low as compared other Figure 8. Variation of Erythemal UV over Kannur. Copyright © 2011 SciRes. ACS 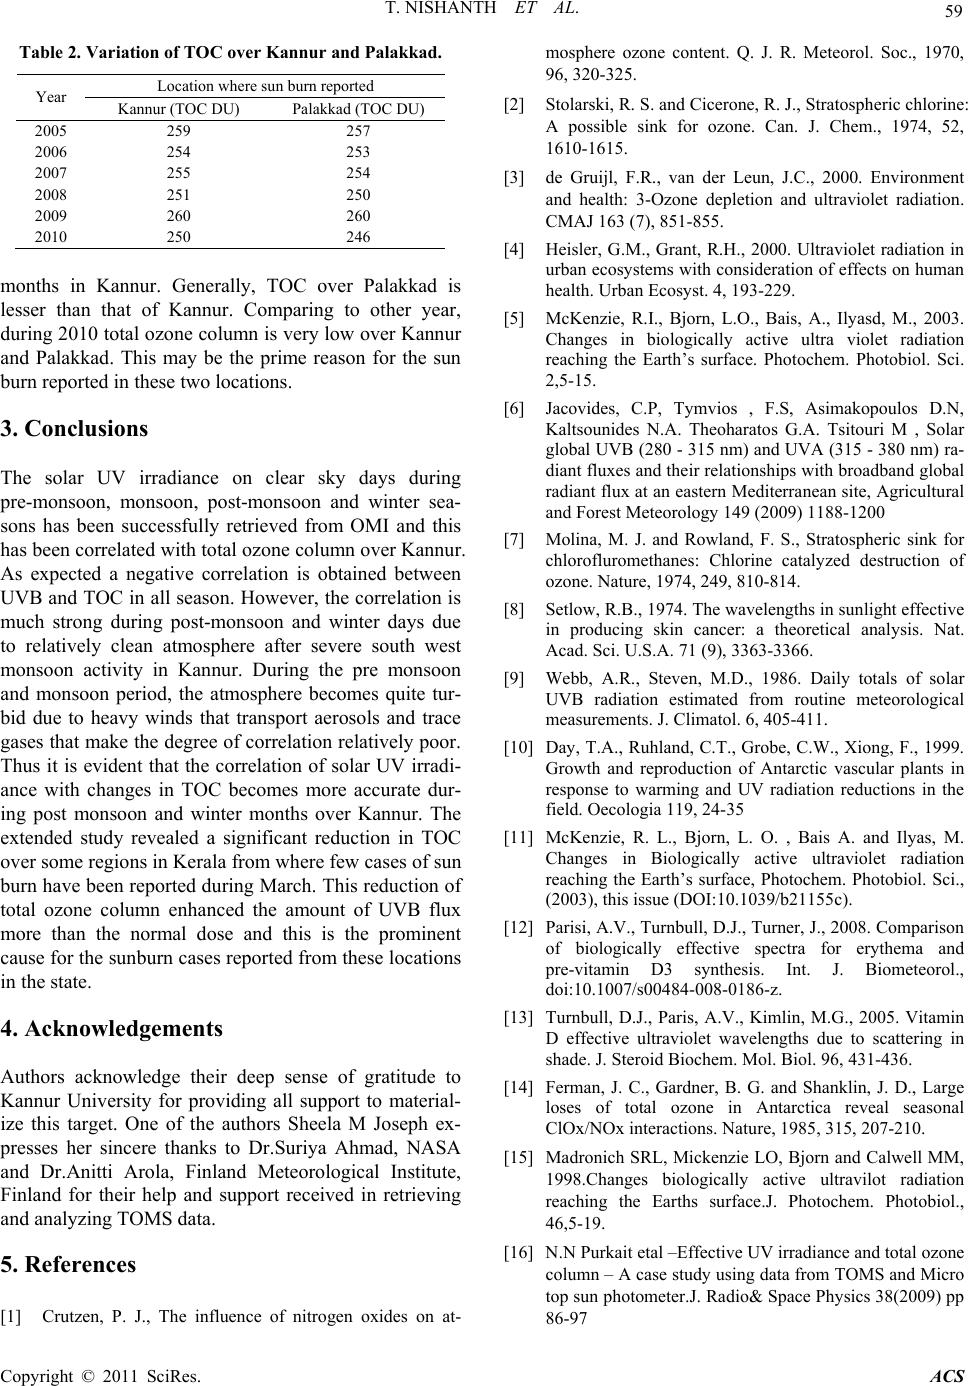 T. NISHANTH ET AL. 59 Table 2. Variation of TOC over Kannur and Palakkad. Location where sun burn reported Year Kannur (TOC DU) Palakkad (TOC DU) 2005 259 257 2006 254 253 2007 255 254 2008 251 250 2009 260 260 2010 250 246 months in Kannur. Generally, TOC over Palakkad is lesser than that of Kannur. Comparing to other year, during 2010 total ozone column is very low over Kannur and Palakkad. This may be the prime reason for the sun burn reported in these two locations. 3. Conclusions The solar UV irradiance on clear sky days during pre-monsoon, monsoon, post-monsoon and winter sea- sons has been successfully retrieved from OMI and this has been correlated with total ozon e column over Kannur. As expected a negative correlation is obtained between UVB and TOC in all season. Howev er, the correlation is much strong during post-monsoon and winter days due to relatively clean atmosphere after severe south west monsoon activity in Kannur. During the pre monsoon and monsoon period, the atmosphere becomes quite tur- bid due to heavy winds that transport aerosols and trace gases that make the degree of correlation relatively poor. Thus it is evident that the correlation of solar UV irradi- ance with changes in TOC becomes more accurate dur- ing post monsoon and winter months over Kannur. The extended study revealed a significant reduction in TOC over some regions in Kerala from where few cases of sun burn have been reported during March. This reduction of total ozone column enhanced the amount of UVB flux more than the normal dose and this is the prominent cause for the sunburn cases reported from these locations in the state. 4. Acknowledgements Authors acknowledge their deep sense of gratitude to Kannur University for providing all support to material- ize this target. One of the authors Sheela M Joseph ex- presses her sincere thanks to Dr.Suriya Ahmad, NASA and Dr.Anitti Arola, Finland Meteorological Institute, Finland for their help and support received in retrieving and analyzing TOMS data. 5. References [1] Crutzen, P. J., The influence of nitrogen oxides on at- mosphere ozone content. Q. J. R. Meteorol. Soc., 1970, 96, 320-325. [2] Stolarski, R. S. and Cicerone, R. J., Stratospheric chlorine: A possible sink for ozone. Can. J. Chem., 1974, 52, 1610-1615. [3] de Gruijl, F.R., van der Leun, J.C., 2000. Environment and health: 3-Ozone depletion and ultraviolet radiation. CMAJ 163 (7), 851-855. [4] Heisler, G.M., Grant, R.H., 2000. Ultraviolet radiation in urban ecosystems with consideration of effects on human health. Urban Ecosyst. 4, 193-229. [5] McKenzie, R.I., Bjorn, L.O., Bais, A., Ilyasd, M., 2003. Changes in biologically active ultra violet radiation reaching the Earth’s surface. Photochem. Photobiol. Sci. 2,5-15. [6] Jacovides, C.P, Tymvios , F.S, Asimakopoulos D.N, Kaltsounides N.A. Theoharatos G.A. Tsitouri M , Solar global UVB (280 - 315 nm) and UVA (315 - 380 nm) ra- diant fluxes and their relationships with broadband global radiant flux at an eastern Mediterranean site, Agricultural and Forest Meteorology 149 (2009) 1188-1200 [7] Molina, M. J. and Rowland, F. S., Stratospheric sink for chlorofluromethanes: Chlorine catalyzed destruction of ozone. Nature, 1974, 249, 810-814. [8] Setlow, R.B., 1974. The wavelengths in sunlight effective in producing skin cancer: a theoretical analysis. Nat. Acad. Sci. U.S.A. 71 (9), 3363-3366. [9] Webb, A.R., Steven, M.D., 1986. Daily totals of solar UVB radiation estimated from routine meteorological measurements. J. Climatol. 6, 405-411. [10] Day, T.A., Ruhland, C.T., Grobe, C.W., Xiong, F., 1999. Growth and reproduction of Antarctic vascular plants in response to warming and UV radiation reductions in the field. Oecologia 119, 24-35 [11] McKenzie, R. L., Bjorn, L. O. , Bais A. and Ilyas, M. Changes in Biologically active ultraviolet radiation reaching the Earth’s surface, Photochem. Photobiol. Sci., (2003), this issue (DOI:10.1039/b21155c). [12] Parisi, A.V., Turnbull, D.J., Turner, J., 2008. Comparison of biologically effective spectra for erythema and pre-vitamin D3 synthesis. Int. J. Biometeorol., doi:10.1007/s00484-008-0186-z. [13] Turnbull, D.J., Paris, A.V., Kimlin, M.G., 2005. Vitamin D effective ultraviolet wavelengths due to scattering in shade. J. Steroid Biochem. Mol. Biol. 96, 431-436. [14] Ferman, J. C., Gardner, B. G. and Shanklin, J. D., Large loses of total ozone in Antarctica reveal seasonal ClOx/NOx interactions. Nature, 1985, 315, 207-210. [15] Madronich SRL, Mickenzie LO, Bjorn and Calwell MM, 1998.Changes biologically active ultravilot radiation reaching the Earths surface.J. Photochem. Photobiol., 46,5-19. [16] N.N Purkait etal –Effective UV irradiance and total ozone column – A case study using data from TOMS and Micro top sun photometer.J. Radio& Space Physics 38(2009) pp 86-97 Copyright © 2011 SciRes. ACS  T. NISHANTH ET AL. Copyright © 2011 SciRes. ACS 60 [17] Krishna Prasad NV and Niranjan K, Solar UV-B Irradi- ance at a tropical Indian station Visakhapatnam (17.70˚ North, 83.30˚ East) - a Relation with TOMS Ozone, TAO, Vol. 16, No. 1, 215-229, March 2005 |