Paper Menu >>
Journal Menu >>
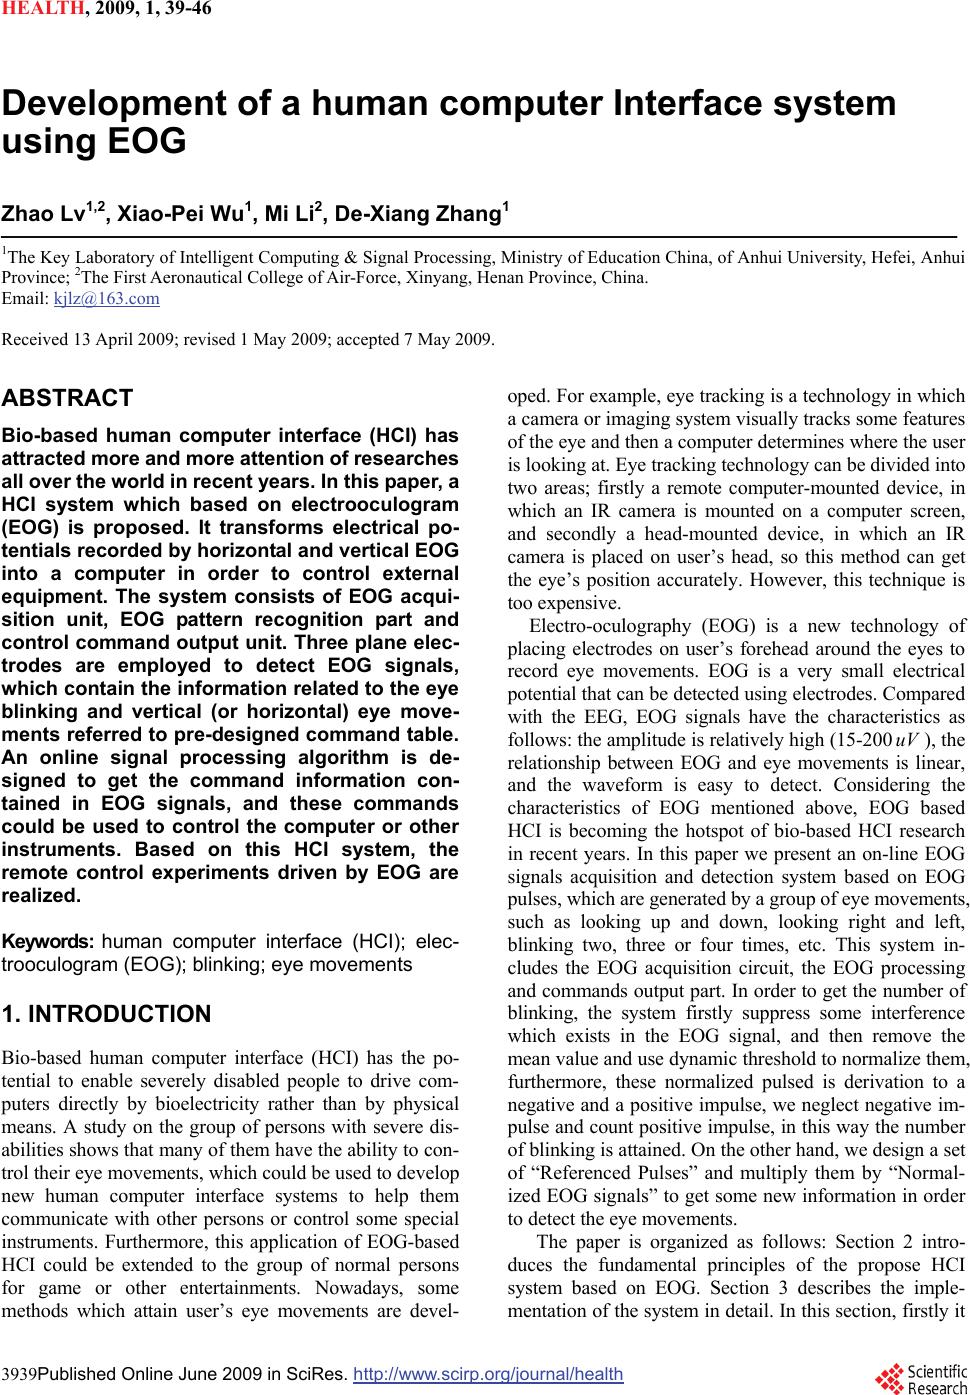 HEALTH, 2009, 1, 39-46 3939Published Online June 2009 in SciRes. http://www.scirp.org/journal/health Development of a human computer Interface system using EOG Zhao Lv1,2, Xiao-Pei Wu1, Mi Li2, De-Xiang Zhang1 1The Key Laboratory of Intelligent Computing & Signal Processing, Ministry of Education China, of Anhui University, Hefei, Anhui Province; 2The First Aeronautical College of Air-Force, Xinyang, Henan Province, China. Email: kjlz@163.com Received 13 April 2009; revised 1 May 2009; accepted 7 May 2009. ABSTRACT Bio-based human computer interface (HCI) has attracted more and more attention of researches all over the world in recent years. In this paper, a HCI system which based on electrooculogram (EOG) is proposed. It transforms electrical po- tentials recorded by horizontal and vertical EOG into a computer in order to control external equipment. The system consists of EOG acqui- sition unit, EOG pattern recognition part and control command output unit. Three plane elec- trodes are employed to detect EOG signals, which contain the information related to the eye blinking and vertical (or horizontal) eye move- ments referred to pre-designed command table. An online signal processing algorithm is de- signed to get the command information con- tained in EOG signals, and these commands could be used to control the computer or other instruments. Based on this HCI system, the remote control experiments driven by EOG are realized. Keywor ds: human computer interface (HCI); elec- trooculogram (EOG); blinking; eye movements 1. INTRODUCTION Bio-based human computer interface (HCI) has the po- tential to enable severely disabled people to drive com- puters directly by bioelectricity rather than by physical means. A study on the group of persons with severe dis- abilities shows that many of them have the ability to con- trol their eye movements, which could be used to develop new human computer interface systems to help them communicate with other persons or control some special instruments. Furthermore, this application of EOG-based HCI could be extended to the group of normal persons for game or other entertainments. Nowadays, some methods which attain user’s eye movements are devel- oped. For example, eye tracking is a technology in which a camera or imaging system visually tracks some features of the eye and then a computer determines where the user is looking at. Eye tracking technology can be divided into two areas; firstly a remote computer-mounted device, in which an IR camera is mounted on a computer screen, and secondly a head-mounted device, in which an IR camera is placed on user’s head, so this method can get the eye’s position accurately. However, this technique is too expensive. Electro-oculography (EOG) is a new technology of placing electrodes on user’s forehead around the eyes to record eye movements. EOG is a very small electrical potential that can be detected using electrodes. Compared with the EEG, EOG signals have the characteristics as follows: the amplitude is relatively high (15-200uV ), the relationship between EOG and eye movements is linear, and the waveform is easy to detect. Considering the characteristics of EOG mentioned above, EOG based HCI is becoming the hotspot of bio-based HCI research in recent years. In this paper we present an on-line EOG signals acquisition and detection system based on EOG pulses, which are generated by a group of eye movements, such as looking up and down, looking right and left, blinking two, three or four times, etc. This system in- cludes the EOG acquisition circuit, the EOG processing and commands output part. In order to get the number of blinking, the system firstly suppress some interference which exists in the EOG signal, and then remove the mean value and use dynamic threshold to normalize them, furthermore, these normalized pulsed is derivation to a negative and a positive impulse, we neglect negative im- pulse and count positive impulse, in this way the number of blinking is attained. On the other hand, we design a set of “Referenced Pulses” and multiply them by “Normal- ized EOG signals” to get some new information in order to detect the eye movements. The paper is organized as follows: Section 2 intro- duces the fundamental principles of the propose HCI system based on EOG. Section 3 describes the imple- mentation of the system in detail. In this section, firstly it 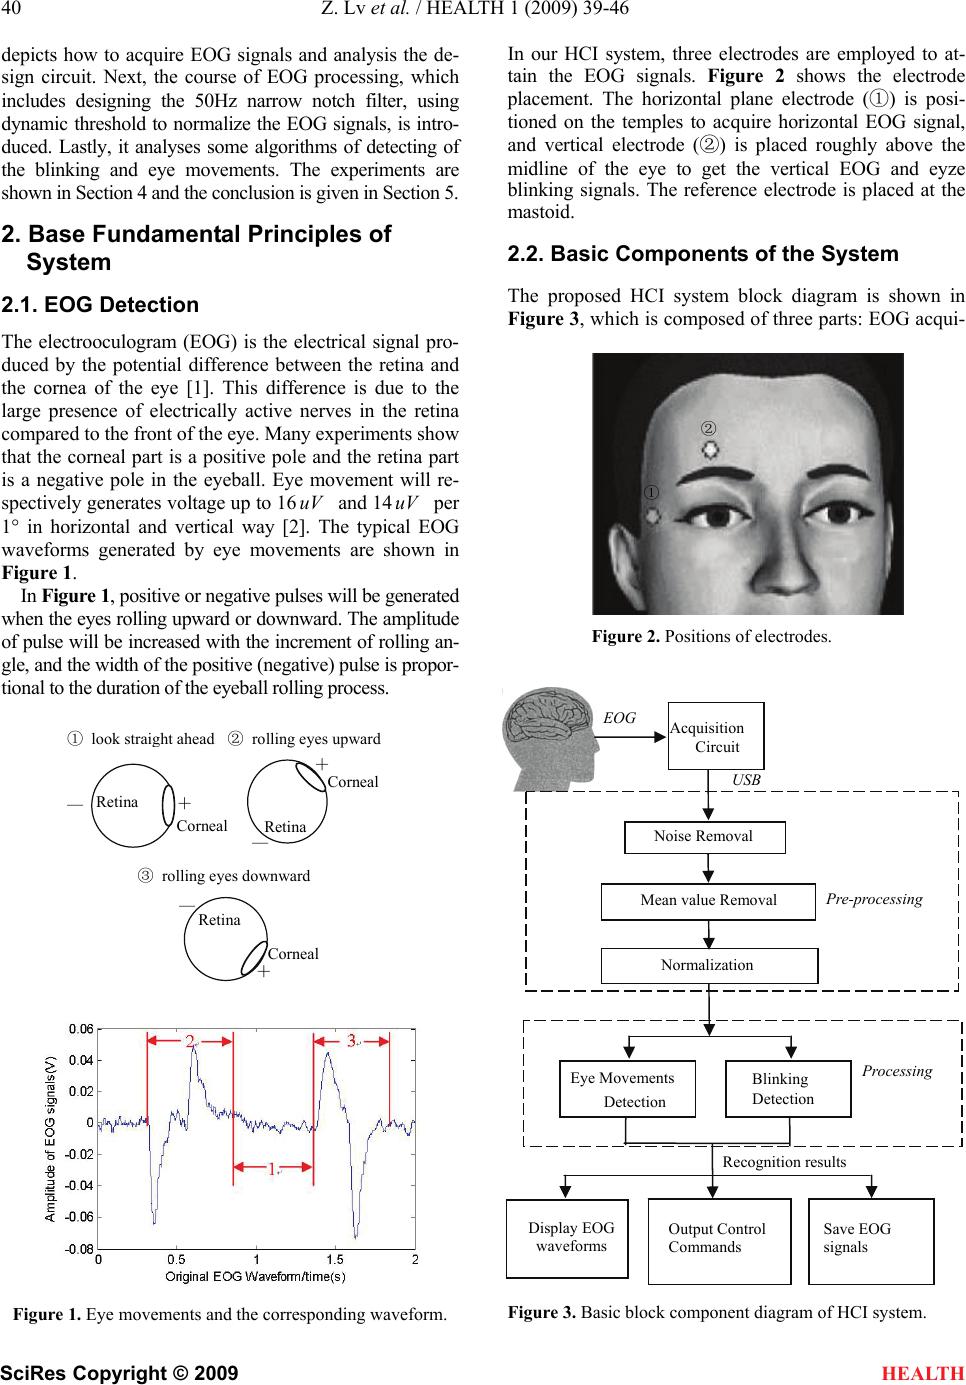 40 Z. Lv et al. / HEALTH 1 (2009) 39-46 SciRes Copyright © 2009 HEALTH depicts how to acquire EOG signals and analysis the de- sign circuit. Next, the course of EOG processing, which includes designing the 50Hz narrow notch filter, using dynamic threshold to normalize the EOG signals, is intro- duced. Lastly, it analyses some algorithms of detecting of the blinking and eye movements. The experiments are shown in Section 4 and the conclusion is given in Section 5. 2. Base Fundamental Principles of System 2.1. EOG Detection The electrooculogram (EOG) is the electrical signal pro- duced by the potential difference between the retina and the cornea of the eye [1]. This difference is due to the large presence of electrically active nerves in the retina compared to the front of the eye. Many experiments show that the corneal part is a positive pole and the retina part is a negative pole in the eyeball. Eye movement will re- spectively generates voltage up to 16uV and 14uV per 1° in horizontal and vertical way [2]. The typical EOG waveforms generated by eye movements are shown in Figure 1. In Figure 1, positive or negative pulses will be generated when the eyes rolling upward or downward. The amplitude of pulse will be increased with the increment of rolling an- gle, and the width of the positive (negative) pulse is propor- tional to the duration of the eyeball rolling process. — + Retina Corneal — + Retina Corneal ③ rolling eyes downward — + Corneal ① look strai g ht ahead ② rolling eyes upward Retina Figure 1. Eye movements and the corresponding waveform. In our HCI system, three electrodes are employed to at- tain the EOG signals. Figure 2 shows the electrode placement. The horizontal plane electrode (①) is posi- tioned on the temples to acquire horizontal EOG signal, and vertical electrode (②) is placed roughly above the midline of the eye to get the vertical EOG and eyze blinking signals. The reference electrode is placed at the mastoid. 2.2. Basic Components of the System The proposed HCI system block diagram is shown in Figure 3, which is composed of three parts: EOG acqui- ② ① Figure 2. Positions of electrodes. EOG Acquisition Circuit USB Figure 3. Basic block component diagram of HCI system. Blinking Detection Noise Removal Eye Movements Detection Pre-processing Mean value Removal Normalization Processing Output Control Commands Recognition results Display EOG Save EOG signals waveforms 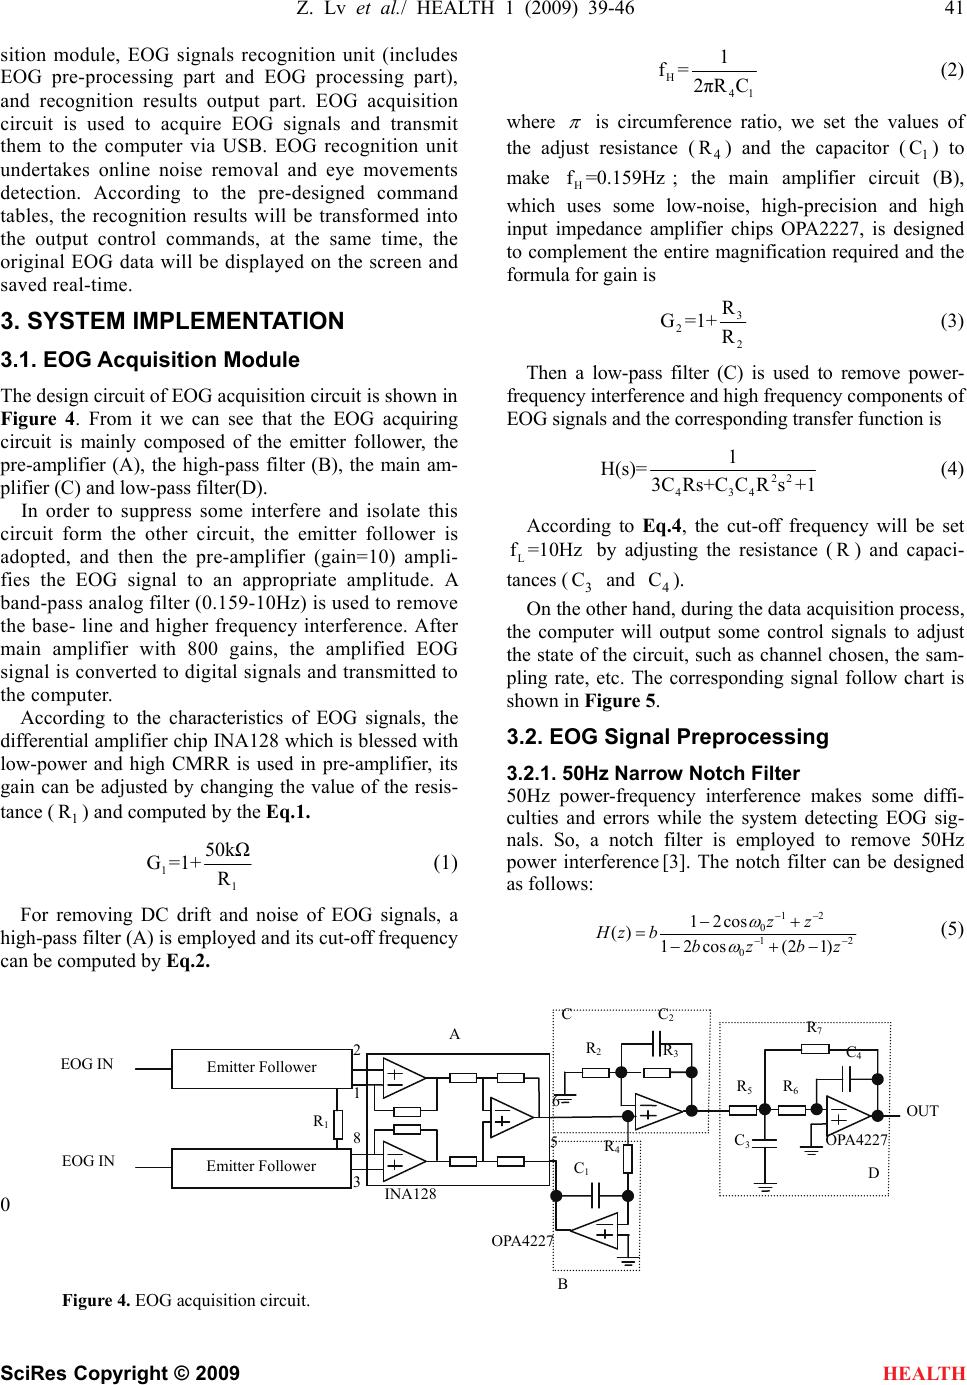 Z. Lv et al./ HEALTH 1 (2009) 39-46 41 SciRes Copyright © 2009 sition module, EOG signals recognition unit (includes EOG pre-processing part and EOG processing part), and recognition results output part. EOG acquisition circuit is used to acquire EOG signals and transmit them to the computer via USB. EOG recognition unit undertakes online noise removal and eye movements detection. According to the pre-designed command tables, the recognition results will be transformed into the output control commands, at the same time, the original EOG data will be displayed on the screen and saved real-time. H 41 1 f= 2πRC (2) where is circumference ratio, we set the values of the adjust resistance () and the capacitor () to make ; the main amplifier circuit (B), which uses some low-noise, high-precision and high input impedance amplifier chips OPA2227, is designed to complement the entire magnification required and the formula for gain is 4 R1 C H f =0.159Hz 3 2 2 R G=1+ R (3) 3. SYSTEM IMPLEMENTATION 3.1. EOG Acquisition Module Then a low-pass filter (C) is used to remove power- frequency interference and high frequency components of EOG signals and the corresponding transfer function is The design circuit of EOG acquisition circuit is shown in Figure 4. From it we can see that the EOG acquiring circuit is mainly composed of the emitter follower, the pre-amplifier (A), the high-pass filter (B), the main am- plifier (C) and low-pass filter(D). 22 434 1 H(s)= 3C Rs+CC R s+1 (4) In order to suppress some interfere and isolate this circuit form the other circuit, the emitter follower is adopted, and then the pre-amplifier (gain=10) ampli- fies the EOG signal to an appropriate amplitude. A band-pass analog filter (0.159-10Hz) is used to remove the base- line and higher frequency interference. After main amplifier with 800 gains, the amplified EOG signal is converted to digital signals and transmitted to the computer. According to Eq.4, the cut-off frequency will be set by adjusting the resistance () and capaci- tances ( and C). L f=10Hz 3 C R 4 On the other hand, during the data acquisition process, the computer will output some control signals to adjust the state of the circuit, such as channel chosen, the sam- pling rate, etc. The corresponding signal follow chart is shown in Figure 5. According to the characteristics of EOG signals, the differential amplifier chip INA128 which is blessed with low-power and high CMRR is used in pre-amplifier, its gain can be adjusted by changing the value of the resis- tance () and computed by the Eq.1. 1 R 3.2. EOG Signal Preprocessing 3.2.1. 50Hz Narrow Notch Filter 50Hz power-frequency interference makes some diffi- culties and errors while the system detecting EOG sig- nals. So, a notch filter is employed to remove 50Hz power interference [3]. The notch filter can be designed as follows: 1 1 50kΩ G=1+R (1) For removing DC drift and noise of EOG signals, a high-pass filter (A) is employed and its cut-off frequency can be computed by Eq.2. 21 0 21 0 )12(cos21 cos21 )( zbzb zz bzH (5) HEALTH D A OPA4227 R7 R6 R5 C4 C3 C B OPA4227 5 6 C1 R4 8 3 2 1 R1 INA128 C2 R3 R2 Emitter Follower Emitter Follower EOG IN EOG IN OUT 0 Figure 4. EOG acquisition circuit. 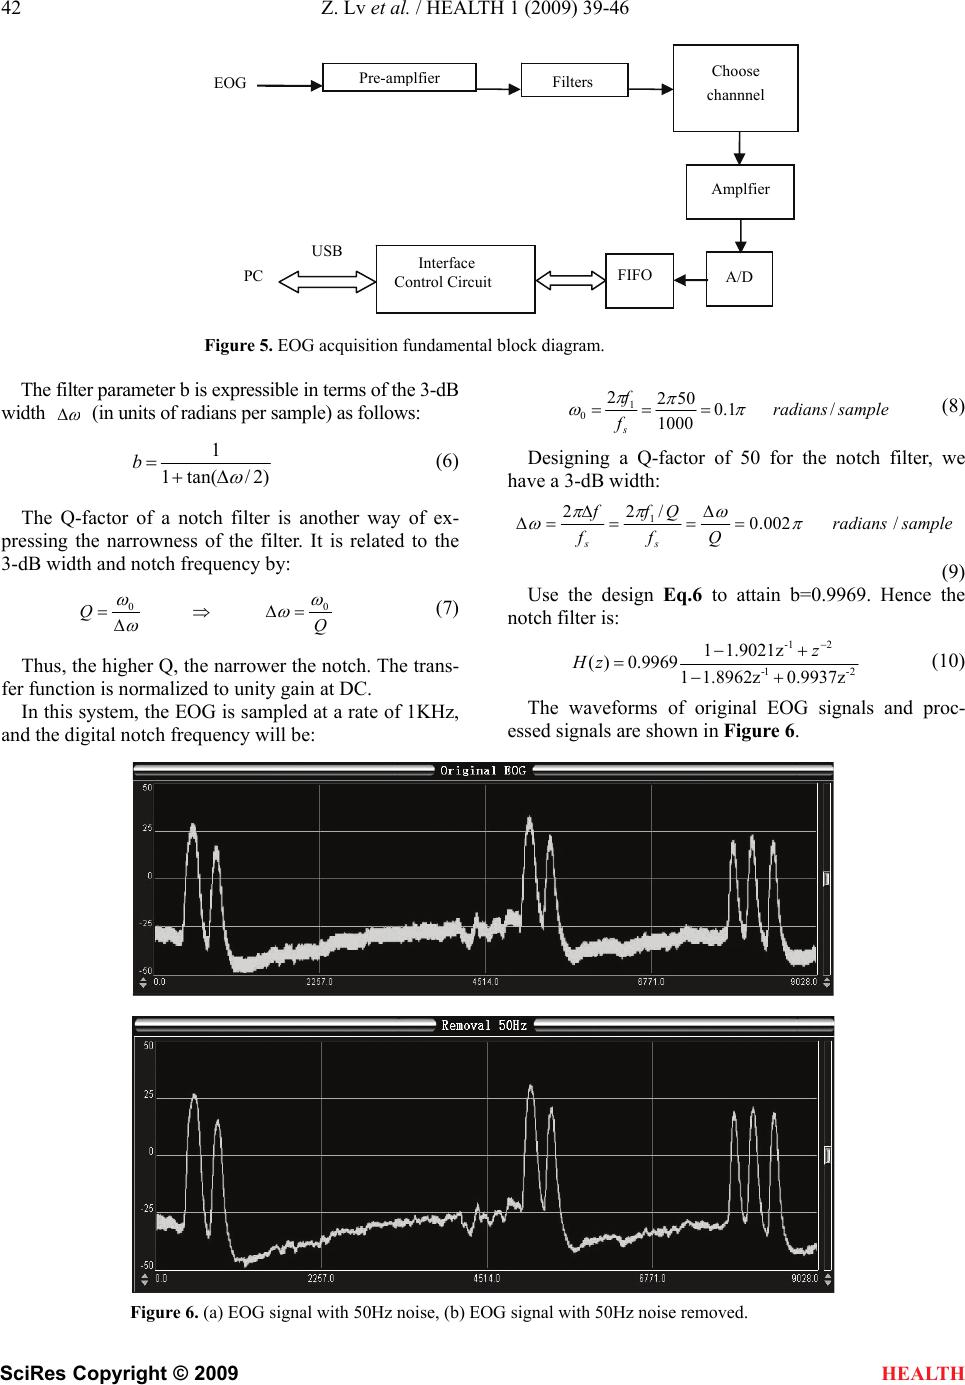 42 Z. Lv et al. / HEALTH 1 (2009) 39-46 SciRes Copyright © 2009 HEALTH Figure 5. EOG acquisition fundamental block diagram. The filter parameter b is expressible in terms of the 3-dB width (in units of radians per sample) as follows: )2/tan(1 1 b (6) The Q-factor of a notch filter is another way of ex- pressing the narrowness of the filter. It is related to the 3-dB width and notch frequency by: Q Q00 (7) Thus, the higher Q, the narrower the notch. The trans- fer function is normalized to unity gain at DC. In this system, the EOG is sampled at a rate of 1KHz, and the digital notch frequency will be: sampleradians f f s /1.0 1000 502 21 0 (8) Designing a Q-factor of 50 for the notch filter, we have a 3-dB width: sampleradians Qf Qf f f ss /002.0 /22 1 (9) Use the design Eq.6 to attain b=0.9969. Hence the notch filter is: 2-1- 2-1 0.9937z1.8962z1 1.9021z1 9969.0)( z zH (10) The waveforms of original EOG signals and proc- essed signals are shown in Figure 6. Figure 6. (a) EOG signal with 50Hz noise, (b) EOG signal with 50Hz noise removed. Filters Amplfier A/D Interface Control Circuit PC USB Choose channnel FIFO Pre-am p lfie r EOG  Z. Lv et al./ HEALTH 1 (2009) 39-46 43 SciRes Copyright © 2009 HEALTH 3.2.2. Using Dynamic Threshold to Normalize The amplitude of EOG signals that produced by different users is different, even if every blinking of a person is different too. To avoid the problem of signal variability, in our HCI system, a threshold method is employed to transfer the EOG pulses into the square pulses for further processing (we call it EOG pulse normalization). But the small fluctuations on EOG waveform may bring some troubles in EOG pulse normalization. We deal with the problem using the dynamic threshold instead of tradi- tional fixed threshold. Figure 7 interprets the funda- mental of dynamic threshold. In Figure 7, supposing the initial threshold is A, the dynamic range is B. It’s obvious that three rectangle pulses will generate if only the fixed threshold A is used in the detection. In an approach using dynamic threshold, once the system detects the first sample, the threshold changes to A-B, then keeps this adjusted threshold until the second sample is detected, and the threshold changes to the initial value A again, vice versa. If the amplitude of EOG signals is higher (lower) than the initial thresh- old A, it is set to 1, otherwise, it equals 0. In this way, some rectangular pulses can be acquired and waveforms are shown in Figure 8. 3.3. Blinking Detection 3.3.1. Derivation To count blinking in a specified time conveniently, nor- malized signals should be processed derivation firstly. The waveforms are shown in Figure 9. After derivation, Figure 7. Fundamental of dynamic threshold. blinking can be recognized easily and counted in a nu- merical way. 3.3.2. Counting Blinking When the system works, the program only detects the positive pulses and ignores the negative ones. The posi- tion of the first positive pulse is named “start_point”. When the second pulse comes, its position is named “end_point”. If the value(end_point-start_point) which named DIF, is smaller than 1500(sample at a rate of 1KHz, so the time is 1.5s), the system will identify the process as a blinking action, and the number of blinking adds 1. When the third pulse comes, its position is marked “end_point” instead of the foregoing value, and then adjusts the DIF again. If it is smaller than 1500, the program will continue to increase the number of blinking, else it is recognized as two blinking actions and the number of pulse is cleared. The flow chart of the soft- ware is shown in Figure 10. Figure 8. EOG signals after normalization. Figure 9. EOG signals after derivation. Initial threshold: A First sample Dynamic range: B EOG+50Hz noise Adjusted threshold: A-B Second sample  44 Z. Lv et al. / HEALTH 1 (2009) 39-46 SciRes Copyright © 2009 HEALTH Figure 10. Software flow chart of blinking detecting. 3.4. Eye Movements Detection An online detection algorithm is emphasized in our HCI system. For the sake of an easy explanation, this paper only analyzes the process of detecting vertical move- ments, while the method of detecting horizontal move- ments is same to it. Start 3.4.1. Normalization After the narrow notch filter removed the 50Hz power- frequency interference, the original EOG signals (Fig- ure 11(a)), managed by dynamic threshold (includes a positive and a negative threshold), would be trans- formed to a serial of rectangular pulses which have-1 or 1 in their amplitude, the waveforms are shown in Fig- ure 11(b). 3.4.2. Getting Eye Movement Direction Many experiments show that the phrase difference be- tween the upward-rolling signals and the downward- rolling is 180º. Hence, a series of rectangle pulses which polarity is well-regulated are designed and named as “Referenced Pulses” whose waveform is shown in Fig- ure 12(a). Multiply “Referenced Pulses” by “Normalized EOG signals”, the system gets another series of rectangular pulses, shown in Figure 12(b). Compared with the waveforms in Figure 10(a), it’s obvious that positive pulses mean rolling upward and (a) Original EOG (b) Normalization Figure 11. EOG signals after normalization. Y Initialization DIF<1500? N Y End N First pulse position Next pulse position Blinking number++ Exit program?  Z. Lv et al./ HEALTH 1 (2009) 39-46 45 SciRes Copyright © 2009 HEALTH (a) Referenced Pulses (b) Results Figure 12. Get eye movements direction. negative pulses mean rolling downward. 3.4.3. Judgment The following method is adopted to judge the action of eye movements. Firstly, an array(EOG_UD[1]) is de- fined to record the polarity of two adjacent pulses. If the value of the present sample is 0 and the foregoing sample is 1, then EOG_UD[i]=1(i=0 or 1) and the sys- tem will judge it as a positive pulse. On the contrary, EOG_UD[i]=-1 and it is a negative pulse. Next, the values of EOG_UD[i] should be checked for judging the rolling direction. If EOG_UD[0] and EOG_UD[1] are both 1, that means the user is rolling upward; and so the situation of rolling downward. 4. EXPERIMENTS The system has two input channels and the sampling rate is 1000Hz, sampling precision is 16bit. In course of ex- periment, the screen will play the original EOG signals (like Figure 10(a)) and the result waveforms (like Fig- ure 12(b)) real time, and these results are used to control a remote mini-car to move via computer’s parallel port. When the user rolls his eyes upward twice continually, if he/she observes that the detection is correct in the screen, he /she just blink three times quickly to confirm the action, the program will attain a command to drive the minicar. By contraries, if the detection is error, the user closes eyes for about 3s to restart the system. The direction of eye movements and corresponding actions of the minicar are shown in Table 1. 5. CONCLUTIONS Many applications can be developed using EOG because this technique provides the users with a degree of inde- pendence in the environment. Therefore, any improve- ment in the convenience of this technique would be of great potential utility in the future. If the eye movements are known, various user interfaces can then be developed to control different tasks: spell and speak software pro- grams allow users to write a letter or a message, after which a control system can interpret the message and generate different commands to execute. A similar code can be generated for deaf people, etc. Table 1. Relationship between eye movements and output commands. Eye Movements Commands Upward-Upward Go forward Downward-Downward Go backward Leftward-Leftward Turn left Rightward- Rightward Turn right  46 Z. Lv et al. / HEALTH 1 (2009) 39-46 SciRes Copyright © 2009 HEALTH Experiences show that the system has a high-level sta- bilization after long term testing. Non-linear error of A/D converter is about () and power wastage of supply is less than . The program which uses VC++ 6.0 to achieve runs in win- dows XP, it have not been found some fatal faults, waveforms can show EOG signals exactly and real time. LBS5.1mVLBS 44.21 (5(500 VmA %))10 6. ACKNOWLEDGEMENT The research work described in this paper is supported by nature sci- ence foundation of Anhui province (60771033) and national nature science foundation (070412038). REFERENCES [1] R. Barea, L. Boquete, M. Mazo, and E. Lopez, (2002) System for assisted mobility using eye movements based on electrooculography, IEEE Transactions on Neual Systems and Rehabilitation Engineering, 10(4), 209-218. [2] T. O. Ya, M. K. Asumi, (2005) Development of an input operation for the amyotrophic lateral sclerosis communi- cation tool utilizing EOG, Medical and Biological Engi- neering, 43(1), 172-178. (In Japanese) [3] S. J. Orfanidis, (1999) Introduction to signal processing, Rutgers University, 407, 365-367. |