 Journal of Power and Energy Engineering, 2014, 2, 586-593 Published Online April 2014 in SciRes. http://www.scirp.org/journal/jpee http://dx.doi.org/10.4236/jpee.2014.24079 How to cite this paper: Wu, Y.C., Huang, D.C., Ruan, J.J., Chen, Y.D., Luo, H.W., Sun, X. and Chen, S.B. (2014) Study on Influence of Trees around 10 kV Distribution Line. Journal of Power and Energy Engineering, 2, 586-593. http://dx.doi.org/10.4236/jpee.2014.24079 Study on Influence of Trees around 10 kV Distribution Line Yongcong Wu1, Daochun Huang1, Jiangjun Ruan1, Yuandong Chen2, Hanwu Luo2, Xin Sun2, Shubo Chen2 1School of Electrical Engineering, Wuhan University, Wuhan, China 2Eastern Inner Mongolia Power Ltd., Hohhot , China Email: 362121393@qq.com Received December 2013 Abstract Considering the complexity of the geographical surroundings and the height of 10 kV distribution line, the impact of trees on the lightning performance can not be ignored. A model of lightning po- sition judgment and overvoltage calculation based on the concept of striking distance is built. With the theory of orthogonal test, the main factors of trees' influence on lightning performance are figured out. The results indicate that the location of trees is the main factor. In practical engineer- ing, suitable management of vegetation can improve the lightning performance and reduce the lightning failure of 10 kV distribution line. Keywords 10 kV Distribution Line; Trees; Optimal Configuration ; Orthogonal Test 1. Introduction There are trees around the area of 10 kV distribution corridors and some even grow just below the distribution line. The height of trees can always reach 10 m - 20 m. Thus, trees may have influence on 10 kV distribution line lightning performance. Researchers have discussed the influence on lightning overvoltage [1] [2]. And the influence on 500 kV transmission line is studied. The results evidence that 10 m - 20 m trees can reduce 30% - 80% direct lightning strike. But the change of induced lightning overvoltage is not discussed and the results don’t apply to distribution. Researchers have performed many tests and theoretical studies on direct lightning overvoltage and induced lightning overvoltage [3]-[6]. And striking distance is an important concept in EGM which is used to find out the lightning strike location. In this paper, the model of lightning location judgment based on the concept of striking distance is built. With the model, the lightning performance of 10 kV distribu- tion line is quantitatively analyzed when trees are considered. The results can provide a reference for lightning protection and vegetation management of 10 kV distribution line. 2. Model 2.1. Judgement of Lightning Location According to [6], attracting range of line, ground and trees are combined arcs that centered on relevant object 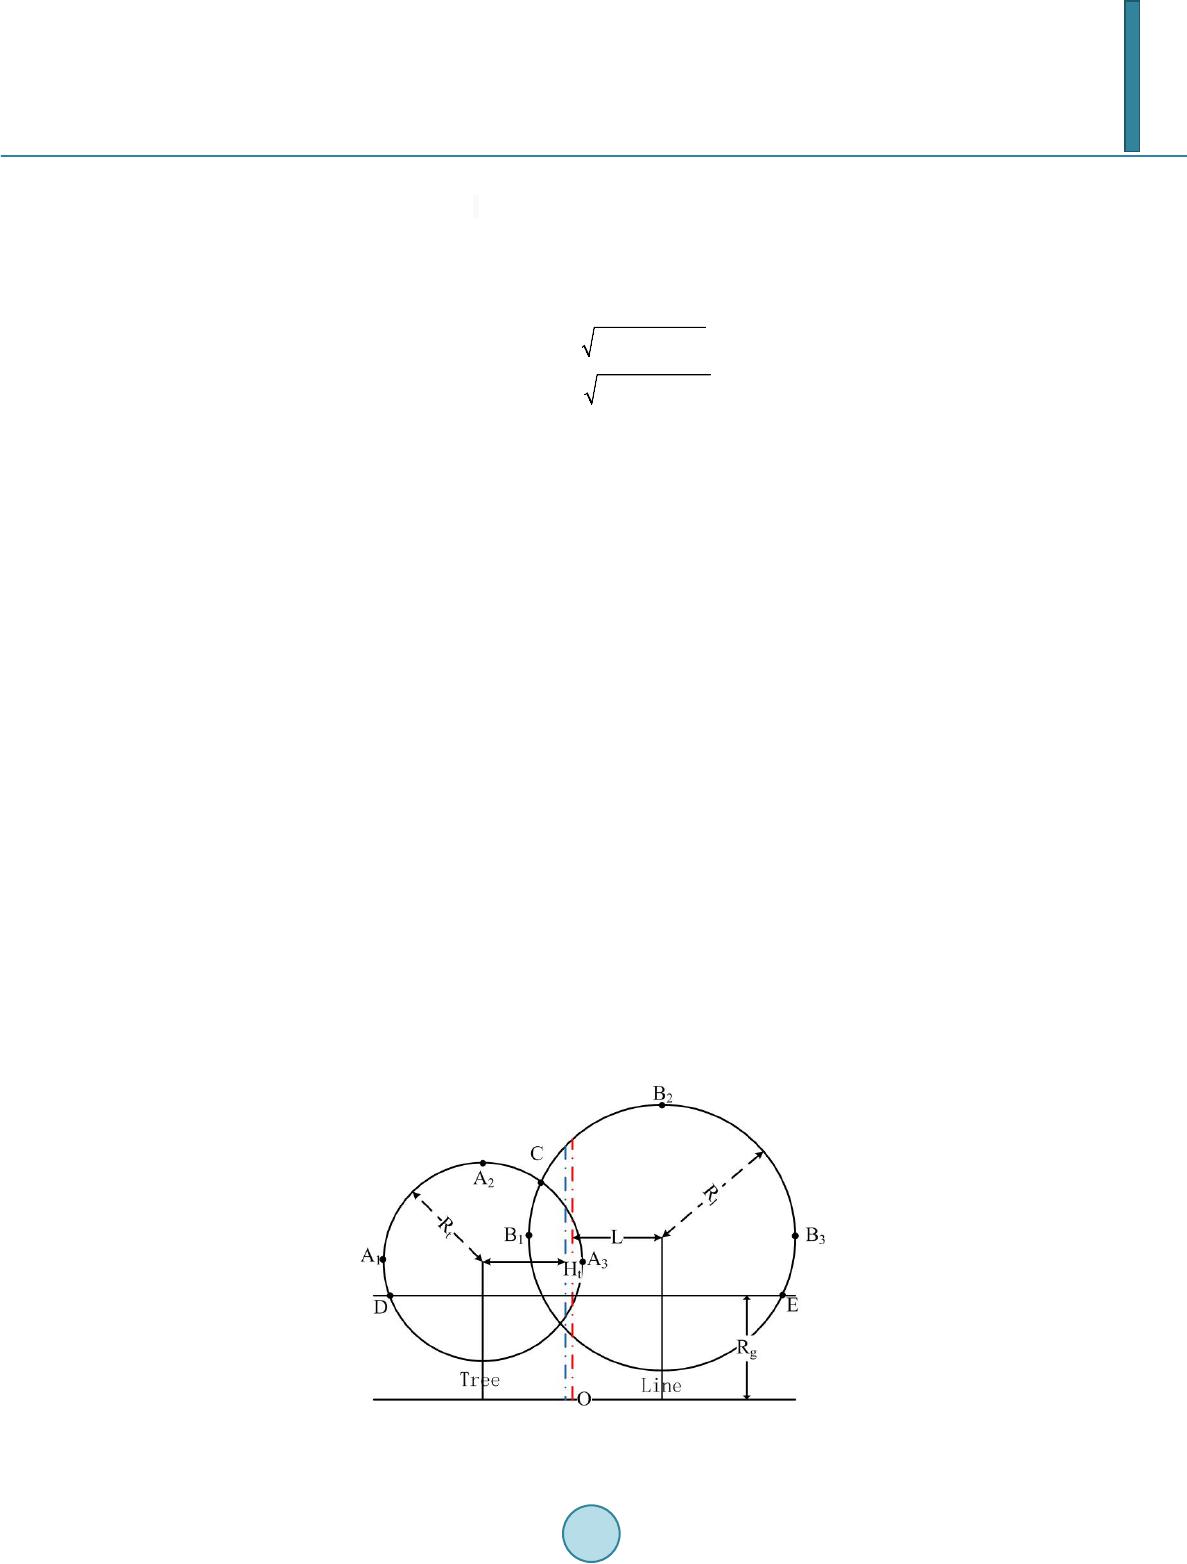 Y. C. Wu et al. and striking distance are radiuses. As it is shown in the Figure 1, B3 B2 C, A1 A2 C and DE are the correspond- ing attracting surface. The location of lightning leader is O. ht and hl are height of tree and the line. Rt, Rl, Rg are striking distance of tree, the line and the ground. L1 is the distance between the leader and the tree. And L2 is the distance between the leader and the line. When L1 < Rt, L2 < Rl the distance between the attracting surface and the ground H. The object which the max Ht belongs to is the lightning striking target. Trees: (1 ) Linw: . (2) 2.2. Lightning Performance Parameters In this paper, the number of direct lightning flashover times (DLFT), induced lightning flashover times (ILFT) and dangerous current times (DCT) serve as the characteristic parameters of the 10 kV distribution line lightning performance. Reference [7] concludes that direct lightning strike bounds to cause flashover. We define the number of direct lightning flashover times as the times that a line span suffer in a year. The number of induced lightning flashov- er times is defined as the times that insulators flashover caused by lightning induced overvoltage in a year. Ac- cording to [8], the number of dangerous current times is defined as the sums of ILFT of a tower and the DLFT on the two line span next to the tower in a year. These parameters can serve as the assessment of the lightning performance. 2.3. Induced Lightning Overvoltage When considering trees, lightning leader is not perpendicular to the ground as it is shown in Figure 2. S1 is the horizontal distance between the vertical lightning leader and the line. S is the horizontal distance between the tree and the line. ht, hl are the height of the tree and the line. The resistivity of woods can reach . Trees are regarded as dielectric with sharp tips in this paper. Calculated datas of lightning induced-overvoltage are shown in Figu re 3. And the results of regulation method is also given in Figure 3 for comparison. 2.4. Parameters According to IEEE, the striking distance is expressed as: ( 1) . ( 2) Figure 1. Judgement of lightning strike location. 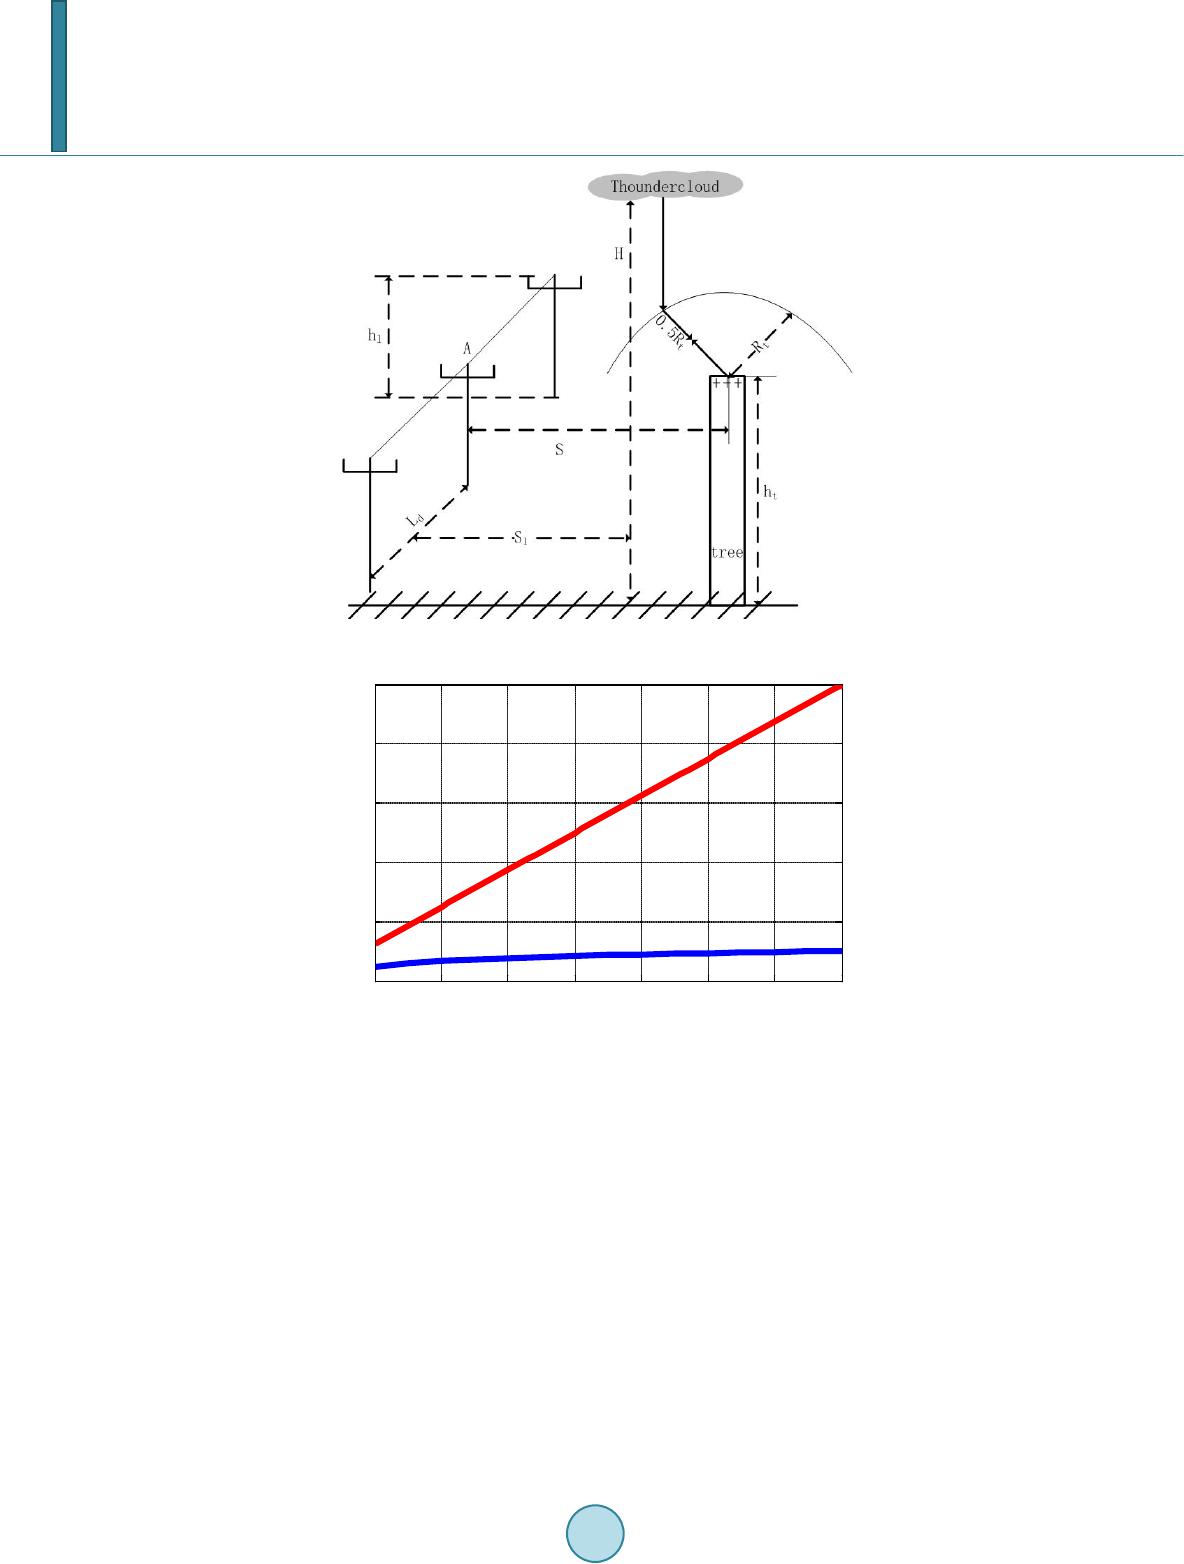 Y. C. Wu et al. Figure 2. Lightning location and strikiing distance. Figure 3. Results of induced-overvoltage (kV). 1 10.2 ,12 ,20 ,25 lt hmh mSmS m === = . I: amplitude of lightning current, Rl, Rl are the striking distance of the line and the tree. Reference [9] provides lightning current parameters: . ( 3) Thunderstorm day Td = 40. Average surface density of lightning is 0.07. Hl = 10 .2 m, impulse discharge vol- tage of insulator U50% = 230 kV, line span L0 = 100 m. 3. Influence on Lightning Performance In this section, simulations are carried out with trees that the height is between 5 m and 40 m. The Kg is set to be 0.95. we focus on the trees that located within 50 m from the line or the tower, Na, Nb, Nc are the simulation da- tas of DLFT, ILFT and DCR without trees. If N is the relevant simulation value of DLFT, ILFT and DCR, rela- tive value N/Na, N/Nb, N/Nc are used to describe the changes of lightning performance. In the diagram, the x-y coordinate plane describe the location of the trees that is relative to the line or the tower. 10 20 30 40 50 60 70 80 0 200 400 600 800 1000 I/kA 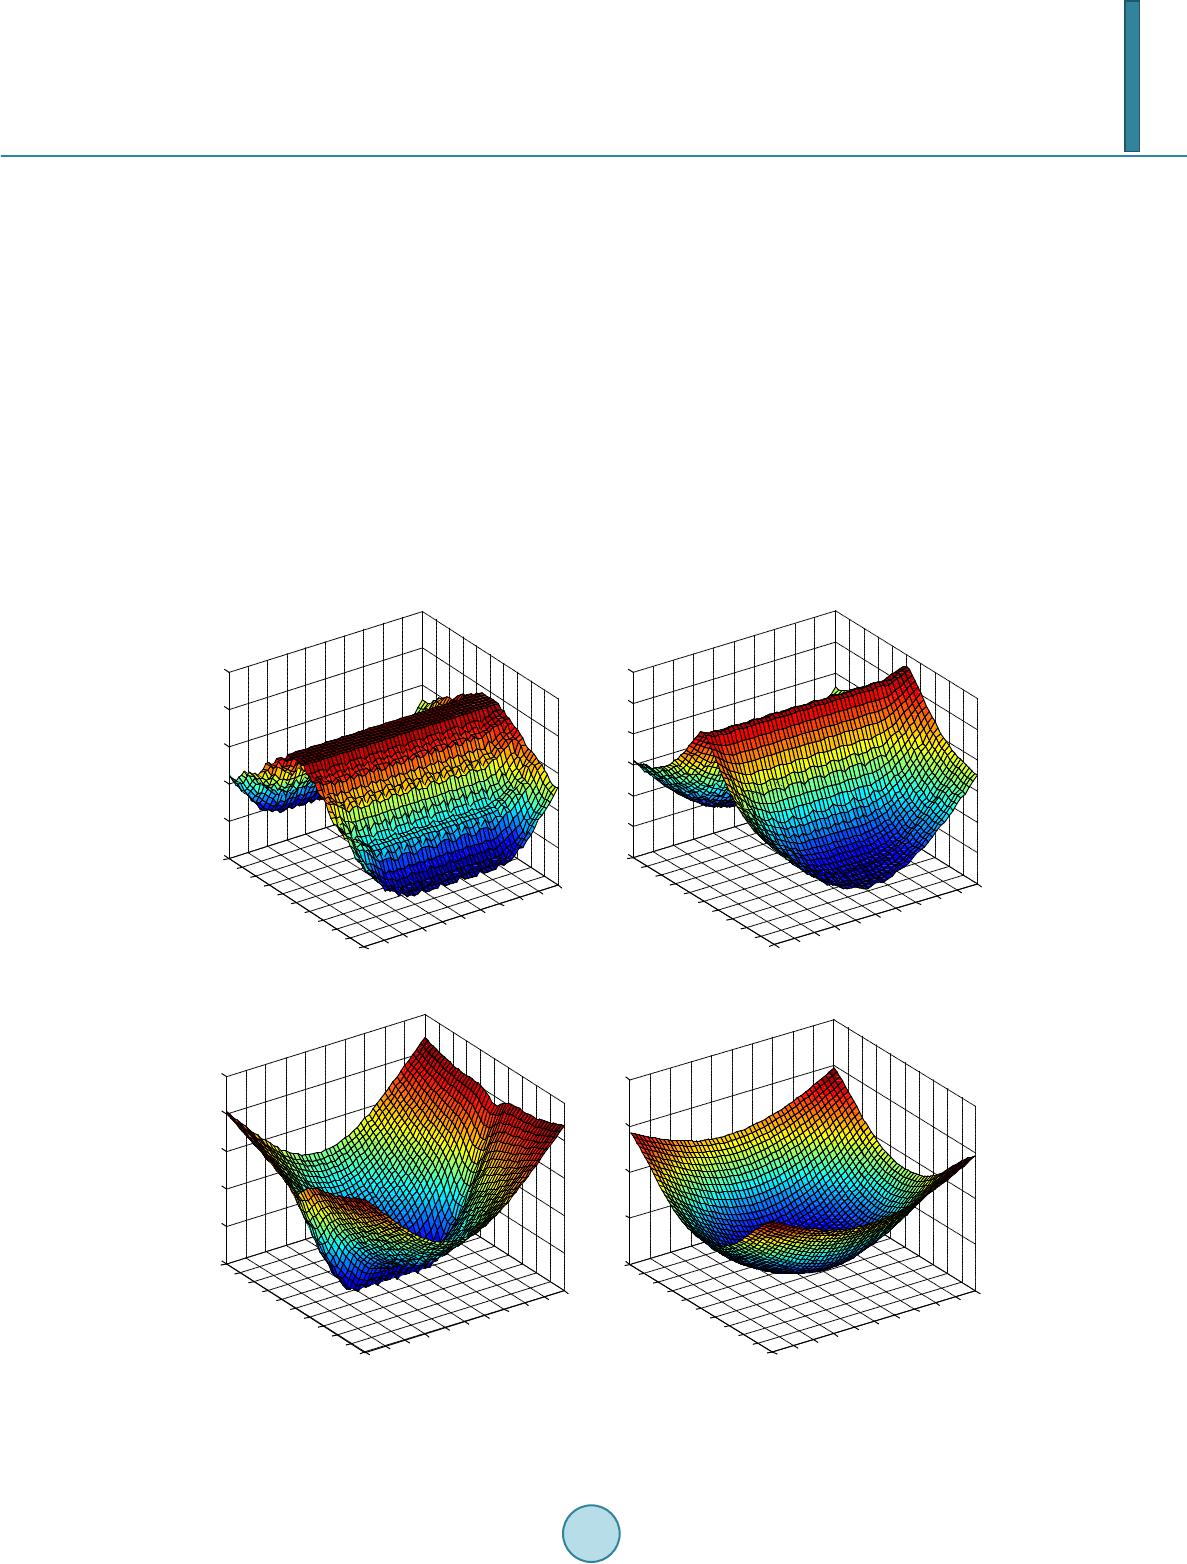 Y. C. Wu et al. 3.1. Influence on DLFT Firstly, we can get Na = 0.0314 without considering trees. It is equivalent to 31.4/(100 km∙a),which means the direct lightning flashover times of 100 km distribution line reach 31.4 times in a year. The center of the diagram is the middle of the line span. (0,0) is the location of the tower, and the y axis shows the result of N/Na. The di- rection of the line is the same as the arrwo in Figure 4(a). Simulation results ar e shown in Figure 4. When the height of trees ht > 5 m, trees can keep N/Na < 1. It indi- cates that trees can reduce the DLFT. When the height of tree between 5 m and 12 m, the shape of the simula- tion diagram is convex. It evidences that the closer to the line the poorer the protecting effect of the tree is. Tak- ing 10.2 m trees for example, trees locating 25 m from the line can reduce 5% of the direct lightning strike but only 2% when the distance is 10 m. When ht > 20 m, the results are significantly different from that of 5 m - 12 m trees. Trees can best protect the distribution line. The simulation datas show that the decrease of DLFT can reach 50% - 70% when ht = 20 m - 30 and the shielding effect is significant. 3.2. Influence on ILFT We can get Nb = 0.0012/a without considering trees. It is equivalent to 1.2/(100 km·a),which is the ILFT of (a) (b) (c) (d) Figure 4. Simulation results of N/Na. (a) ht = 5 m; (b) ht = 12 m; (c) ht = 20 m; (d) ht = 40 m. -50 -40 -30 -20 -10 0 10 20 30 40 50 0 10 20 30 40 50 60 70 80 90 100 0. 975 0. 98 0. 985 0. 99 0. 995 1 沿线路方向坐标y N/Na -50 -40 -30 -20 -10 0 10 20 30 40 50 0 10 20 30 40 50 60 70 80 90 100 0. 88 0. 9 0. 92 0. 94 0. 96 0. 98 1 沿线路方向坐标y N/Na -50 -40 -30 -20 -10 0 10 20 30 40 50 0 10 20 30 40 50 60 70 80 90 100 0. 65 0. 7 0. 75 0. 8 0. 85 0. 9 沿线路方向坐标y N/Na -50 -40 -30 -20 -10 0 10 20 30 40 50 0 10 20 30 40 50 60 70 80 90 100 0 0. 2 0. 4 0. 6 0. 8 沿线路方向坐标y N/Na 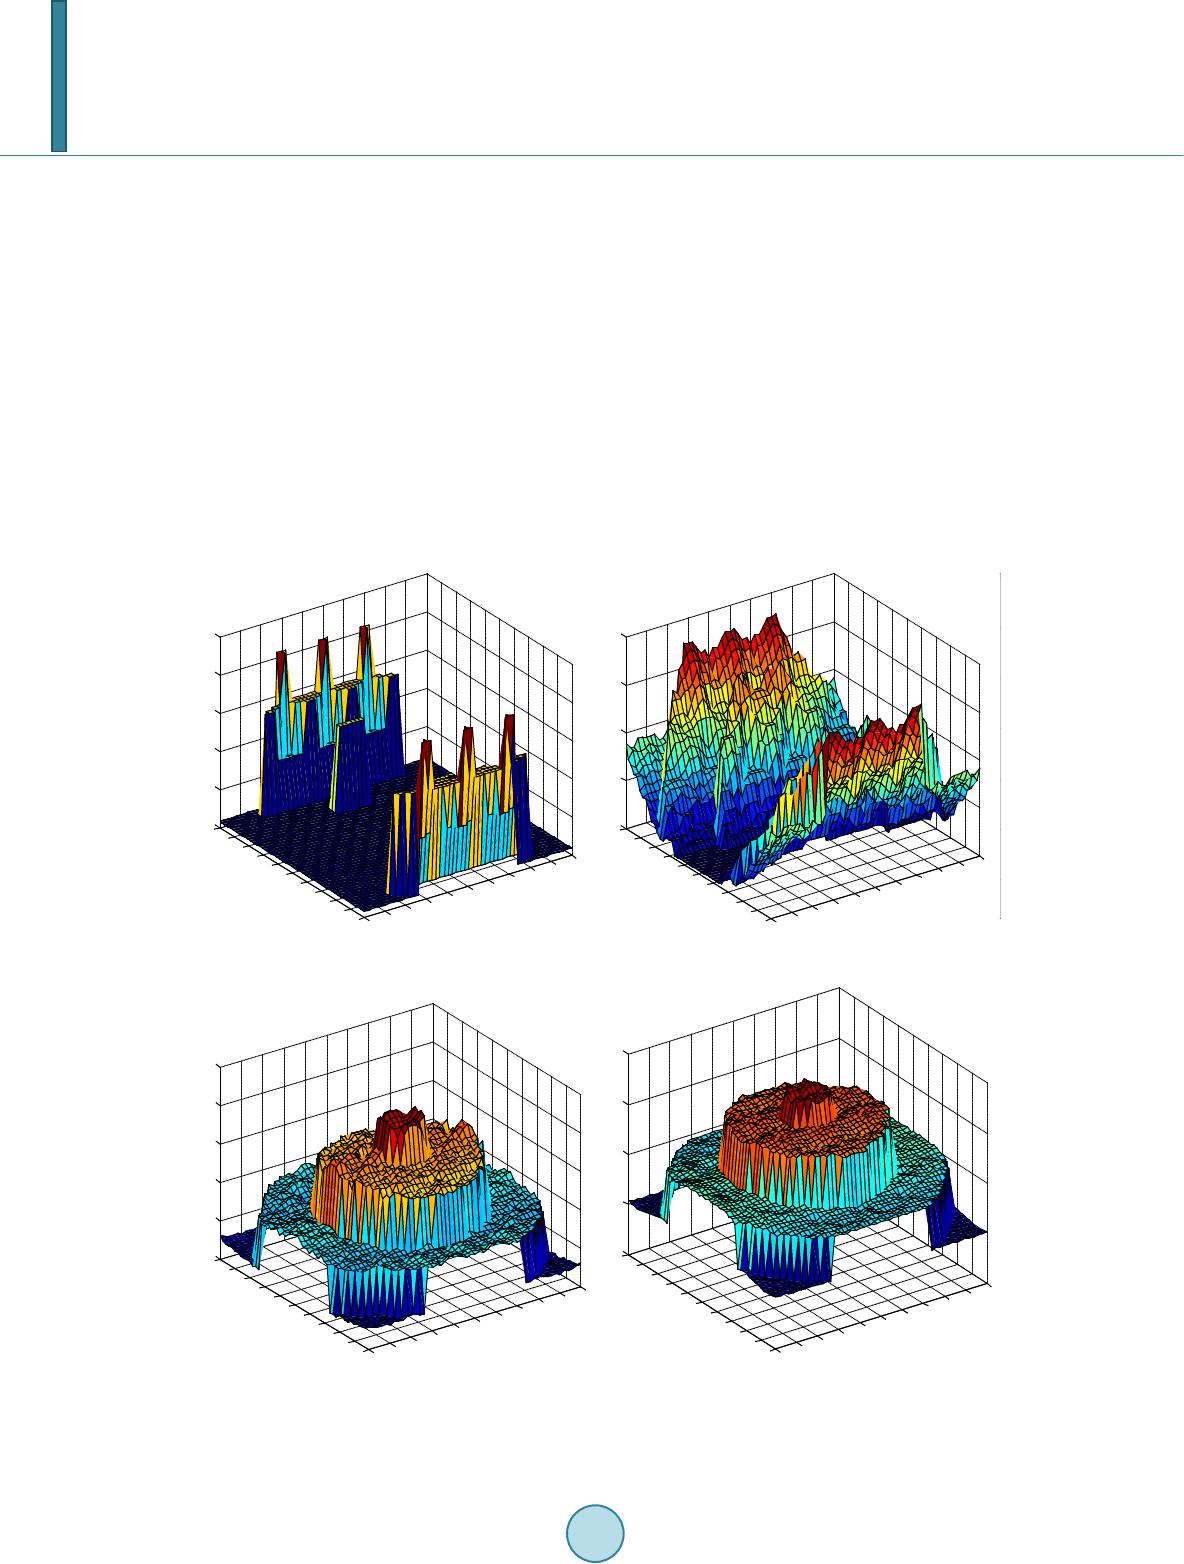 Y. C. Wu et al. 100 km distribution line. The simulation results are shown in Figure 5. The center (0,0) of the result diagram is the location of the tower and the y axis shows the simulation results of N/Nb. The direction of the line is the same as the arrow in Figure 5(a). The simulation results in Figure 5 shows that N/Nb > 1.They evidence that trees taller than 5 m can increase the ILFT. There are many maxima scattered in the diagram. Comparing with the other location, trees locating at these point may increase more threat to the insulation. When ht > 30 m N/Nb is obviously segmented. The closer to the tower, the more significantly the induced lightning flash over rate increase. Trees can increase the ILFT more than 10 times. It means that trees can in- crease the threat of lightning induced overvoltage. 4. Orthogonal Test on Optimal Configuration of Greenbelts According to the analysis above, trees have opposite influence on DLFT and ILFT. Thus different location and ht of the tree may lead to different influence on the total flashover times of distribution line. Finding out the best management of trees can protect the line from direct lightning strike and reduce the ILFT increase. In this sec- (a) (b) (c) (d) Figure 5. Simulation result of N/Nb. (a) ht = 5 m; (b) ht = 12 m; (c) ht = 30 m; (d) ht = 40 m. -50 -40 -30 -20 -10 0 10 20 30 40 50 -5 -40 -30 -20 -10 0 10 20 30 40 50 1. 1 1. 2 1. 3 1. 4 1. 5 1. 6 沿线路方向坐标 N/Nb -50 -40 -30 -20 -10 0 10 20 30 40 50 -50 -40 -30 -20 -10 0 10 20 30 40 50 1 2 3 4 5 沿线路方向坐标 N/Nb -50 -40 -30 -20 -10 0 10 20 30 40 50 - -40 -30 -20 -10 0 10 20 30 40 50 10 15 20 25 30 35 沿线路方向坐标 N/Nb -50 -40 -30 -20 -10 0 10 20 30 40 50 -5 -40 -30 -20 -10 0 10 20 30 40 50 10 20 30 40 50 沿线路方向坐标 N/Nb  Y. C. Wu et al. tion, orthogonal test is USED to study the influencing factors of the impact of trees. In the urban area, trees are always appearing in greenbelt form. Thus, greenbelt serves as a proxy in the study. Orthogonal test is a scientific method that is based on probability theory, mathematical statistics and practical experience. Orthogonal test is USED to find out the best management of trees and 10 kV distribution line. 4.1. Factor and Level According to the theory of orthogonal test, striking distance factor Kg, difference between ht and hl, location of the greenbelts S, and the length of the greenbelts are regarded as 4 factors. Each factor includes 5 levels. Factors and levels are shown in Table 1. The scheme is arranged according to . 4.2. Results The simulation and range analysis result are shown in Table 2. To DLFT, the range of Kg is the largest, which indicates that Kg is main influence factor of DLFT. Meanwhile, the range of L reach 0.44 which means L is also the factor that cannot be ignored. According to this analysis method, to ILFT, Kg is still the main factor. And distance S becomes the second most important factor. To DCT, Kg is not the main factor. And S becomes the main influence. It means that the increase of ILFT is similar to decrease of DLFT when Kg changes. And the rational location of greenbelts can improve the lightning performance of 10 kV distribution line. Striking distance factor is not steerable in engineering and the height difference is not the main factor. The optimal location of trees is figured out in different condition. The simulation data are shown in Figure 6. The simulation results of Table 2 and Figure 6 indicate that the length of greenbelts and the location is the main factors that influence the impact of trees. N/Nc should keep small enough so that the 10 kV distribution Table 1. Orthogonal factor level. Factor 1 2 3 4 5 A: Factor, Kg 0.92 0.94 0.96 0.98 1.00 B:height difference, (m) −3 −1.5 0 1.5 3 C: distance between trees and line, S (m) 5 15 25 35 45 D:Length of trees, L (m) 40 80 120 160 200 Table 2. Range analysis. Factor I II III IV V R A N/Na 4.86 4.77 4.62 4.29 3.99 0.87 N/Nb 15.83 18.11 21.49 49.95 74.63 58.79 N/Nc 5.08 5.02 4.94 5.16 5.16 0.22 B N/Na 4.62 4.53 4.56 4.30 4.52 0.31 N/Nb 31.32 28.31 30.31 48.14 41.92 19.83 N/Nc 5.13 4.99 5.05 5.14 5.24 0.24 C N/Na 4.43 4.60 4.46 4.57 4.48 0.13 N/Nb 18.19 44.14 43.59 38.87 44.06 25.94 N/Nc 4.69 5.19 5.21 5.23 5.23 0.53 D N/Na 4.73 4.52 4.58 4.42 4.29 0.44 N/Nb 38.10 42.25 38.24 27.71 33.71 14.53 N/Nc 5.37 5.24 5.23 4.86 4.85 0.52  Y. C. Wu et al. (a) (b) (c) (d) Figure 6. Simulation datas of N/Nc (DCT). (a) ; (b) ; (c) ; (d) . face fewer failures. More simulation evidences that greenbelts can reduce N/Nc up to 20% if the location is suit- able (N/N c < 0.8). To condition (a) in Figure 6, the best location distance S = 12 m - 38 m. To condition (b), the best distance S = 12 m - 18 m. To condition (c) and (d), trees closer to the line may lead to better protecting ef- fect. 5. Conclusion In this paper, a feasible scheme of quantitative analysis about trees' influence on 10 kV distribution line light- ning performance is proposed. The results can provide a reference for lightning protection and nearby vegetation management of 10 kV distribution line. References [1] Tang, J. (2012) The Assessment of Lightning Performance and Configuration of the Lightning Protection Measures of 10 kV Distribution Line in the Pearl River Delta Area. Master Thesis, South China University of Technology. [2] Mousa, A.M. and Srivastava, K.D. (2008) Effect of Shielding by Trees on the Frequency of Lightning Strokes to Pow- er Lines. IEEE Transactions on Power Delivery, 3, 724-730. http://dx.doi.org/10.1109/61.4311 [3] Wen, M.-X. (2004) Study of Lightning Induced Overvoltage on Overhead Distribution Lines. Master Thesis, Hua- zhong University of Science and Technology. [4] Omidiora, M.A. and Lehtonen, M. (2008) A Comparative Study on the Shielding Effect of Tree,Concrete Building on Direct Lightning Strokes to Medium Voltage Distribution Line. Power Symposium, North American, 28-30 September 2008, 1-7. http://dx.doi.org/10.1109/NAPS.2008.5307413 [5] Li, X.-L., Yi n, X.-G. and He, J.-J. (2008) Experimental Research and Theoretical Analysis on Striking Distance Factor. High Voltage Engineering, 34, 41-44. [6] Xu, F., Yin, L.-Q. and Wei, W. (2009) Research on Striking Distance Factor for UHV Transmission Li nes . High Vol- tage Apparatus, 45, 112-115. [7] Wang, X., Wang, S.-C., He, J.-L., et al. (2011) Characteristics of Lightning Induced Overvoltage of 10 kV Distribution Lines. High Voltage Engineering, 37, 599-605. [8] He, P., Lan, L., Wen, X.-S., et al. (1999) The Problem in the Calculation of Induced Voltages on Overhead Distribu- 0510 15 20 25 30 35 40 45 50 1 1. 05 1. 1 1. 15 1. 2 水平距离 N/ Nc 0510 15 20 25 30 35 40 4550 1.1 1.15 1.2 1.25 水平距离 N/ Nc 0510 1520 25 3035 40 4550 0.9 0.95 1 1.05 1.1 1.15 1.2 1.25 N/ Nc 0510 15 202530 35 4045 50 1 1.05 1.1 1.15 1.2 1.25 N/ Nc  Y. C. Wu et al. tion Lines. High Voltage Engineering, 25, 65-67. [9] Li, R.-H. (1999) The Definition of Equivalent Lightning Strike Width and Calculation in Lightning Performance De- sign. High Voltage Engineering, 3, 49-50.
|