 Journal of Power and Energy Engineering, 2014, 2, 573-578 Published Online April 2014 in SciRes. http://www.scirp.org/journal/jpee http://dx.doi.org/10.4236/jpee.2014.24077 How to cite this paper: Yang, X.H. Wu, J.H. Ma, Q. and Tian, Q. (2014) A Training Simulator for PD Detection Personnel. Journal of Power and Energy Engineering, 2, 573-578. http://dx.doi . o rg/10.4236/jpee.2014.24077 A Training Simulator for PD Detection Personnel Xuanhuai Yang1, Jihao Wu2, Qun Ma1, Qing Tian3 1State Grid Electric Power Research Institute, Nanjing, China 2Training Center, State Grid Shanghai Electric Power Company, Shanghai, China 3Training Center, State Grid Hebei Electric Power Company, Shijiazhuan, China Email: yangxuanhuai@sgepri.sgcc.com.cn Received September 2013 Abstract In order to mee t the training needs of Partial Disch arge (PD) detection pe rso nnel, a PD detection training simulator is developed. The composition of the system and the fu ncti ons of the modules are described, then the three-dimensional graphic engine based on Open Scene Graph (OSG) and the way of scene organization based on hierarchical tree are introduced, moreover, the methods of fault simulation and detection instrument simulation based on algorithm component library are presented. Application shows that the system can provide various detection schemes, and it is an ideal training tool for the detection person nel. Keywords PD; Simulation; Training; Virtual R e ali ty ; OSG; Su bstation 1. Introduction Substation is an important part of the power system, and it includes many types of primary equipments, these equipments with complex internal structure are running continuously in high voltage environment, the poor condition makes equipment failure be one of the main causes of power system accidents. Partial discharge de- tection is an effective means to discover equipment faults and abnormalities timely, and it has been an important daily operation and maintenance works of the power company [1]. Since partial discharge detection is done in high voltage environment with the equipments running lively, and it is very dangerous and may cause serious accidents, therefore, more training are required to improve the tester’s technical ability. As advanced training tool, Training simulation system has been widely applied in the field of electricity, transportatio n and aviation, and achieved good training effect [2-5]. Recently, with the rapid progress of virtual reality technology, it has been extensively used in simulation and training, virtual maintenance and other areas, the immersion and interactivity of these systems are improved greatly [3-6]. However, the partial discharge de- tection personnel is still lack of professional training tool, for this reason, a training simulation system based on virtual reality technology is developed, which provides a new and efficient training platform for them. In this paper, the structure of the system is described, and then the key technologies of virtual scene organiza- tion, 3D (three-dimensional) graphic engine, equipment fault simulation, detection instrument simulation are in-  X. H. Yang et al. troduced. Finally, an application presented, it shows that the system is an efficient training platform with good training effect. 2. System Architecture and Composition The training simulation system is constructed with hierarchical architecture and is divided into four layers, i.e. the database layer, the supporting layer, the application layer and the user layer. The system architecture is shown in Figure 1. The data layer manages all the data required by the system at running time, including training information, detection scheme information, simulation results and 3D graphic resources. The 3D model database contains the models of substation equipments and testing instruments as well as the relationship of 3D objects with their parts, these models are created and indexed by device type, name and manufacturer, and can be used for constructing the detection scene. The detection scheme is digitized as detection steps and saved to the detection scheme in- formation database as work sequence. The simulation result database is a real time database in shared memory, to speed up the result retrieval and display. The training information database collects the trainees’ information, including training record, operation record, testing score and so on. The supporting layer packages the 3D graphic engine, the fault simulation algorithm and the instrument si- mulation algorithm as dynamic libr aries. The 3D graphic engine is based on OSG, the underlying interfaces are modified in accordance with the characteristics of electrical equipment to provide a more rapid way for con- structing the detection scene. The other two libraries separate the simulation algorithms from specific applica- tions, and it can be easily expanded to achieve applications with different equipments and instruments. The underlying response and event handling logic fo r events from the user layer are encapsulated by the ap- plication layer. The detection scene management module loads 3D model and model information of equipments and apparatus from the specified directory, and displaying them with correct position and scale, and then re- freshing the 3D model with data from simulation result database. It also handles interactive events from user, that is, to roam the scene, to control the movement of models, to detect collision, etc. The fault simulation man- agement module manages all the faults in the system, including fault number, type, location, etc., and calling the fault simulation algorithms from the library to generate simulation data. The instrument simulation management module calls the instrument simulation algorithms in the library to process the operating events from the instru- ment model, and simulating the inner logic of the instrument, generating the display graphic. The detection scheme management module controls the process of detection experiment with the steps saved in the detection sche me information database, to identify and judge the operation events from user, and giving appropriate prompt. The user layer provides the interface of system monitoring and interactive operation, including the detection training interface and the training management interface. The detection training interface is a highly realistic Detection training interface User layerTraining management interface Application layer Detection scene management Fault simulation management Instrument simulation management Detection scheme management Supporting layer 3D graphic engine Fault simulation algorithm libraryInstrument simulation algorithm library 3D model database Simulation result database Detection scheme information database Training information management database Data layer Figure 1. Architectu re of the training simulation system.  X. H. Yang et al. virtual testing environment with intuitive human-computer interaction tools and smooth 3D graphic scene. The training management interface is the tool for instructor to monitor and control the training system, including trai ni ng control, faults setting, student information inquiry and training evaluation. 3. Key Technologies and Implementation 3.1. OSG Based 3D Graphic Engine OSG is an open source, cross-platform, highly efficient 3D graphic library based entirely on standard C++ and OpenGL, offering ob ject-oriented framework that provides a lot of additional modules and expansion interfaces, supporting the rapid development of 3D graphic engine with industry features. In order to improve the develop- ment efficiency, the OSG library is adopted as underlying supporting interfaces of the 3D graphic engine, and the data organization and key rendering algorithms are modified in accordance with the characteristics of elec- trical equipments, it is very suitable for constructing power system virtual scene. The structure of the 3D graphic engine is shown in Figure 2. The underlying runtime library, object status maintenance, memory management, data representation, 3D graphic rendering, data loading and other specific details are shielded by the user interface component, so that an efficient interface set is provided to speed up the development of 3D application, such as the PD detection training simulator. The engine fully consider the cha- racteristics of the power system, and organizing the scene by special hierarchical tree based on the electrical connection characteristics of the equipments, the model can be easily managed and retrieved to increase render- ing efficient. 3.2. Scene Organization The binary space partition (BSP) is an effective data structure to manage three-dimensional scene data because of the convenience and the nearly linear complexity. But BSP is a common way for data management, and the spatial layout features of detection scene and connectivity features of electrical equipments are not taken into account, so that an improved N-tree structure is designed to the detection scene management. The hierarchical tree of detection scene is shown in Figure 3. The detect scene is represented as a hierarchical tree, the root of the tree is the hole virtual scene, each node in the tree is a device object, which contains the 3D graphic data, spatial properties (position, attitude, etc.), motion characteristics (degree, speed, direction, etc.), electrical characteristics (meter reading, wiring, division and state). Node in the tree is packaged as object by object-oriented technology, and the child node inherits attributes from parent to avoid redundancy. The hierarchy of nodes reflects the containment relationship between devices. An electrical device may con- sist of a body and a number of parts. For detection instrument, instrument body, parts, auxiliary components are Figure 2. Structure of the 3D graphic engine. Application interface User layer 3D graphic engine User interface component Runtime library Memory management component Data representation component Drawing interface component Operating system OpenGL library3D model file Audio file Image file Text file File I/O component  X. H. Yang et al. Detection scene Equipments Instruments Equipment 1Equipment n Part 1Part n Instrument 1Instrument n Part 1 Part n Auxiliary part 1Auxiliary part n Figure 3. The hierarchical tree of detection scene. included. Moreover, the connection information of auxiliary component is contained in the instrument node to describe the connection status in detection process. The hierarchical tree structure can improve the scene rendering efficiency. That is, starting from the root, tra- versing the hierarchical tree from left to right with depth-first search algorithm, converting the local coordinates to the global coordinates according to the spatial properties of the node, displaying the scene. In this process, extra work of graphic rendering is reduced and the speed is greatly promoted. 3.3. Fault Simulation The fault simulation is realized by the fault simulation management module with the fault simulation algorithm library. First, this module gets the equipment type, number and their spatial coordinates through detection scene management module, and creating fault points inside the equipment and recording them in memory. In the de- tection process, this module interacts with the instrument simulation management module, and getting the name of the instrument, measuring point, testing methods and other information, then generate fault data by calling algorithm in the fault simulation algorithm library. As partial discharge detection is actually to measure the physical quantities caused by partial discharge, such as sound, light, electromagnetic radiation and chemical. These quantities are decaying in the dissemination, so that the fault simulation must calculate the physical quan- tities around the measuring point. In general, each detection always test only one of the quantities, so that a pol- icy to simulate only one physical factors specified by “detection mode” is designed to reduce the workload of the system. In order to increase the flexibility of fault simulation and the reusability of simulation algorithm, the fault si- mulation algorithm library is developed, and the fault simulation management module calls the algorithm through a unified interface. The interface is defined as follows. public int Fault_Compute (CEquip Fault in Equip Fault [7], CInstru Style in Instru, float in Time, CArray & out Data); class CEquip Fault { …… int m_n Equipment Type; // equipment type CSting cs E q uip Name; // equipment name C3DPoint m_clsEquipPos; // equipment position int m_nFaultType; // fault type C3DPoint m_clsFaultPos; // fault position …… } The in Equip Fa ult is fault parameter, including all the equipments in the scene, the mainly attributes are the name, type, position of the equipment and the fault. The in I nst r u is instrument parameter, currently only one in- strument can input to the interface, the Information includes the instrument name, detection mode (such as: ul- trasonic testing, UHF detection), measuring point number, measuring point position, etc. The in Time is simula- tion time and the out Data is class for returning simulation result. It should be noted that the results returned  X. H. Yang et al. from fault simulation algorithm will be processed by instrument simulation algorithm, and both of them should determine the format of returned result. 3.4. Detection Instrument Simulation The detection instrument simulation includes physical characteristic simulation and functional simulation. The detection scene management module simulates the physical characteristic of instrument. That is, generating the virtual parts of instrument with the physical characteristics, assembling the parts into instrument models, and reading the models into memory by the detection scene management module, then displaying the model as three -dimensional graphic. For functional simulation, the mathematical models of instrument must be estab- lished, and the simulation algorithms to simulate instrument internal logic should be base on these models. The functions of instrument operation, state transition and display data drawing are done in the algorithm. The in- strument simulation management module calls these algorithms to achieve instrument simulation by cooperating with the other modules in the application layer. In the power company, there are many kinds of PD detection instruments, their functions, operation method, display mode are different widely, if simply bounding the instrument with the system, only a limited number of instrument can be achieved, and the poor flexibility and scalability makes the system difficult meet the training needs of inspectors. For this reason, the object-oriented technology is adopted to design the algorithm, and all the algorithms are packaged as separate components and saved into the algorithm library, applications realize the instrument by calling the algorithms through the interface. In this way, the application is separated from in- strument, and the detection scheme flexibility is improved. The instrument simulation algorithm can handle the operation events from instrument and process the simula- tion results according the display mode. The operation events are handled to realize the internal logic, for exam- ple, to change instrument state. The fault data is transited to display format and drawn on the drawing object, the drawing object will be returned to the caller and displayed on instrument panel. The instrument simulation algorithm interface is defined as follows. public int Instrument_Event Handle (CInstru Event in Eve nt, CArray in Faul t Da ta, CInstr u Style & o ut Instru, CDra w Panel & out P anel); The in Event is instrument operation event parameter, the called algorithm is decided by this parameter. The in Fault Data is fault data which produced by the fault simulation algorithm. The out Instru is an output parame- ter, and it returns the instrument state to the instrument simulation management module, and the module trans- fers it to the fault simulation management module to create fault data. The out Panel is the handler of drawing object, the graphic is drawn on it and can be displayed on instrument panel. Based on this mode, the virtual instrument does not rely on any specific equipments and detection schemes. The instrument can be used in different experiments, and the same device can also be detected with different in- struments, so that new detection schemes can be designed, and the system’s flexibility is greatly enhanced. 4. Real Projects The system described in this paper has been successfully put into use in Training Center of Guangzhou Power Supply Bureau. The trainee logins into the system through the detection training interface, then to select instru- ment and equipment, and starting the experiment. In the system, a group of partial discharge detection scenes are established for switchgear, transformer, GIS, high-voltage cable, arrester and other equipments. A series of vir- tual instruments are constructed, including Ultra TEV, Mi ni TEV, PDM03, DISP-24, Portable UHF Monitor, OWTS M28-S-Lan, Precise PD, RCD-1B, AI-6103. Meanwhile, a dozen testing schemes are designed, and it can fully meet the training requirements. Figure 4 shows the scene of a detection scheme for arrester PD detection, and in this scheme, the virtual AI -6103 is used as the testing instrument. Figure 5 shows the virtual AI-6103 PD detection instrument, and the results displayed on the screen shows that no partial discharge fault exist. 5. Conclusion A PD detection training simulation system is introduced in this paper, with the 3D graphic engine and the scenes organizational methods which are suitable for electrical equipment simulation, the system obtains faster render- 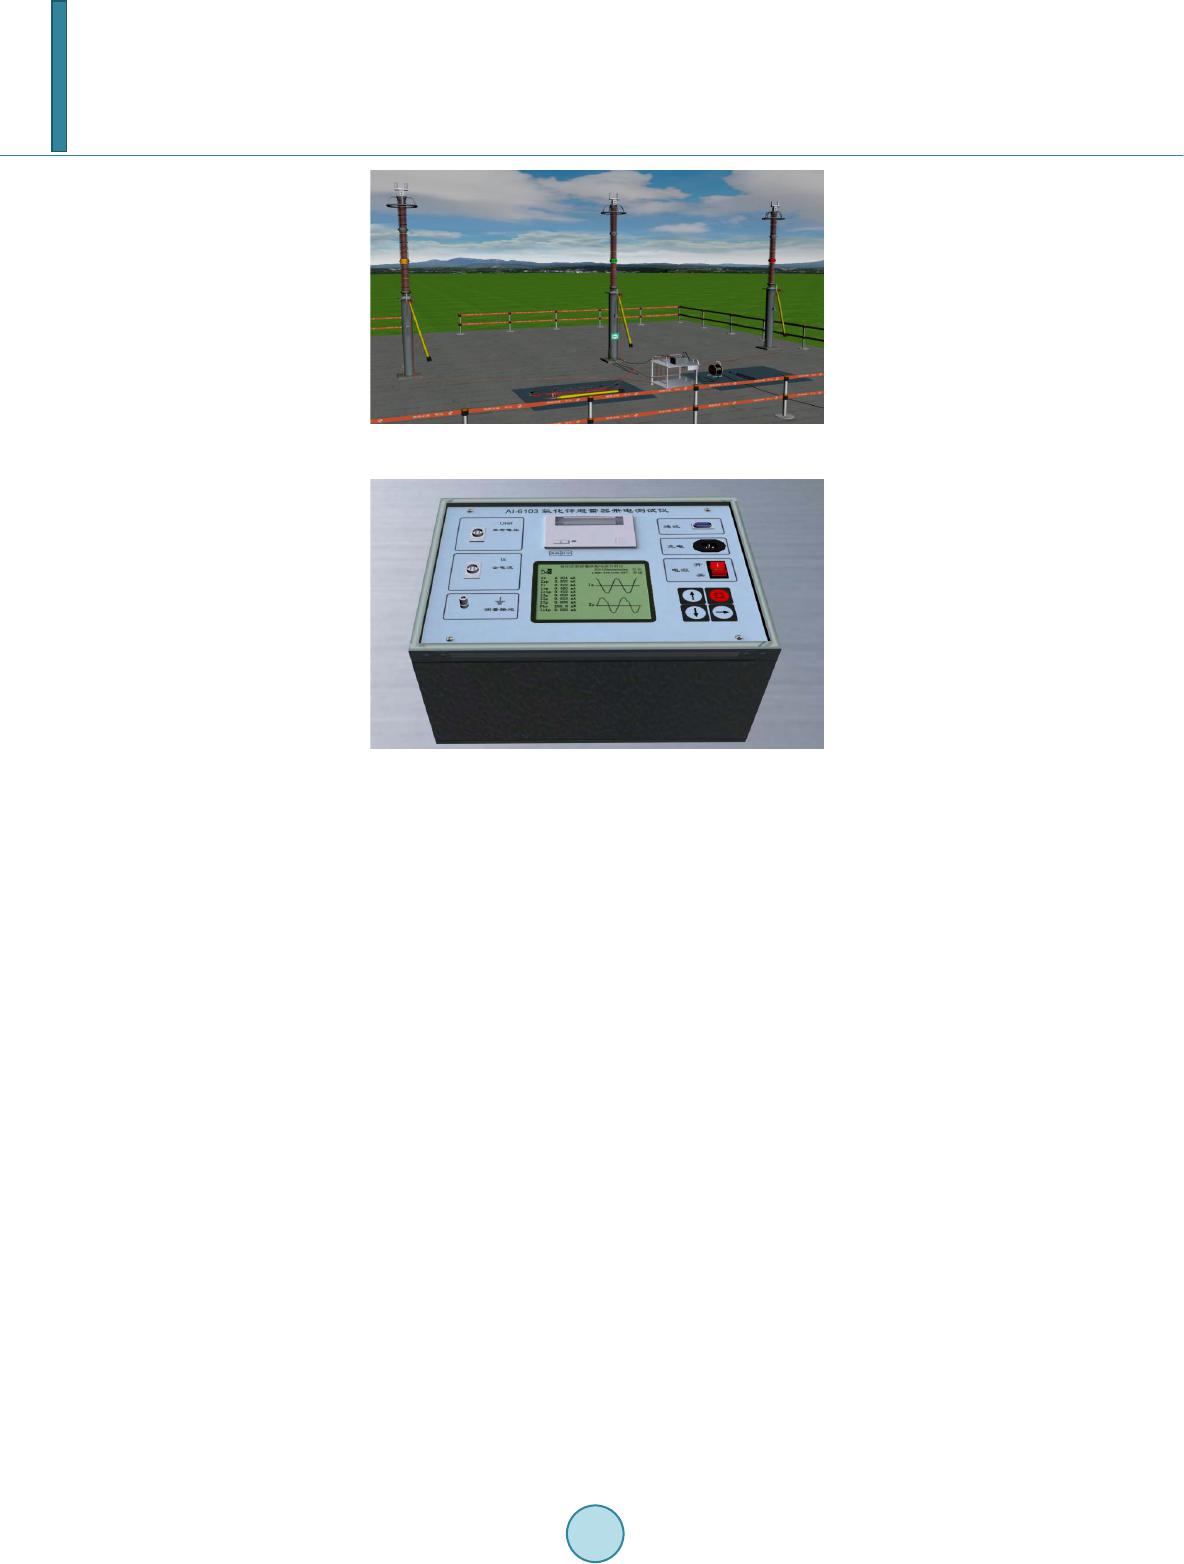 X. H. Yang et al. Figure 4. The detection scene of zinc oxide arrester. Figure 5. The virtual AI-6103 zinc oxide arrester tester. ing speed and better rendering efficiency. Meanwhile, with the component-based development technology, the fault simulation algorithm and the instrument simulation algorithm are packa ged into separate components, so that the simulation algorithms are separated from the detection scheme and simulation application, and it is easy to add new detection schemes and to extend the system’s functions, the flexibility of the system is improved greatly, and it has a higher practical value and better training effect. References [1] Zhang, H.Y., Zhu, S.L., Zhang, Y., et al. (2009) Research and Implementation of Condition-Based Maintenance Technology System for Power Transmission and Distribution Equipments. Power System Technology, 33, 70 -73. [2] Yang, X.H., Lin, C.N., Wang, G.P., et al. (20 09) High Level Architecture-Based Power Grid Comprehensive Simula- tion Platform. Power System Technology, 33, 98-10 3. [3] Hou , J., Li, W.Q. and Lin N C.N. (2 00 5) Research on Key Technologies of Three Dimension Interactive Scene S i mula- tion for Substation. Power System Technology, 29, 70-75. [4] Zhou , S.Z., Zhao, W.Z., Zhang, J., et al. (2011) Research and Accomplishment on System of EMU Virtual Mainten- ance and Training Based on OSG. Computer Simulation, 28, 332 -336. [5] Chen , N., Lv, Q.L. and Sun, Y.K. (2011) The Application of Viewpoint Follow Technology in Ship Driving Simula- tion System Base on OSG. SHIP Engineering, 33, 53-57. [6] Yang, Q. and Huag, J. (2009) Research into High-voltage Electrical Test System Architecture and Key Technology Based on Virtual Reality. Journal of Nanjing Institute of Technology, 7, 14-18. [7] Wang, G.H., Meng, X.F. and Wang, L. (2008) Study of Distributed Virtual Test System Based on HLA. Journal of System Simulation, 20, 600-603.
|