Journal of Power and Energy Engineering, 2014, 2, 532-540
Published Online April 2014 in SciRes. http://www.scirp.org/journal/jpee
http://dx.doi.org/10.4236/jpee.2014.24072
How to cite this paper: Huang, J., Shen, B. and Yang, F. (2014) Simulation Model of Shipboard Low Voltage Molded Case
Circuit Breaker Based on PSCAD/EMTDC. Journal of Power and Energy Engineering, 2, 532-540.
http://dx.doi.org/10.4236/jpee.2014.24072
Simulation Model of Shipboard Low Voltage
Molded Case Circuit Breaker Based on
PSCAD/EMTDC
Jing Huang, Bing Shen, Feng Yang
College of Electrical Engineering, Naval University of Engineering, Wuhan, China
Email: hjing99421@126.com
Received December 2013
Abstract
A simulation model of shipboard low voltage molded case circuit breaker (MCCB) is developed
based on power system simulation software PSCAD/EMTDC. The motion characteristic of the
magnetic instantaneous acting trip based on electromagnetic characteristic analysis and Cassie
arc model are applied into the simulation model to describe the dynamic behavior of the MCCB
during short-circuit protection. The results of short-circuit interruption experiments verify the
simulation model. It demonstrates that the simulation model has good prospect in optimizing the
design and protection performance of MCCB.
Keywords
Shipboard Power System; MCCB; Dynamic Behavior; Arc Model; PSCAD/EMTDC
1. Introduction
Low voltage molded case circuit breakers (MCCB) are widely applied in shipboard power system. The protec-
tion characteristics of MCCB are in close relation to power supply reliability of important shipboard loads which
have great effect on the safety of navigation. It is necessary to analyze the dynamic characteristic of MCCB
during short circuit protection, and build corresponding simulation model, so that the design and protection pa-
rameters setting of MCCB can be optimized.
The process of breaking short circuit current is a complex physical process which coupled with mechanical
movement, electric circuit, magnetic field and electric arc. And the protection characteristics of MCCB are
mainly depending on the mechanical movement characteristic of magnetic trip and dynamic characteristic of arc.
So there are many papers which discuss the mathematic model of magnetic trip [1]-[4] and arc [5]-[8].
In this paper, the mathematical models of instantaneous acting trip and switching arc are firstly studied. The
characteristic of electromagnetic torque on armature in the trip which varied with the current and air gap is ana-
lyzed using ANSOFT. The analysis results are integrated with mechanical motion equations and arc model to
build a simulation model of MCCB based on PSCAD/EMTDC. Short-circuit interruption experiments are car-
ried out to verify the simulation model.
J. Huang et al.
533
2. Mathematical Models of MCCB
2.1. 3-D Model of Instantaneous Acting Trip in MCCB
Take a typical shipboard low voltage molded case circuit breaker whose rated current is 400A for example, the
3-D model of its instantaneous acting magnetic trip is shown in Figure 1. This is typical clapper trip without
iron core. The main magnetic path is comprised by yoke and armature. An irregular shaped conductor pass
through the yoke and armature.
2.2. Motion Equation of the Instantaneous Acting Trip
It can be seen from Figure 1 that when current flow through the conductor, an electromagnetic torque on arma-
ture will be generated. The effect of the electromagnetic torque is to spin the armature in the decrease direction
of air gap. Meanwhile, counter torque on the armature will prevent rotation of armature. So the motion equation
of the armature can be written as
d1
dd
dt
ef
TT
tJ
ω
θω

= −
 
−=
(1)
where θ is the angle between the yoke and armature shown in Figure 2, ω is angular velocity of armature, Te is
the electromagnetic torque, Tf is the counter torque, and J is rotation inertia of armature.
Figure 1. 3-D model of instantaneous acting trip in 400A molded case circuit
breaker.
Figure 2. The angle θ between armature and yoke.
J. Huang et al.
534
The counter torque is made up of three parts which are torque of reaction spring, frictional resistance moment,
and trip torque. The trip torque is the reaction torque when armature knocks the tripping shaft which will then
trigger the actuating mechanism to pull apart main contact of circuit breaker. So the trip torque works when the
armature rotates at a certain angle range in which the armature has contact with tripping shaft. The counter tor-
que can be written as
max 0min1
max 012
max 02max
( )()
()( )
( )()
m
fr m
m
MT
T TMT
MT
θ θθθθθ
θθθθ θθ
θθθθ θθ
−+ +≤<
=+−+ +≤≤
−+ +≤≤
(2)
where M is rigidity of torsion spring, Tm is the frictional resistance moment, Tr is the average trip torque which
can be obtained by experiment, θmax is the maximum value or initial value of θ, θmin is the minimum value of θ,
[θ1, θ2] is the angle range of armature in which the trip torque works.
2.3. Mathematical Model of Arc
For the area of arc model, there are two classical black-box mathematical models: Mayr model defined by Equa-
tion (3) and Cassie model defined by Equation (4).
11
( 1)
m
dgu i
g dtP
τ
= −
(3)
2
2
11
( 1)
cc
dg u
g dtU
τ
= −
(4)
where g is the conductance of arc, u is the arc voltage, i is the arc current, τm and τc are the time constant defined
by Mayr model and Cassie model respectively, P is the radiating power of arc, Uc is the arc voltage gradient.
Previous study shows that Cassie’s equation describes an arc more clearly for the high currents and Mayr’s
equation when close to current zero [5]. The short circuit currents are much high in shipboard power system due
to low voltage and short cables. Meanwhile, we pay more attention to the movement process of armature before
knocking the tripping shaft, and the short circuit currents are still high during the process. So we decided to use
the Cassie model to describe the arc characteristic.
3. Analysis on Electromagnetic Character-Istic of Instantaneous Acting Trip
To simulate the dynamic behavior of the instantaneous acting trip based on the motion equation mentioned
above, the variable Te needs to be accurately calculated. So the 3-D model of trip shown in Figure 1 is imported
into the finite element calculation software ANSOFT, and the electromagnetic characteristics of the instantane-
ous acting trip are analyzed using transient response solver of ANSOFT. Figure 3 shows the distribution of
magnetic induction density vector in armature and yoke of trip calculated by ANSOFT when the excitation cur-
rent through the conductor is up to 55.2 kA.
As we know, the induction density and the electromagnetic torque of the armature are mainly depend on the
excitation current and air gap between the yoke and armature. And the air gap can be measured by the angle θ.
So the electromagnetic torques Te under different current of conductor i and angle θ are calculated using
ANSOFT. The calculation results are shown in Figure 4. The angles shown in Figure 4 are rotation angles in
the increase direction of θ, and negative angles means the decrease of θ and air gap.
It can be seen from Figure 4 that Te increases with the increase of i and the decrease of θ. The sample points
of Te will provide interpolation data for simulation model of circuit breaker.
4. Simulation Model for MCCB
4.1. Simulation Model for Instantaneous Acting Trip
Based on the motion equation of armature def ined by Equation (1) and the characteristic of electromagnetic tor-
que on the armature, a simulation model for the instantaneous acting trip is built by using PSCAD/EMTDC si-
mulation software which is shown in Figure 5.
J. Huang et al.
535
Figure 3. Distribution of magnetic induction density of armature and yoke (i = 55.2 kA).
-3˚
-2˚
-1˚
0˚
1˚
-4˚
-5˚
TmNm
iA
Figure 4. Electromagnetic torque on armature varied with current and air gap.
It can be seen from Figure 5 that the differential operators in the Equation (1) are transformed into two inte-
grating elements in the simulation model. The user defined module “Te_400A” is used to calculate the electro-
magnetic torque on the armature during simulation processes which store the data of electromagnetic torque
shown in Figure 4 in the form of a two-dimensional array. The current i and the air gap angle θ are taken as in-
J. Huang et al.
536
Figure 5. Simulation model for instantaneous acting trip.
put of the module, and the electromagnetic torque can be obtained by interpolation calculation for the two-di-
mensional array based on the dual three-opint interpolation formula which can be written as
(5)
where θ is the one-dimensional array of air gap angle θ, I is the one-dimensional array of current i, and Te is the
two-dimensional array of the electromagnetic torque.
When the current i is high enough so that the electromagnetic torque is greater than initial reaction torque, the
armature begins to rotate and the air gap angle θ decrease. When θ is lesser than θ2, the trip torque Tr starts to
take effect to the armature. When θ is lesser than θmin, the trigger signal will be send out, the circuit breaker will
be tripped and switching off. The process that actuating mechanism pulls apart main contact of circuit breaker is
relative shorter than tripping action, and can be simulation using delay module. The trip simulation models for
each phase simulate the dynamic behavior of trips in corresponding phase, and any trip reach the tripping condi-
tion, the trigger signal will be send out.
J. Huang et al.
537
4.2. Simulation Model for Switching Arc
Based on the Cassie arc model, a simulation model for switching arc is built by using PSCAD/EMTDC which is
shown in Figure 6.
The simulation model for arc contains three user defined module “Cassie_Arc_Model” which are used to si-
mulate the equivalent impedance of arc for each phase. The three modules are actually controllable impedance
models whose impedance are controlled by solving the Cassie arc model defined by Equation (4) at each time
step after receives the trip signal. The implicit trapezoidal method [9] is applied to transform the Equation (4)
into differential equation which can be written as
22
2
( )()1( )()()()
12
2
cc
gttgtuttutgttgt
tU
τ

+∆ −+∆ ++∆ +
= −⋅


(6)
So the conductance of arc at next simulation step can be obtained as
2 222
2 222
42() ()
( )()
42() ()
cc c
cc c
UtUtutt ut
gt tgt
UtUtutt ut
τ
τ

− ∆+∆+∆+

+∆ =
+ ∆−∆+∆+

(7)
where
()
ut t+∆
is voltage of arc at next time step which can be obtained by the predictor formula shown as
following
()1.33()0.66()0.33 (2)ut tututtutt+∆=−−∆+− ∆
(8)
The conductance is calculated according to the differential equations until the arc extinguishes. In this case,
the peak value of the arc resistance for the model is set to a very high value (in our model, 106 Ω) to representing
the open circuit breaker.
5. Verification of the Simulation Model
To verify the simulation model, an experimental system for short circuit breaking test was built. The schematic
diagram of the experimental system is shown in Figure 7.
The short circuit current peak value in the short circuit test without the test MCCB was set to 199 kA by ad-
justing controlled reactors. The instantaneous action current of the test MCCB was set to 10 times of rated cur-
rent. Figure 8 shows the three phase current waveforms of the short circuit current breaking experiment for the
MCCB.
A simulation system was built exactly according to the experimental system. The expected short circuit cur-
rent peak value in the simulation system was also set to 199 kA. The motion parameters of the simulation model
for the test MCCB are shown in Table 1.
Figure 6. Simulation model for Switching Arc.
J. Huang et al.
538
MCCB
150MVA
Main transformer
220kV
110kV
10kV 400V
Experimental
transformer
Measuring
instrument
Controlled
reactor
Controlled
reactor
Figure 7. Schematic diagram of experimental system.
Figure 8. Three phase current waveforms of the short circuit current breaking
experiment for the MCCB.
Table 1. Parameters of the motion equation of armature.
Parameters Value Parameters Value
M (
N mm/degree
) 9.33 θ0 (degree) 20.0
J (
2
kg m
) 5.289×10⁻⁶ θ1 (degree) 24.3
θmax (degree) 29.0 θ2 (degree) 26.3
θmin (de gree) 23.9 Tr (
Nm
) 0.089
The used parameters of the arc model were adjusted several times to match the test MCCB which were: τm =
1.5 × 10⁻⁴ s and Uc = 350 V.
Figure 9 shows the three phase current waveforms of the short circuit current breaking simulation for the
MCCB.
It can be seen form Figures 8 and 9 that there is a good correlation between simulation and experiment mea-
surement. Table 2 shows the comparison of simulation results with experiment.
It can be seen form Table 2 that the relative errors between simulation and experiment measurement are all
less than 9% which demonstrates that the proposed simulation model has good veracity in simulating the dy-
namic behavior of MCCB during short-circuit protection.
6. Conclusion
A simulation model for MCCB which couples dynamic processes of mechanics, electromagnetic and switching
arc has been developed by embedding some self-programmed simulation modules into the simulation software
J. Huang et al.
539
i
b
i
c
i
a
50.0k
40.0k
i
a
i
b
i
c
(A)
30.0k
20.0k
10.0k
0.0
-10.0k
-20.0k
-30.0k
t(s) 0.958 0.960 0.962 0.964 0.9660.968 0.970 0.972
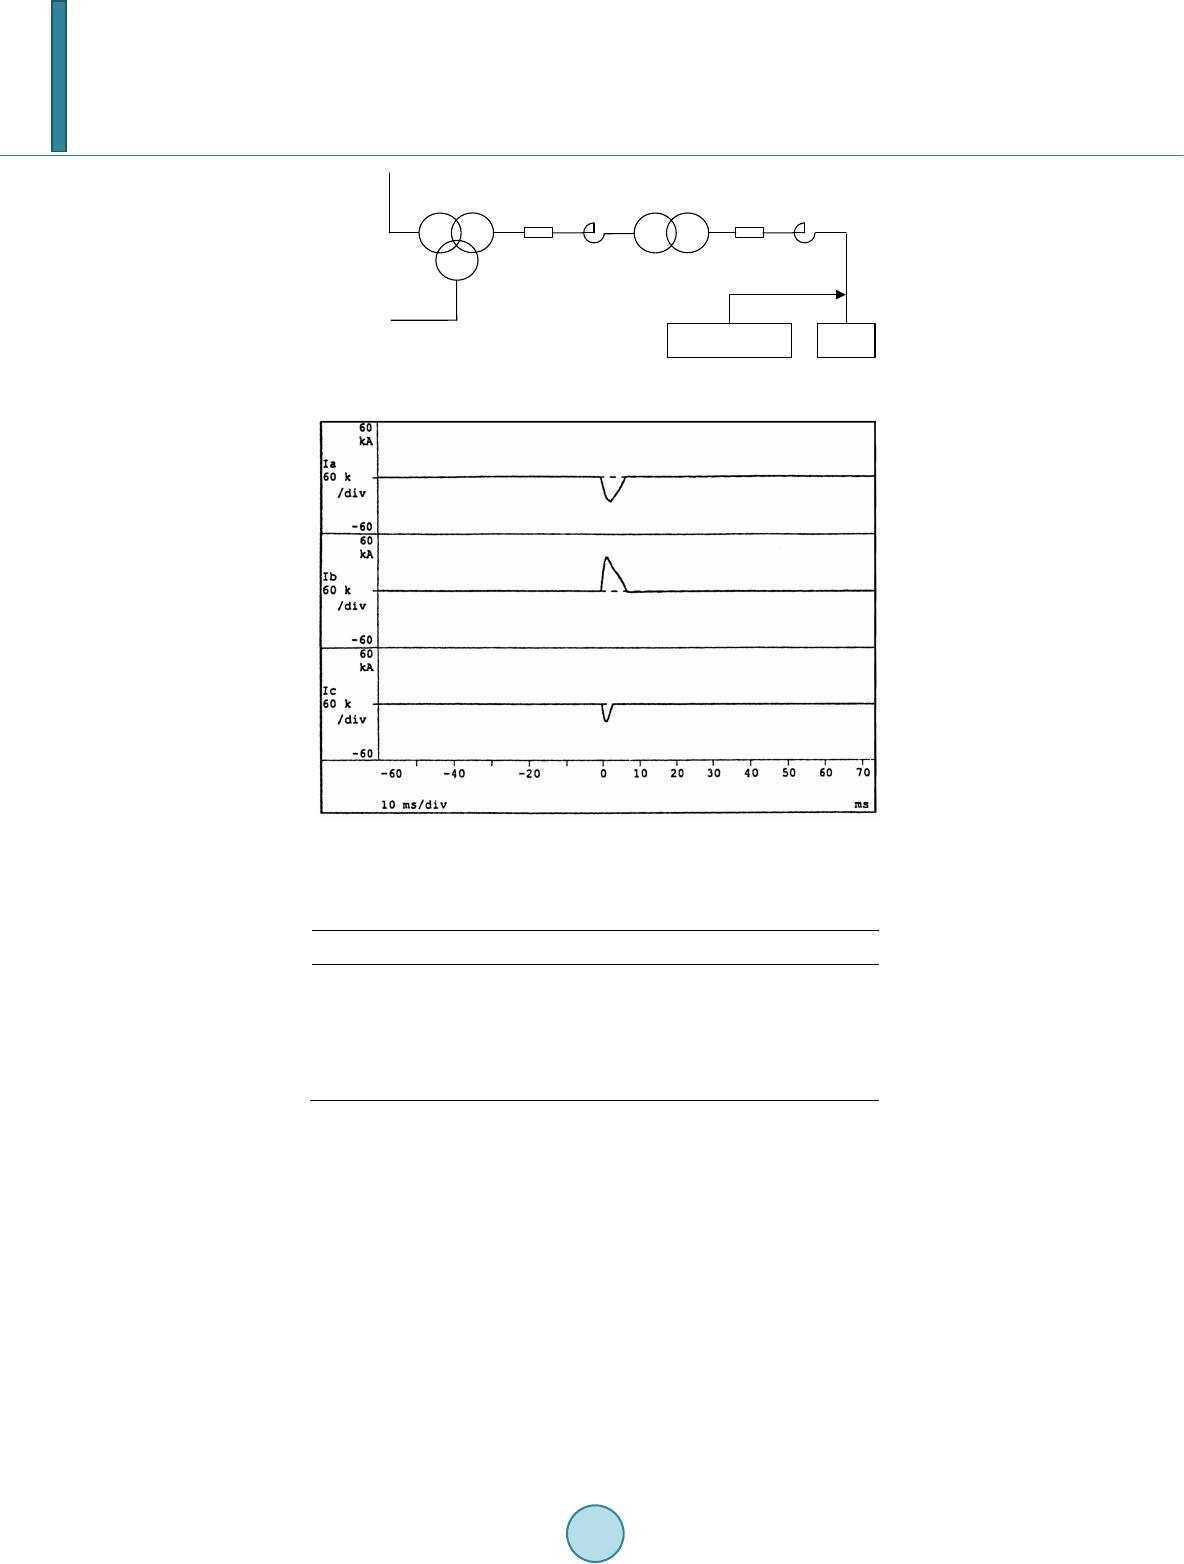
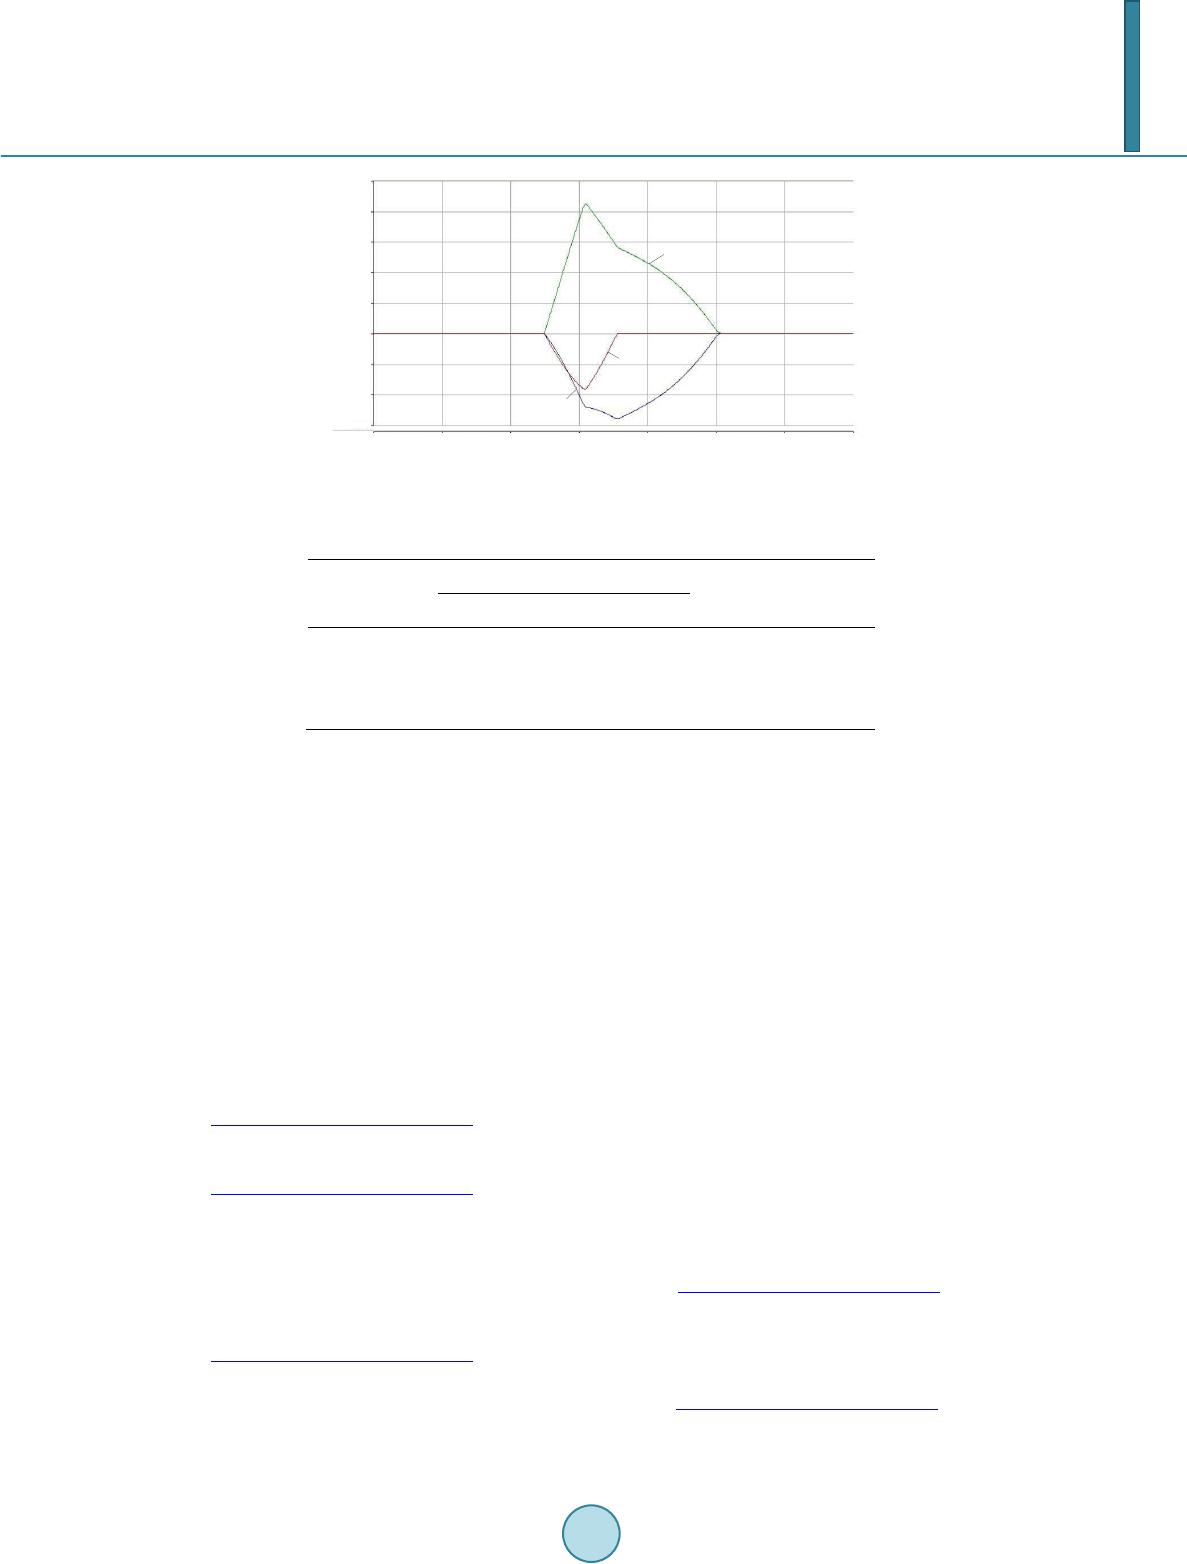
Figure 9. Three phase current waveforms of the short circuit current breaking
simulation for the MCCB.
Table 2. Comparison of simulation results with experiment.
Short circuit
characteristic
Short circuit current peak value (kA) Duration of
short-circuit Arc
duration
(ip)a (ip)b (ip)c
Experiment 25.8 35.7 18.2 5.93 4.72
Simulatioin 25.2 38.8 17.1 5.42 4.32
Relative error 2.3 8.7 6.0 8.6 8.5
PSCAD/EMTDC. The relative errors between simulation and experiment measurement are less than 9% which
demonstrate that the model is accurate enough to describe the dynamic behavior and protection feature of the
MCCB. The simulation model for MCCB can be directly used in the simulation program based on PSCAD/
EMTDC. So simulation programs for different shipboard power systems which contain multiple machines,
complex distribution network and multiple circuit breakers can be built. It will be useful to evaluate the protec-
tion performance of the power system by short-circuit interruption simulations which can then be optimized by
adjusting protection parameters setting of circuit breakers.
Acknowledgements
This work was supported by the National Natural Science Foundation of China (NSFC) under Grant 51207165.
References
[1] Kawase, Y., Mori, H. and Ito, S. (1997) 3-D Element Analysis of Electrodyanmic Repulsion Forces in Stationary Elec-
tric Contacts Taking into Account Asymmetric Shape. IEEE Transactions on Magnetics, 33, 1994-1999.
http://dx.doi.org/10.1109/20.582692
[2] Tto, S. and Takato, Y. (1998) Numerical Analysis of Electromagnetic Forces in Low Voltage AC Circuit Breakers Us-
ing 3-D Finite Element Method Taking into Account Eddy Currents. IEEE Transactions on Magnetics, 34, 2597-2600.
http://dx.doi.org/10.1109/20.717600
[3] Stammberger, H. (1998) Force Calculation for the Movable Contact of Circuit Breakers. Proceedings of the 19th In-
ternational Conference on Electric Contact Phenomena, Nuremberg, 14-17.
[4] Atienza, E., Perrault, M. and Wurtz, F. (2000) A Methodology for the Sizing and the Optimization of An Electro mag-
netic Release. IEEE Transactions on Magnetics, 36, 1659-1663. http://dx.doi.org/10.1109/20.877761
[5] Bizjak, G., Zunko, P. and Povh, D. (1995) Circuit Breaker Model for Digital Simulation Based on Mayr’s and Cassie’s
Differential Arc Equations. IEEE Transactions on Power Delivery, 10, 1310-1315.
http://dx.doi.org/10.1109/61.400910
[6] Schavemaker, P.H. and van der Sluis, L. (2000) An Improved Mayr Type Arc Model Based on Current-Zero Mea-
surements. IEEE Transactions on Power Delivery, 15, 580-584. http://dx.doi.org/10.1109/61.852988
[7] Rong, M.Z., Yang, F., Wu, Y., Murphy, A.B., Wang, W.Z. and Guo, J. (2010) Simulation of Arc Characteristics in
J. Huang et al.
540
Miniature Circuit Breaker. IEEE Transactions on Plasma Science, 38, 2306-2311.
http://dx.doi.org/10.1109/TPS.2010.2050703
[8] Wang, Q., Li, X.W., Chen, D.G. and Rong, M.Z. (2010) Simulation of the Venting Configuration Effects on Arc Plas-
ma Motion in Low-Voltage Circuit Breaker. IEEE Transactions on Plasma Science, 38, 2300-2305.
http://dx.doi.org/10.1109/TPS.2010.2049382
[9] Dommel, H.W. (1986) EMTP Theory Book. Bonneville Power Administration, Portland.