D. Johnston
Increasingly, low power distributed generation is being installed on the distribution network. This includes
renewable energy sources (photovoltaic (PV), wind, etc) and combined heat and power (CHP) generators [4].
Utility-owned generators will be installed on the 380 V, 10 kV, 35 kV (or higher) sections–depending on output
power, and will be controlled by the network operator [5] [6]. Similar generators may be installed by private
supply companies, and arrangements may be put in place for these to be controlled by the network operators.
Generators used by property owner/occupiers and installed on their premises–on-site generation–will largely be
s mall-scale, and installed on the 380 V network [7]. (A typical exception would be a large generator installed on
industrial premises.) These will be operated by the building occupiers according to their needs and priorities,
and even where an agreement exists with the network operator, the degree of external control will generally be
limited. These generators will reduce the currents in the lines, thus reducing the voltage drop produced by loads,
and in extreme cases they will reverse the current flow, resulting in a voltage rise along the line. In the case of
on-site generation, this will not generally be subjected to network control.
Provision of on-line tap changing on 10 kV/380 V transformers will allow independent real-time control of
different 380 V networks fed from a given 10 kV feeder. This will allow the line voltages to be maintained
within limits for a wider range of loading generating conditions. However, this will not provide independent
control of the feeders supplied by a given 10 kV/380 V transformer, which would be required where the loading
and/or generation varied greatly between feeders. A situation where this might occur is as follows. One or more
feeders supply domestic premises, which have a significant quantity of installed PV systems. Another feeder
supplies small commercial premises (e.g., shops), which have little or no installed generation. During the work-
ing day, the domestic loads are light, and PV generation is high, resulting in excess generation and voltage rises
along these feeders. At the same time, the commercial loads are high, resulting in a voltage drop along the rele-
vant feeder. It may not always be possible to maintain the voltages within limits for all the feeders, with all of
them connected to the same tap of the transformer.
By placing the taps on the output side of the transformer, it is possible for each feeder to be connected to a
different tap. The line voltage along each feeder can then be kept within limits by measuring the line voltage at
the far end of the feeder (and at other points, if necessary) and changing the tap setting accordingly. This can in-
crease the range of loading/generation conditions which can be accommodated on a given low voltage network.
2. Computer Simulation
An Excel based modelling tool and a Matlab® Simulink were used to simulate a low voltage network. The Excel
modelling tool allowed a range of conditions to be modelled in a short time, and a selection of these were used
as the basis for modelling in Simulink.
2.1. Excel Based Model
The Excel modelling tool used a simple resistive network to model a set of low voltage feeders. Each feeder is
divided into sections, with the length and cable type specified by the user, thus determining the resistance of
each section. Loads and distributed generators are located at nodes between sections, with the power of each
specified by the user. The difference between these is the net power. The resistance of each (net) load is calcu-
lated based on the rated voltage (R = V2/P). Thus, generators are represented as negative resistances. (Modelling
these as nonlinear sources in combination with resistive loads and lines would require iterative solutions.) This
results in the voltages being approximate. However, the modeling tool allows the network parameters (loads,
line resistances, etc.) to be changed quickly, so that a wide range of operating conditions can be investigated in a
short time. An appropriate selection of these can then be analysed further in Simulink. The first and second se-
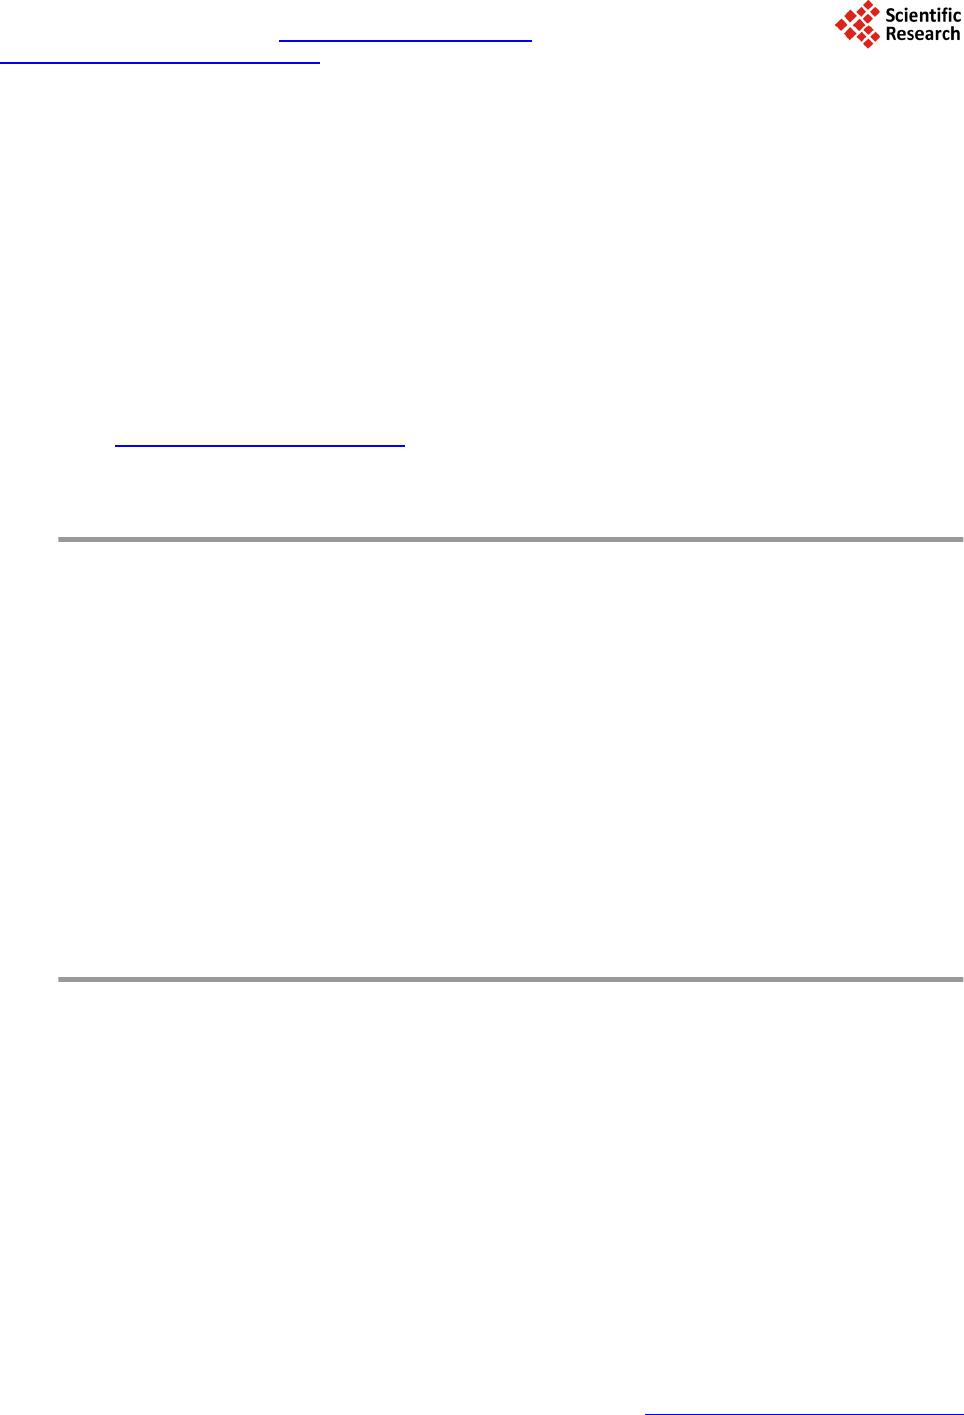
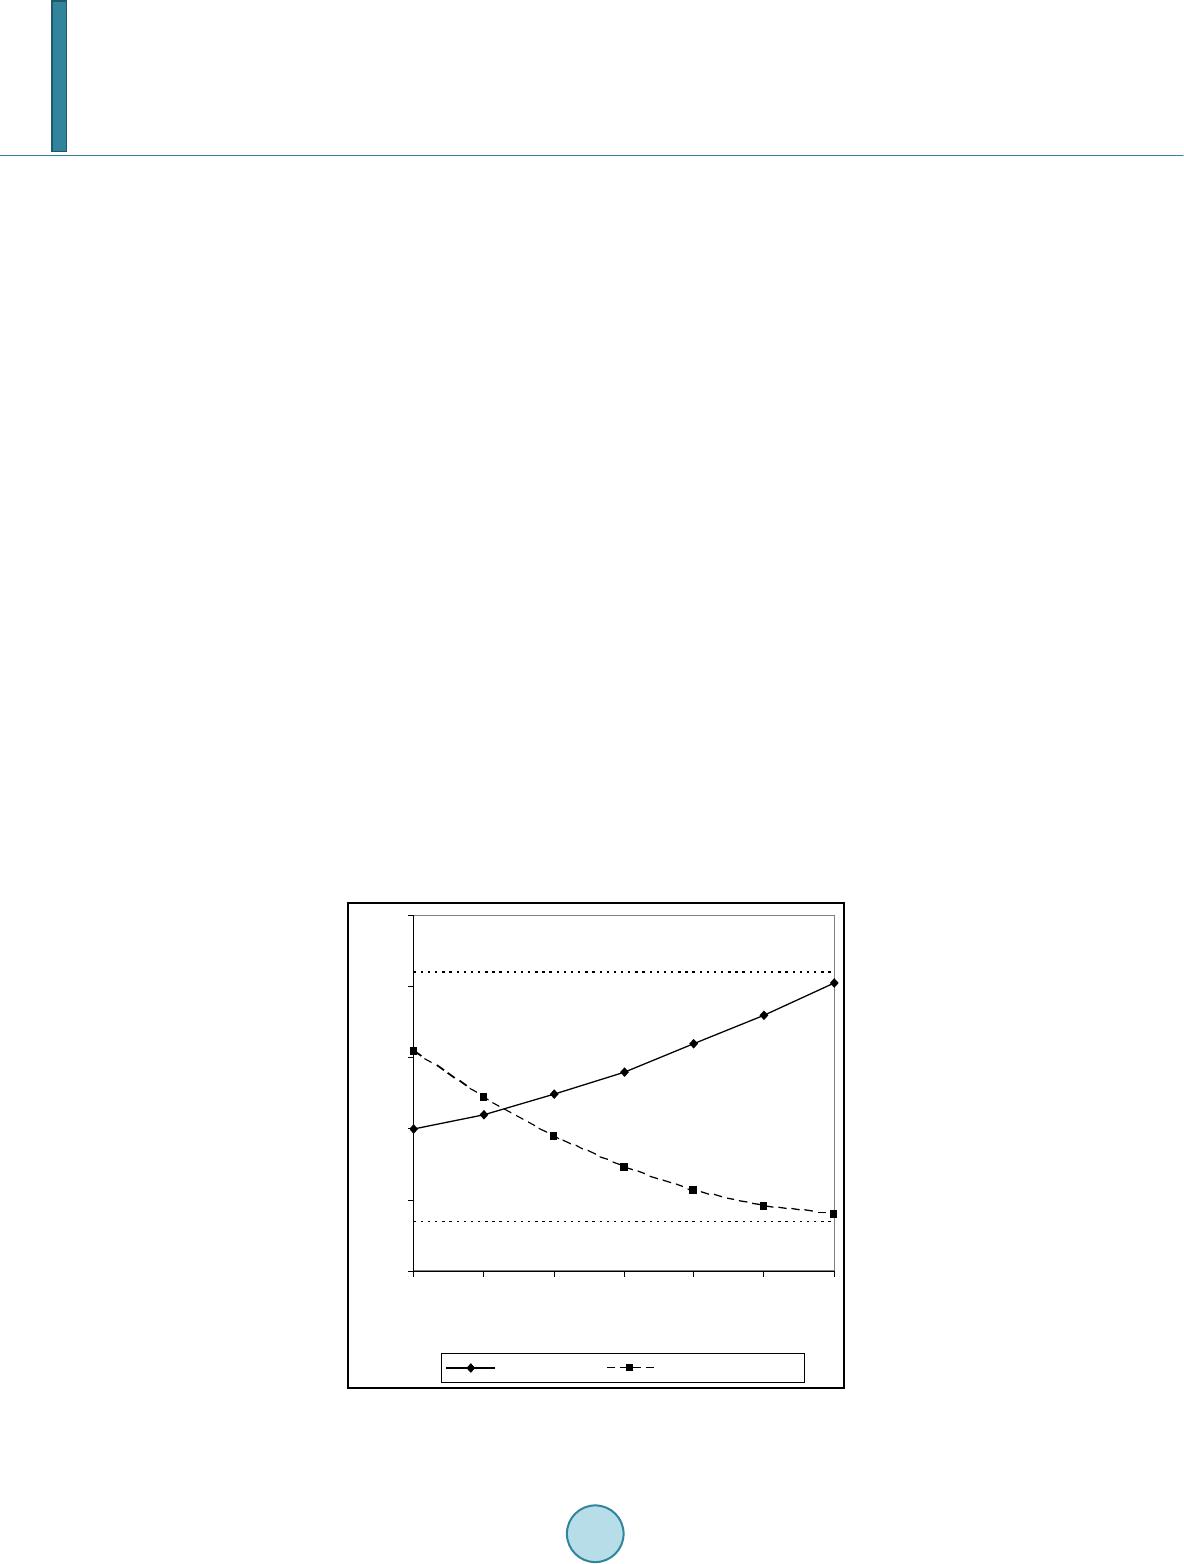
ries of models were for a fixed tap, and a common on-line tap for all feeders respectively. The results for a
common on-line tap are shown in Figure 1. As seen, the voltage on the feeder with distributed generation ex-
ceeds the maximum limit, while the voltage for the heavily loaded feeder is below the minimum limit. Therefore,
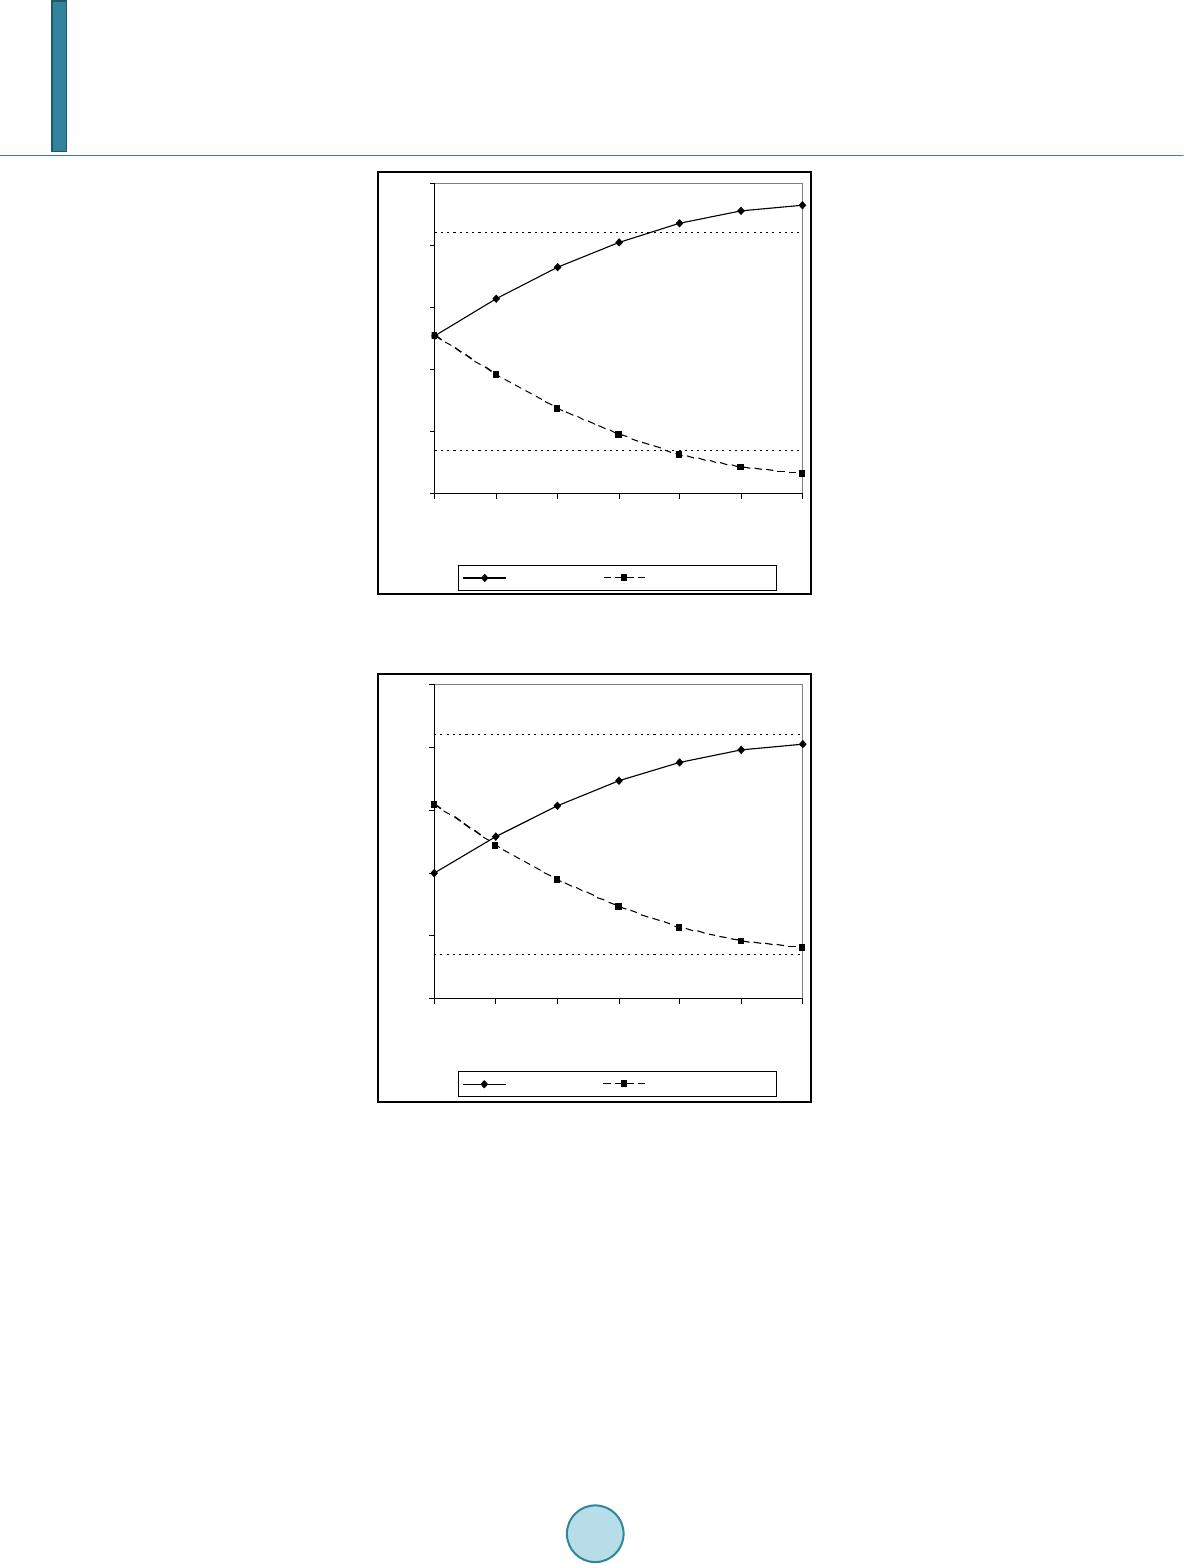
there is no common tap setting, for which the voltages on all the lines will be within the limits. By changing the
tap settings for each feeder separately, it is possible to keep the voltages on both feeders within limits along their
entire length, as shown in Figure 2.
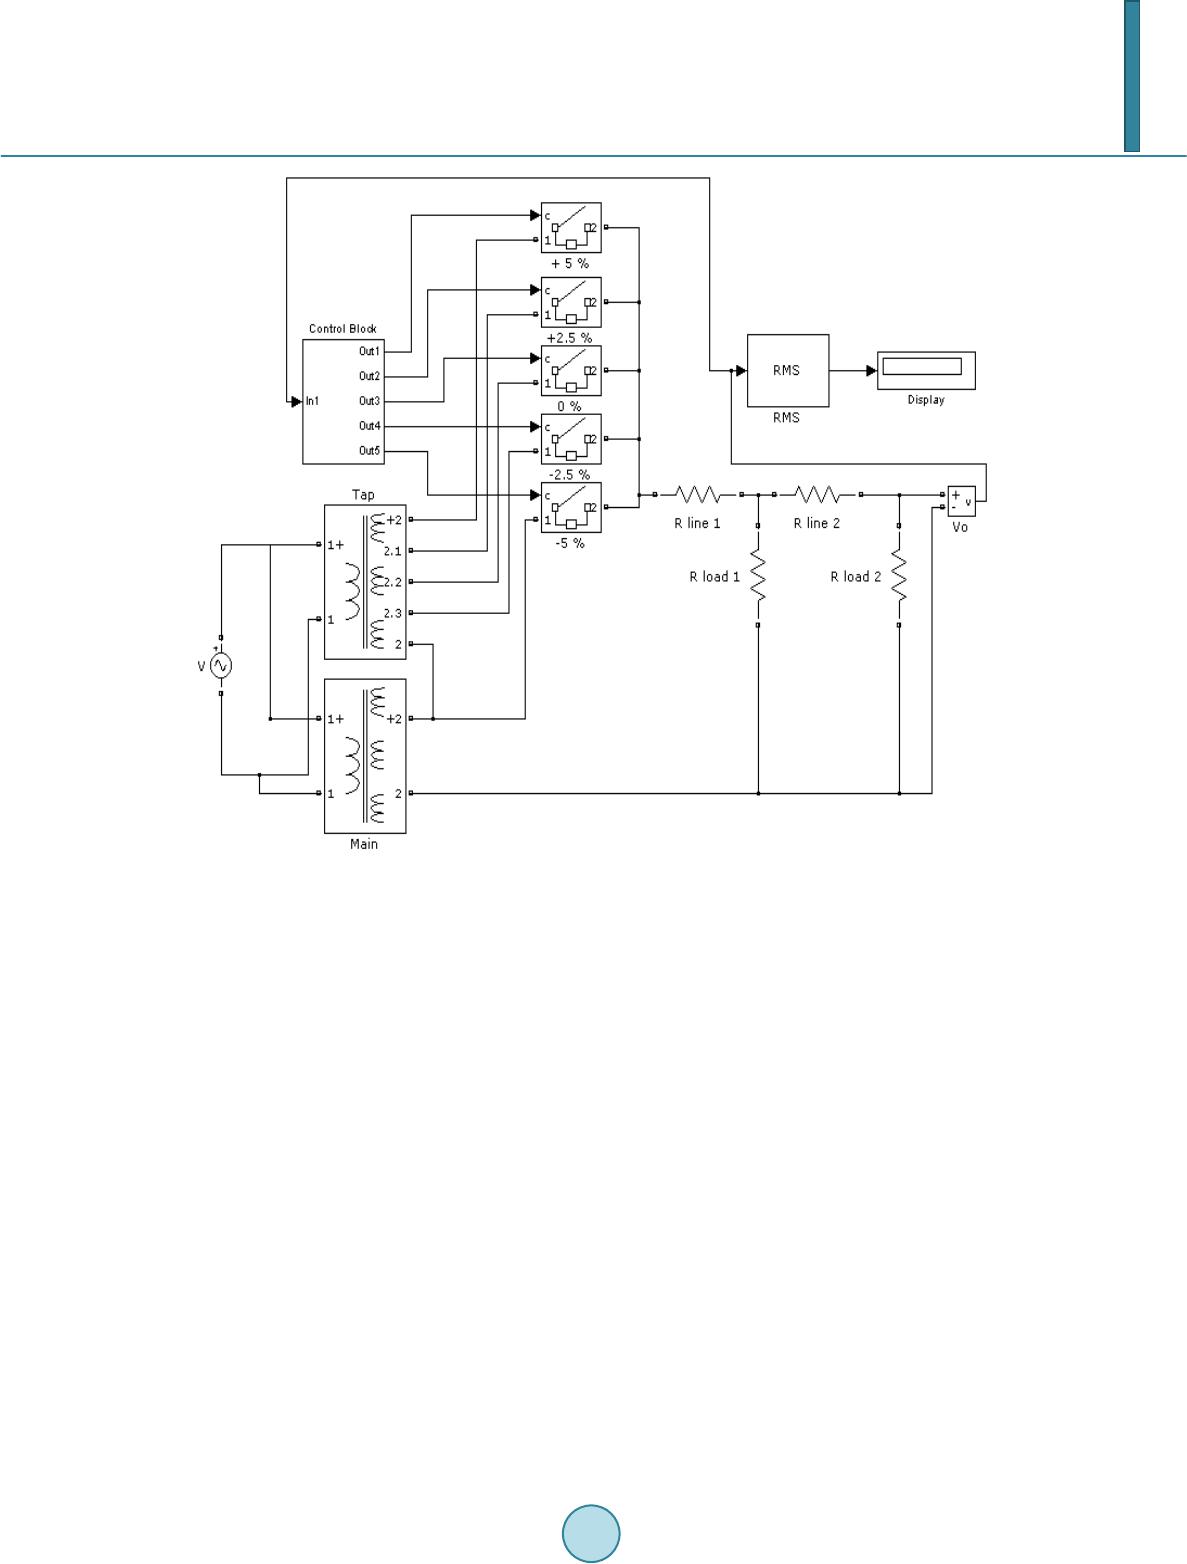
2.2. Simulink Model
A Simulink model was used for more detailed and accurate analysis of the scenarios selected using the Excel