 Journal of Geoscience and Environment Protection, 2014, 2, 123-128 Published Online April 2014 in SciRes. http://www.scirp.org/journal/gep http://dx.doi.org/10.4236/gep.2014.22017 How to cite this paper: Amarsaikhan, D. et al. (2014). A Study on Air Pollution in Ulaanbaatar City, Mongolia. Journal of Geoscience and Environment Protection, 2, 123-128. http://dx.doi.org/10.4236/gep.2014.22017 A Study on Air Pollution in Ulaanbaatar City, Mongolia D. Amarsaikhan1,2, V. Battsengel2, B. Nergu i1, M. Ganzo ri g1, G. Bolor1 1Institute of Informatics, Mongolian Academy of Sciences, Ulaanbaatar, Mongolia 2Department of Geography, National University of Mongolia, Ulaanbaatar, Mongolia Email: amar64@arvis.ac.mn Received February 2014 Abstract At present, air pollution has become the main problem in many developed and developing coun- tries. Especially, in Ulaanbaatar city of Mongolia, it has become one of the most tackled issues of every citizen living in the capital city. The aim of this study is to highlight the trend of air pollution and pollution sources in the Mongolian capital and conduct some air pollution analyses. Overall, the study indicates that the air pollution in Ulaanbaatar city is a very serious problem and for its reduction, rapid and thorough measures should be taken. Keywords Air Pollution; Pollutants; Ulaanbaatar City; Thorough Measures 1. Introduction Mongolian territory covers northeast and central Asia and has an area of 1.565,000 sq.km. The population of the country is about 2.9 million. The main type of land use is pastureland for semi-nomadic livestock husbandry and it covers about 81% of total land of the country. Natural hazards include dust and snowstorms, grassland and forest fires, and drought and heavy snow. The drought, high temperature and high radiation decrease the cohe- sion of the exposed fertile topsoil and strong winds blow away the topsoil particles, resulting in dust storms, in- cluding yellow dust. Meanwhile, there have been observed different man-made problems such as forest and steppe fires, and pollutions due to extensive mining activities (Amarsaikhan, 2011). All these factors seriously influence the air quality in rural Mongolia. In recent years, air pollution of Ulaanbaatar city has become the main problem of every citizen living in the Mongolian capital. Population growth caused mainly by rural to urban migration has led to major increases in the capital city’s air pollution emissions. Much of the population growth has been in the city’s low-income ger (Mongolian national dwelling) districts where coal and wood are burned for heat. Majority of Ulaanbaatar’s population lives in a ger and each ger family burns an average of 5 tons of coal and 3 m3 of wood per year (Gut- tikunda, 2007). Public and private transports also contribute to air pollution of the capital city. From 2005 to 2013, the number of vehicles in Ulaanbaatar increased from 75,000 to 300,100. The city’s other major air pollu- tion sources include 3 coal-fueled power plants, about 400 heat-only boilers, and wind-blown dust (Davy et al., 2011). Different attempts have been made to reduce the air pollution, but there is a very little change. 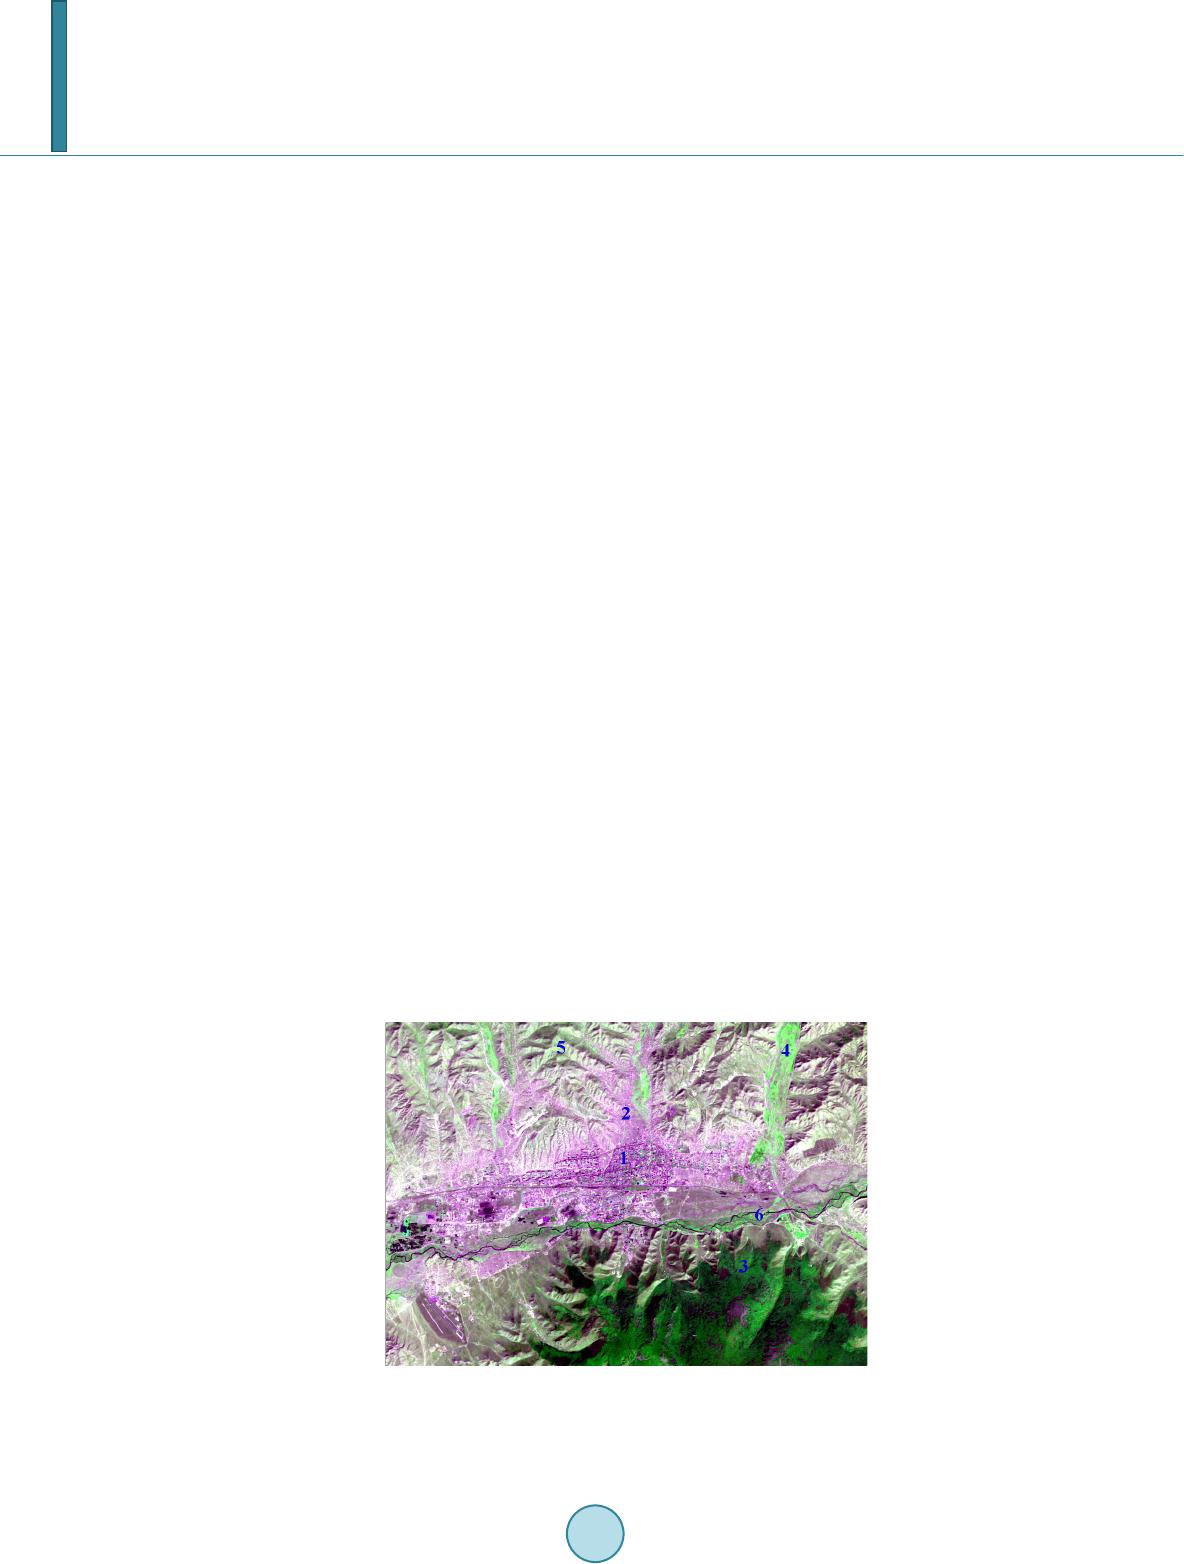 D. Amarsaikhan et al. A scenario analysis of air pollution emissions in Ulaanbaatar for the years 2010 and 2020 taken by World Bank indicated that unless the Mongolian Government makes a very serious effort to address these issues at multiple levels, air pollution and its corresponding health impacts in Mongolia will be significant. While there is no single solution to reduce the existing problems, a combination of measures ranging from public education and awareness to strengthen of monitoring and enforcement, to improve methodological approach and technol- ogy is necessary in order to successfully address the increasing levels of air pollution (Guttikunda, 2007). The aim of this study is to conduct some air pollution analyses in Ulaanbaatar, the capital city of Mongolia. As part of the research, the present situation of air pollution and pollution sources in the city have been broadly reviewed and some suggestions for pollution reduction were given. 2. Study Area and Pollutant Sources As a study site, Ulaanbaatar, the capital city of Mongolia has been selected. Ulaanbaatar is situated in the central part of Mongolia, in the Tuul River valley, at an average height of 1350 m above sea level. By 2013 statistics, population of the city was counted at about 1,300,000 inhabitants (Mongolian Statistical Year Book, 2013). Ulaanbaatar today is the main political, economic, business, scientific and cultural center of the country. In addi- tion, the city is home to the central government and its bureaucratic structure, and the most prominent public and private institutions of higher learning and best medical services (Amarsaikhan et al., 2013). Figure 1 shows re- cent outlook of the test area in the Landsat TM satellite image and some examples of its land cover. The image covers the majority of the area belonging to the capital city, although there are some areas extending outside of the selected image frame. The air pollution sources in Ulaanbaatar include coal burning in gers, industrial boilers, dust emissions of construction, power plants, improved stoves, household heating systems, brick kiln operations, public and pri- vate transports, road re-suspension, fly ash re-suspension, and garbage burning. Of these, especially, during winter time, smog of ger districts, motor vehicles and power plants produce a very large amount of air pollutants. Generally, in Ulaanbaatar city, combustion for domestic cooking and heating, motor vehicles and power plants are the main sources of air pollution (Figure 2). Also, the most typical urban pollutants include suspended par- ticulate matter (SPM), sulfur dioxide (SO2), volatile organic compounds (VOCs), lead (Pb), carbon monoxide (CO), carbon dioxide (CO2), nitrogen oxides (NOx) and ozone (O3). Of these pollutants, the particulate matter (PM) is one of the most critical pollutants responsible for the largest health and economic damages. Because of the importance of the PM pollution for human health, visibility and the environment, many studies are focused primarily on PM pollution as a target pollutant (Guttikunda et al., 2013). In Ulaanbaatar city, enhancement of the air pollution and frame of pollutants is also due to its geographic lo- cation and topography. Figure 3 shows a 3D satellite image of Ulaanbaatar. As seen from the image, the city is surrounded by valley of mountains. Pollution sources tend to be concentrated, and in the weather phenomenon Figure 1. 2011 satellite image of Ulaanbaatar city. 1-built-up area; 2-ger area; 3-forest; 4-grass; 5-soil; 6-water. The size of the area is 28 km × 20 km. 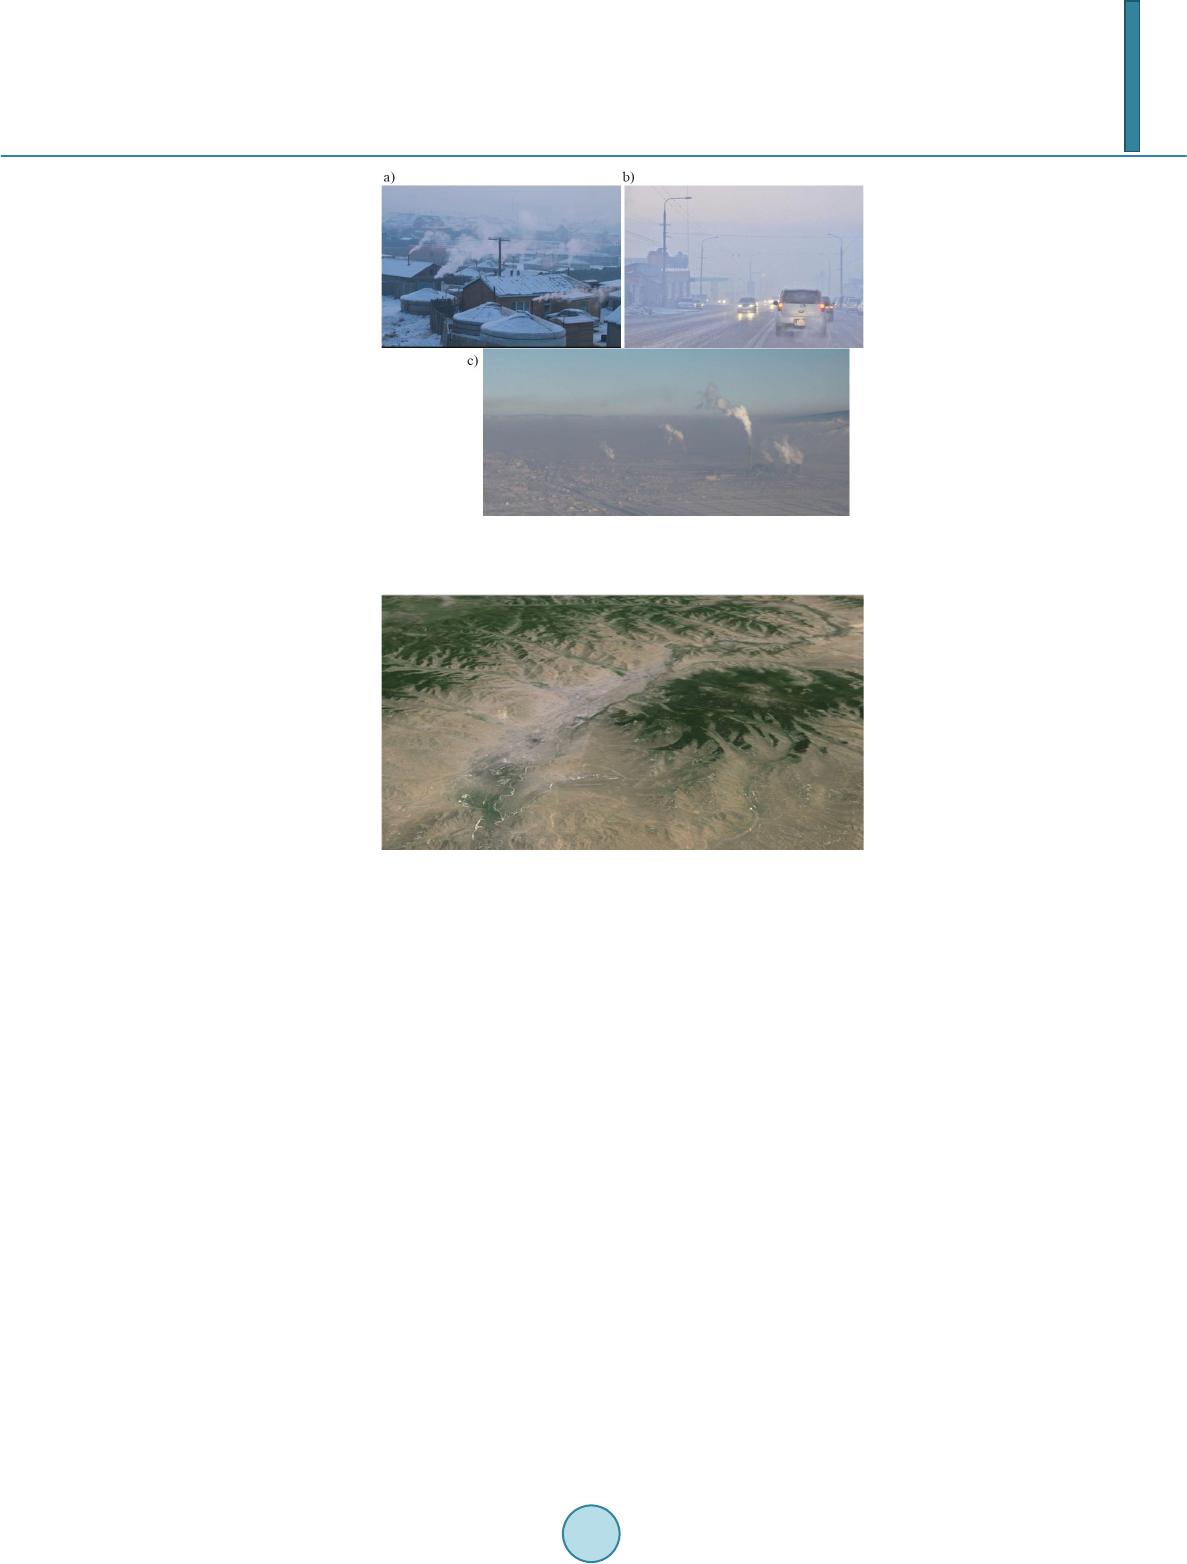 D. Amarsaikhan et al. Figure 2. Main sources of air pollution: (a) ger area, (b) motor vehicles, (c) power plants. Figure 3. 3D Landsat satellite image of Ulaanbaatar city (View looks from the west to the east). known as thermal inversion, a layer of cooler air is trapped near the ground by a layer of warmer air above not allowing for any dispersion of pollutants. In such a case, normal air mixing almost ceases and pollutants are trapped in the lower layer. During winter periods, the effects of thermal inversion are enhanced because of lower geo-potential or mixing-layer heights (Guttikunda, 2007). 3. Air Pollution Study National Agency for Meteorology, Hydrology and Environmental Monitoring and National Air Quality Council of Mongolia deal with air pollution monitoring at a national scale. Their tasks include determination of the problems, collection of all data/information from air quality monitoring network, and creation of integrated da- tabase for analysis and information sharing. It should be mentioned that the air pollution is a top priority issue for the government, and its monitoring is very important. Until 2006, Ulaanbaatar city had 4 fixed air quality monitoring stations and 15 mobile stations for regulatory purposes. These 4 stations mainly located in the internal parts of the capital city only measured sulfur dioxide (SO2) and nitrogen oxides (NO2) concentrations. Figures 4(a)-(c) show station locations and monthly average sulfur dioxide and nitrogen oxides concentrations measured at the 4 stations in 2006. As seen, the stations 2 and 4, which are closer to central part, are indicative of urban signature. The studies from the monitoring data indi- cate rise in the peak SO2 and NO2 concentration. However, SO2 pollution, which has sources similar to PM10, confirms a direct linkage to growing trend in coal use. Similarly, growing vehicular population is one of the primary causes for increased NO2 levels, a primary precursor for ground-level ozone pollution and secondary contributor to PM2.5 pollution (Guttikunda et al., 2013). It could be seen that the 4 stations and their capabilities were insufficient to cover a large area and conduct thorough air pollution related studies.  D. Amarsaikhan et al. Figure 4. Station locations (a) and monthly average SO2 (b) and NO2 (c) concentrations (Source: Guttikunda, 2007). Over the last few years, technological capacity has been improved and many advanced techniques were in- stalled for air pollution monitoring. This has given a chance to improve the quality of the research, meanwhile covering more extensive spatial area of the capital city. For instance, a study conducted from 1 June 2009 to 31 May 2010 showed that the annual average concentrations of PM10, PM2.5, and SO2 measured at the station-2 were 165.1, 75.1, and 50.5 μg/m3 (17.7 ppb), accordingly. Concentrations were highest in winter, for example, the mean (±SD) 24 hour PM2. 5 concentration from June to August) was 22.8 ± 9.0 μg/m3, while from December to February the mean concentration was 147.8 ± 61.2 μg/m3. The 24 hour PM2. 5/ PM10 ratios were also highly variable between seasons with the mean ratio of 0.26 ± 0.11 in summer and 0.78 ± 0.12 in winter (Ryan et al., 2013). These are illustrated in Figure 5. Such analysis could be frequently made in all stations and improve a decision-making process toward the pollution reduction. Moreover, recently, some technological and methodological improvements have been made with the help of some international organizations. For example, Japan International Cooperation Agency (JICA) implemented a project on capacity building and air pollution reduction of Ulaanbaatar city from March 2010 to March 2013. Within the framework of the project, the Mongolian specialists acquired some advanced knowledge about mod- ern techniques and methods for the solution of air pollution problems. As a result of the project, some very im- portant recommendations were given and many results were obtained. One of the project outputs is shown in Figure 6 (i.e. PM10 concentration map of the capital city). As seen from the Figure 6, the PM10 concentration is high in the city center and is reduced in the urban fringes. 4. Measures to Reduce Air Pollution There are some urban emission controlling methods used in most developing countries such as fuel switching to gas and low-sulfur coal, the more wide-scale use of district heating systems, use of flue-gas desulphurization, emission control equipment, energy efficient installations, and the use of advanced combustion technologies. However, there are a large number of combustion sources that may be difficult to control, and the efficiency of these technologies and levels of emission control remain low (Guttikunda, 2007). In case of Ulaanbaatar city, the following actions could be considered for the reduction of emission and air pollution: • Efficiently improved power plant scrubbers; • Efficiently improved PP-4 electrostatic precipitators; • Use of flue gas desulphurization technologies for sulfur control in power plants; • Efficient NOx control in power plants; 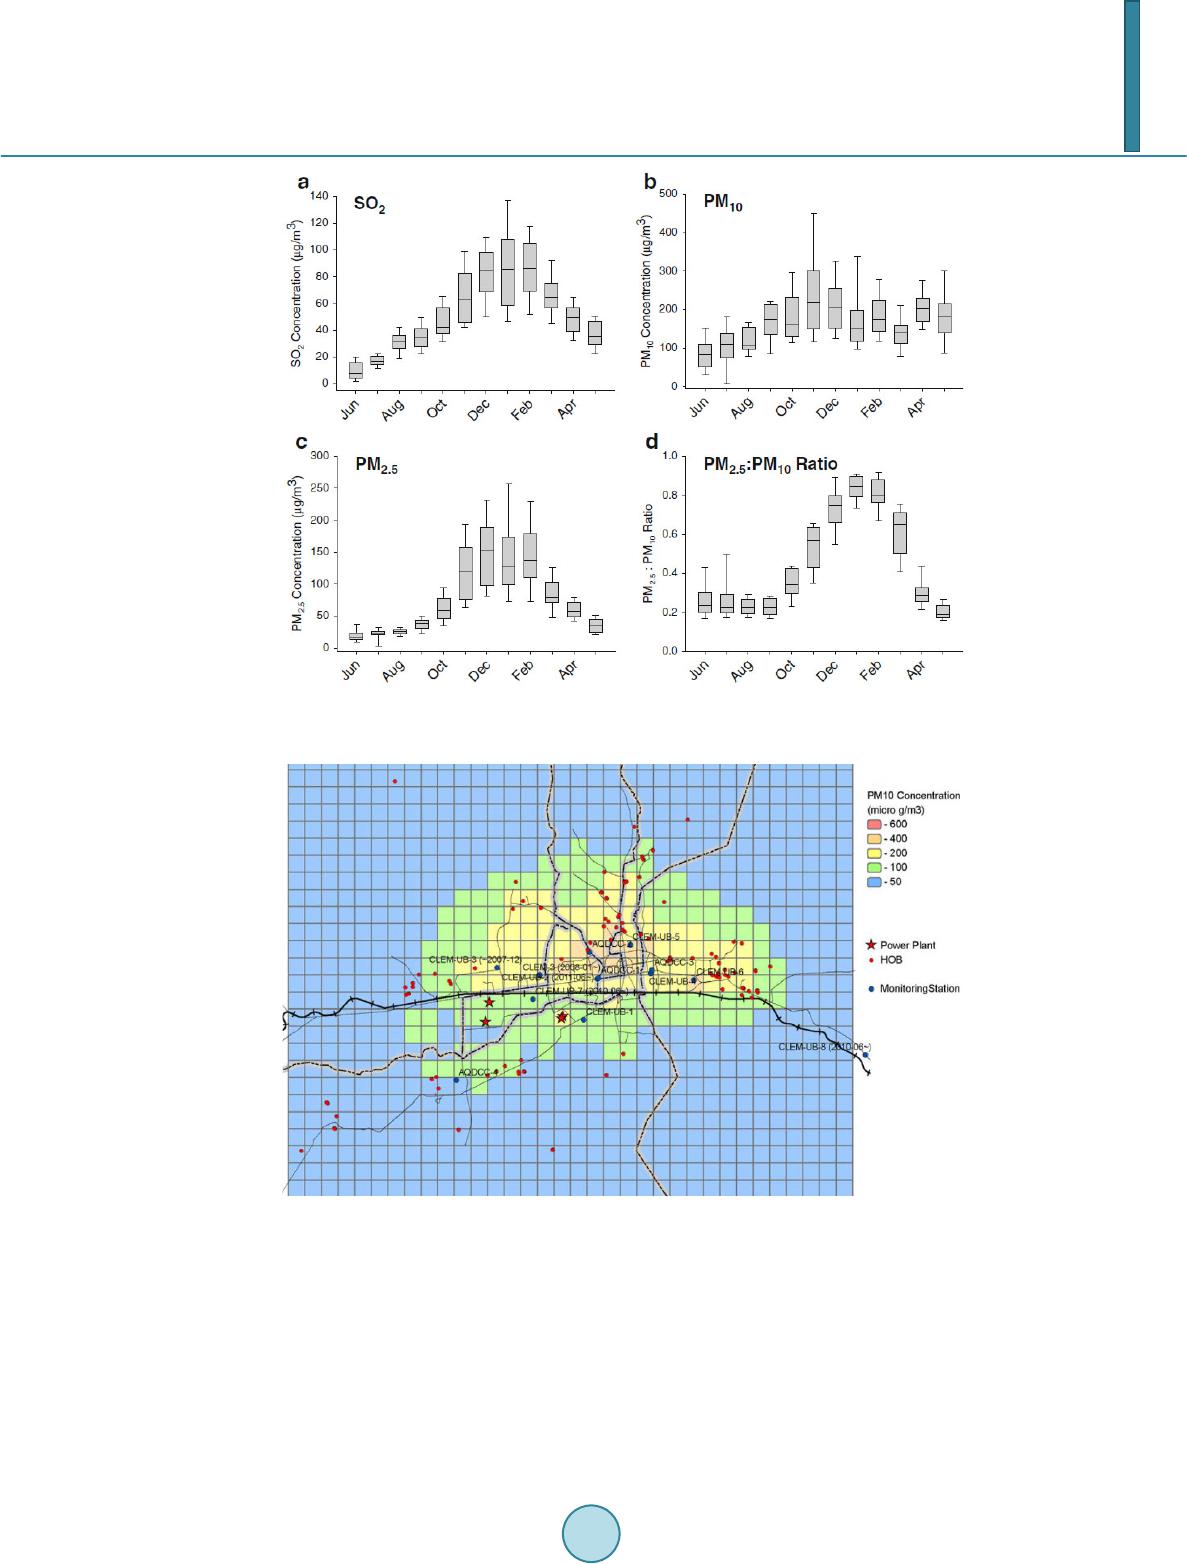 D. Amarsaikhan et al. Figure 5. Monthly distributions of 24 hour average (a) SO2, (b) PM10, (c) PM2.5, (d) PM2.5/ PM10 ratio (Source: Ryan et al., 201 3). Figure 6. PM10 concentration map of Ulaanbaatar city (Source: Enhmaa & Toru, 2013). • Smoke-less coal for burning in ger districts; • Improved stoves for ger families; • Gasification and solar heaters for ger families; • Ash pond maintenance—brick making; • Reduction of local garbage burning; • Gasification of urban and solid waste; • Paved road dust reduction—sweepers; • Use of solar heaters for winter camping and housing;  D. Amarsaikhan et al. • Abolishing of small scale boilers for heating; • Promotion of public transportation; • Encouragement of vehicle restriction through license plate numbers; • Inspection and elimination of older and too old vehicles; • Transfer of garbage/waste burning factories to eastern part of the city. 5. Conclusion The aim of this study was to highlight the trend of air pollution and pollution sources in Ulaanbaatar city, Mon- golia and conduct some air pollution analyses. It was seen that among many factors, smog of ger districts, motor vehicles and power plants produced majority of air pollution. As seen from the analyses, besides many influen- cing factors, geographic location and topography of the capital city played a major role for the air pollution keeping. Because, a layer of cooler air was trapped near the ground by a layer of warmer air above, which was not allowing for any dispersion of pollutants. In such a case, normal air mixing almost ceased and pollutants were trapped in the lower layer. In addition, as part of the research, some suggestions for pollution reduction were given. References Amarsaikhan, D. (2011). Applications of Advanced Technology for Combating Land Degradation and Desertification in Mongolia. In Proceedings of the International Science Council of Asia Conference (pp. 12-27 ). Ulaanbaatar, Mongolia. Amarsaikhan, D., Bat-Erdene, Ts., Ganzorig, M., & Nergui, B. (2013). Applications of Remote Sensing Techniques and GIS for Urban Land Change Studies in Mongolia. American Journal of GIS, 2, 27-36. Davy, P. K., Gunchin, G., & Markwitz, A. (2011). Air Particulate Matter Pollution in Ulaanbaatar, Mongolia: Determination of Composition, Source Contributions and Source Locations. Atmospheric Pollution Research, 2, 126-137. http://dx.doi.org/10.5094/APR.2011.017 Enhmaa, S., & Toru, T. (2013). Sources Inventory and Distribution Modeling. In Capacity Strengthening in Air Pollution Monitoring of Ulaanbaatar City, Mongolia (pp. 1-12 ). JICA Project Report, Ulaanbaatar, Mongolia. Guttikunda, S. (2007). Urban Air Pollution Analysis for Ulaanbaatar. The World Bank Consultant Report (pp. 1-132). Washington DC, USA. Guttikunda, S., Lodoisamba, S., Bulgansaikhan, B., & Dashdondog, B. (2013). Particulate Pollution in Ulaanbaatar, Mongo- lia. Air Quality, Atmosphere and Health, 6, 589 -601. http://dx.doi.org/10.1007/s11869-013-0198-7 National Statistical Office of Mongolia (2013 ). Mongolian Statistical Year Book. Ulaanbaatar, Mongolia: National Statistical Office of Mongolia. Ryan, A. W., Gombojav, E., Barkhasragchaa, B., Byambaa, T., Lkhasuren, O., Amram, O., Takaro, K., & Janes, R. (2013). An Assessment of Air Pollution and Its Attributable Mortality in Ulaanbaatar, Mongolia. Air Quality, Atmosphere & Health, 6, 137-15 0. http://dx.doi.org/10.1007/s11869-011-0154-3
|