 HEALTH, 2009, 1, 17-23 Published Online June 2009 in SciRes. http://www.scirp.org/journal/health Incorporating heterogeneous biological data sources in clustering gene expression data Gang-Guo Li1, Zheng-Zhi Wang1 1Institute of Automation, National University of Defense Technology, Changsha 410073, Hunan, China Email: ligangguo1982@126.com Received 13 April 2009; revised 13 May 2009; accepted 14 May 2009. ABSTRACT In this paper, a similarity measure between genes with protein-protein interactions is pro- posed. The chip-chip data are converted into the same form of gene expression data with pear- son correlation as its similarity measure. On the basis of the similarity measures of protein- protein interaction data and chip-chip data, the combined dissimilarity measure is defined. The combined distance measure is introduced into K-means method, which can be considered as an improved K-means method. The improved K-means method and other three clustering methods are evaluated by a real dataset. Per- formance of these methods is assessed by a prediction accuracy analysis through known gene annotations. Our results show that the improved K-means method outperforms other clustering methods. The performance of the improved K-means method is also tested by varying the tuning coefficients of the combined dissimilarity measure. The results show that it is very helpful and meaningful to incorporate het- erogeneous data sources in clustering gene expression data, and those coefficients for the genome-wide or completed data sources should be given larger values when constructing the combined dissimilarity measure. Keywor ds: statistical analysis; similarity/dissimilarity measure; gene expression data; clustering; data fusion 1. INTRODUCTION With the rapid development of microarray technology in the past few years, it is possible to monitor the expres- sion levels of thousands of genes simultaneously [1]. Data from microarray experiments are denoted as a ma- trix of genes by experimental conditions, where the con- ditions are usually either a set of tissues or consecutive time points in some environmental changes. The amount of microarray data is very large. And microarray data are mostly very redundant since many genes do not work alone but are expressed together and interact to each other. Thus, it is important to analyze the gene expres- sion data. Various clustering methods have been applied to the analysis of gene expression data. Hierarchical clustering [2] method becomes one of the most widely used tech- niques for the analysis of gene expression data with the advantages of simplicity and visualization of the results. K-means clustering [3] is a good alternative to hierar- chical clustering method when there is some prior knowledge about the number of the clusters hidden in the data. Hierarchical clustering and K-means clustering are both global clustering methods which use the full set of dimensions to measure the similarity and construct the same global feature space for all clusters, and therefore these clustering methods are likely to fail when they are used for high dimensional data. Many researchers at- tempted to solve this problem by different methods. Self-Organizing Map (SOM) method was introduced to interpret the patterns of gene expression [4]. Principle component analysis method as a feature transformation technique was used to preprocess expression data [5]. Support Vector Machine (SVM) method was also widely used to identify sets of genes due to its good learning performance for high dimensional data [6,7]. However, with the development of various genomic knowledge resources (e.g., characterized protein-protein interactions, functional annotations based on Gene On- tology (GO), and transcription factors binding sites), there comes a need to integrate the gene expression data with these genomic knowledge resources for finding some patterns with more biologically meaning. In the recent years, some researchers have done some work on the combination of gene expression data with some prior knowledge. Reference [8] proposed the con- struction of distance function which combines informa- tion originating from microarray assays and biological networks. The derived distance function was used fur- ther to perform joint clustering of genes and vertices of the network. Reference [9] introduced a machine learn-  18 G. G. Li et al. / HEALTH 1 (2009) 17-23 SciRes Copyright © 2009 HEALTH ing approach to information fusion which allows inte- gration of heterogeneous genomic data. Their procedure may be seen as a generalization of well-known SOM algorithm. Reference [10] defined a dissimilarity meas- ure for GO knowledge, and combined GO knowledge with gene expression data. They introduced their com- bined dissimilarity measure into Partitioning Around Medoids (PAM) [11] algorithm. In this paper we propose a general framework to combine the gene expression data with heterogeneous genomic knowledge resources in order to enhance biological relevance of clustering gene expression data. 2. DATA SOURCES 2.1. Protein-Protein Interactions Databases Protein-protein interactions assemble the molecular ma- chines of the cell and underlie the dynamics of virtually all cellular responses, while genetic interactions reveal functional relationships between and within regulatory modules [6]. The sum of all such interactions defines the global regulatory network of the cell. Proteomic and functional genomics platform technologies now generate large datasets of protein and genetic interactions, but these datasets vary widely in coverage, data quality, an- notation and availability. And so there are many different interaction databases such as BioGRID [12], DIP [13], BIND [14], MINT [15], and MIPS [16]. We use the data of BioGRID for our research. BioGRID is a general re- pository for interaction datasets. The recent version 2.0.34 release of BioGRID is a fully integrated cross- species database that supports most major model organ- isms, with increased data content and improved func- tionality. 2.2. Chip-Chip Data Chip-chip data are transcription factor-DNA binding data that are generated as a result of the chip-chip assay technique. This technique is used to determine whether proteins including transcription factors will bind to par- ticular regions of the chromatin within living cells. Two genome-wide chip-chip data sources produced by the technique are now available. One contains information regarding the binding of 106 yeast transcription factors [17]. The other one is a similar yeast dataset for a larger number of transcription factors [18]. Both the data sources are represented in the form of a confidence value (statistical p-value) of a transcription factor attaching to the promoter region of a gene. We use the chip-chip data source with a larger number of yeast regulators for our research, which contains information regarding the binding of 203 regulators to their respective target genes in rich medium. Besides rich medium, 84 regulators are profiled in at least one environmental condition other than rich medium. 3. METHOD 3.1. Similarity Measure between Genes with Protein-Protein Interactions Firstly we transfer protein-protein interactions into an interaction matrix. For the whole gene set, which has N genes, the interaction matrix is a N×N matrix M. If there is an interaction between two different genes, gene i and gene j, Mij=1. If there is no interaction between two dif- ferent genes, gene i and gene j, Mij=0. And a gene i al- ways can be considered as having an interaction with itself, so Mii=1. And then the similarity between genes with protein- protein interactions could be calculated as follows: N j ij ij PIPji M M ggsimilarity 1 ),( (1) 3.2. Similarity Measure of Gene Expression Data There are many ways to measure similarity between gene expression data. We choose the pearson correlation to represent similarity between gene expression data. And the pearson correlation, rexpr, is expressed as follows: M i M i ii M i ii r vvuu vvuu r 11 22 1 exp )()( ))(( (2) Here, and denote the expression levels of gene expression data and at experimental condi- tion i, respectively. M is the total number of the experi- mental conditions. i ui v uv u and v are the mean values of the expression levels of and , respectively. uv 3.3. Similarity Measure of Chip-Chip Data Suppose the chip-chip data represent the binding affinity of transcription factors to promoters of each of genes. If is the p-value for rejecting the null-hy- pothesis that transcription factor does not bind the promoter of gene , we define the binding score of tran- scription factor to promoter of gene as NT ij p /)pij j i j p i )log(log( min xij , where is the minimum of all p-values. min p ,),, 21 iixx(iN x i x denotes the complete binding profile for gene i. By doing so, the chip-chip data are presented in the same form of gene expression data. Thus we use the pearson correlation as the similarity measure for the chip-chip data. 3.4. Combined Dissimilarity Measure If similarity measure has been defined, dissimilarity 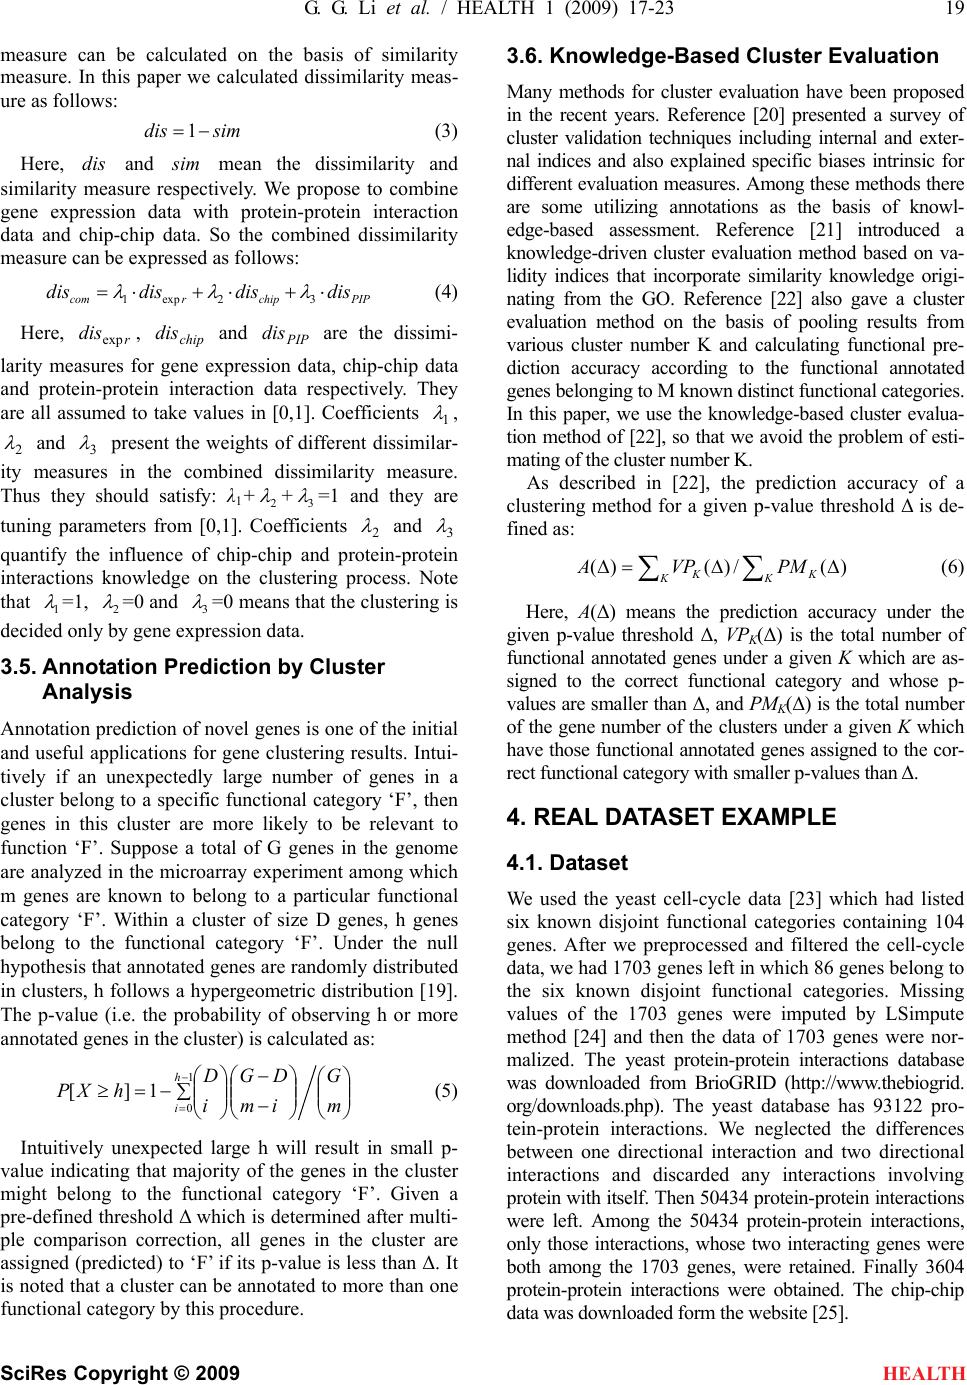 G. G. Li et al. / HEALTH 1 (2009) 17-23 19 SciRes Copyright © 2009 HEALTH measure can be calculated on the basis of similarity measure. In this paper we calculated dissimilarity meas- ure as follows: simdis 1 (3) Here, and mean the dissimilarity and similarity measure respectively. We propose to combine gene expression data with protein-protein interaction data and chip-chip data. So the combined dissimilarity measure can be expressed as follows: dis sim PIPchiprcom disdisdisdis 32exp1 (4) Here, , and are the dissimi- larity measures for gene expression data, chip-chip data and protein-protein interaction data respectively. They are all assumed to take values in [0,1]. Coefficients r disexp chip dis PIP dis 1 , 2 and 3 present the weights of different dissimilar- ity measures in the combined dissimilarity measure. Thus they should satisfy: λ1+2 +3 =1 and they are tuning parameters from [0,1]. Coefficients 2 and 3 quantify the influence of chip-chip and protein-protein interactions knowledge on the clustering process. Note that 1 =1, 2 =0 and 3 =0 means that the clustering is decided only by gene expression data. 3.5. Annotation Prediction by Cluster Analysis Annotation prediction of novel genes is one of the initial and useful applications for gene clustering results. Intui- tively if an unexpectedly large number of genes in a cluster belong to a specific functional category ‘F’, then genes in this cluster are more likely to be relevant to function ‘F’. Suppose a total of G genes in the genome are analyzed in the microarray experiment among which m genes are known to belong to a particular functional category ‘F’. Within a cluster of size D genes, h genes belong to the functional category ‘F’. Under the null hypothesis that annotated genes are randomly distributed in clusters, h follows a hypergeometric distribution [19]. The p-value (i.e. the probability of observing h or more annotated genes in the cluster) is calculated as: m G im DG i D hXPh i 1 0 1][ (5) Intuitively unexpected large h will result in small p- value indicating that majority of the genes in the cluster might belong to the functional category ‘F’. Given a pre-defined threshold Δ which is determined after multi- ple comparison correction, all genes in the cluster are assigned (predicted) to ‘F’ if its p-value is less than Δ. It is noted that a cluster can be annotated to more than one functional category by this procedure. 3.6. Knowledge-Based Cluster Evaluation Many methods for cluster evaluation have been proposed in the recent years. Reference [20] presented a survey of cluster validation techniques including internal and exter- nal indices and also explained specific biases intrinsic for different evaluation measures. Among these methods there are some utilizing annotations as the basis of knowl- edge-based assessment. Reference [21] introduced a knowledge-driven cluster evaluation method based on va- lidity indices that incorporate similarity knowledge origi- nating from the GO. Reference [22] also gave a cluster evaluation method on the basis of pooling results from various cluster number K and calculating functional pre- diction accuracy according to the functional annotated genes belonging to M known distinct functional categories. In this paper, we use the knowledge-based cluster evalua- tion method of [22], so that we avoid the problem of esti- mating of the cluster number K. As described in [22], the prediction accuracy of a clustering method for a given p-value threshold Δ is de- fined as: KK KKPMVPA )(/)()( (6) Here, A(Δ) means the prediction accuracy under the given p-value threshold Δ, VPK(Δ) is the total number of functional annotated genes under a given K which are as- signed to the correct functional category and whose p- values are smaller than Δ, and PMK(Δ) is the total number of the gene number of the clusters under a given K which have those functional annotated genes assigned to the cor- rect functional category with smaller p-values than Δ. 4. REAL DATASET EXAMPLE 4.1. Dataset We used the yeast cell-cycle data [23] which had listed six known disjoint functional categories containing 104 genes. After we preprocessed and filtered the cell-cycle data, we had 1703 genes left in which 86 genes belong to the six known disjoint functional categories. Missing values of the 1703 genes were imputed by LSimpute method [24] and then the data of 1703 genes were nor- malized. The yeast protein-protein interactions database was downloaded from BrioGRID (http://www.thebiogrid. org/downloads.php). The yeast database has 93122 pro- tein-protein interactions. We neglected the differences between one directional interaction and two directional interactions and discarded any interactions involving protein with itself. Then 50434 protein-protein interactions were left. Among the 50434 protein-protein interactions, only those interactions, whose two interacting genes were both among the 1703 genes, were retained. Finally 3604 protein-protein interactions were obtained. The chip-chip data was downloaded form the website [25]. 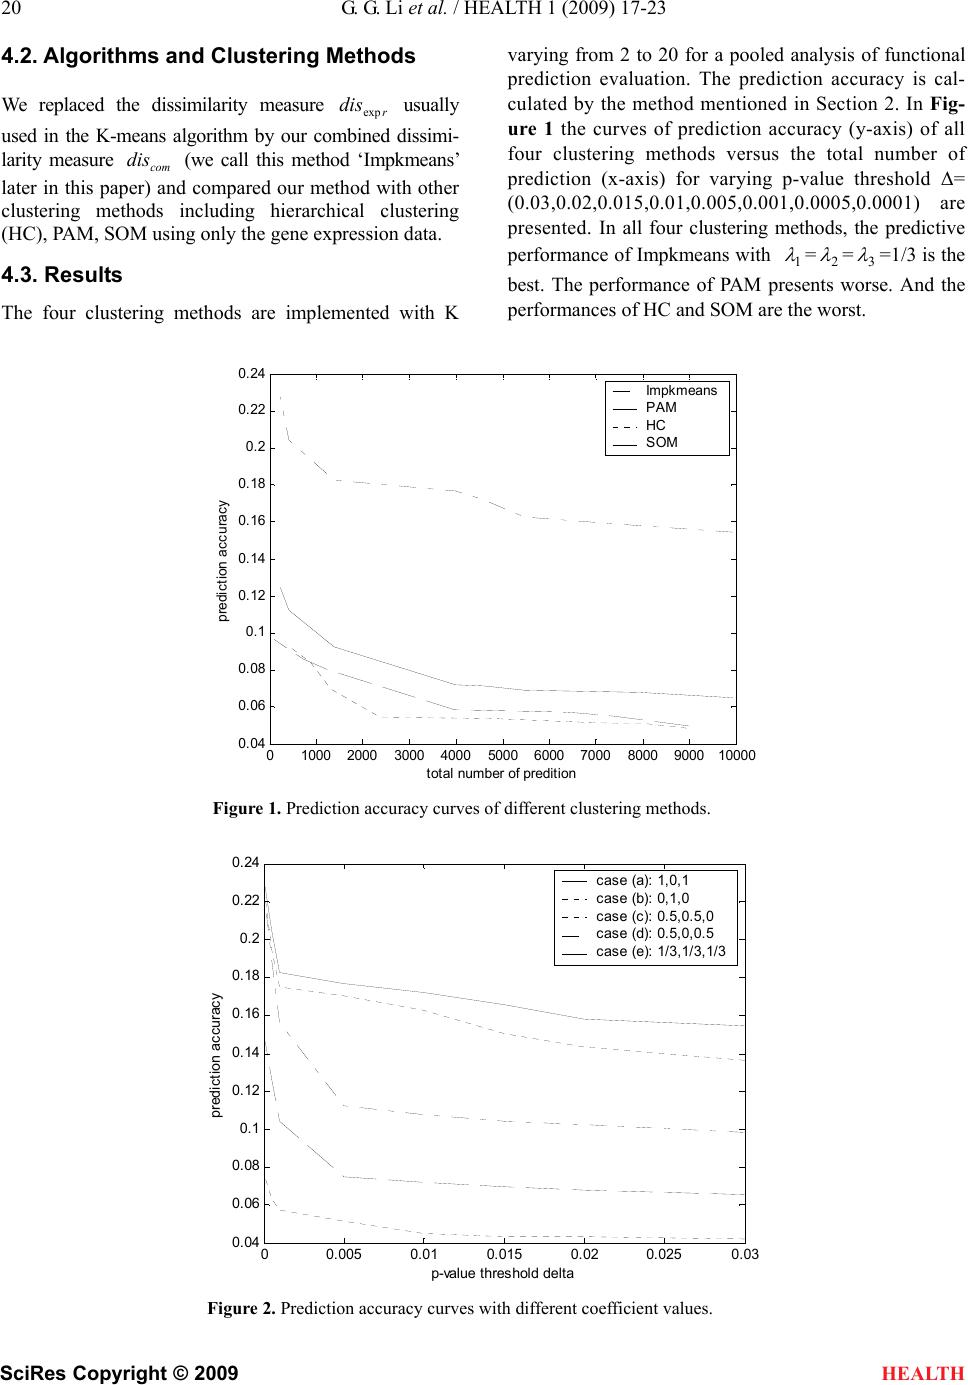 20 G. G. Li et al. / HEALTH 1 (2009) 17-23 SciRes Copyright © 2009 varying from 2 to 20 for a pooled analysis of functional prediction evaluation. The prediction accuracy is cal- culated by the method mentioned in Section 2. In Fig- ure 1 the curves of prediction accuracy (y-axis) of all four clustering methods versus the total number of prediction (x-axis) for varying p-value threshold Δ= (0.03,0.02,0.015,0.01,0.005,0.001,0.0005,0.0001) are presented. In all four clustering methods, the predictive performance of Impkmeans with 1 =2 =3 =1/3 is the best. The performance of PAM presents worse. And the performances of HC and SOM are the worst. 4.2. Algorithms and Clustering Methods We replaced the dissimilarity measure usually used in the K-means algorithm by our combined dissimi- larity measure (we call this method ‘Impkmeans’ later in this paper) and compared our method with other clustering methods including hierarchical clustering (HC), PAM, SOM using only the gene expression data. r disexp com dis 4.3. Results The four clustering methods are implemented with K 01000 2000300040005000 600070008000 900010000 0.04 0.06 0.08 0.1 0.12 0.14 0.16 0.18 0.2 0.22 0.24 total number of predition prediction accuracy Impkmeans PAM HC SOM Figure 1. Prediction accuracy curves of different clustering methods. 00.005 0.01 0.015 0.02 0.025 0.03 0.04 0.06 0.08 0.1 0.12 0.14 0.16 0.18 0.2 0.22 0.24 p-value threshold delta prediction accuracy case (a): 1,0,1 case (b): 0,1,0 case (c): 0.5,0.5,0 case (d): 0.5,0,0.5 case (e): 1/3,1/3,1/3 Figure 2. Prediction accuracy curves with different coefficient values. HEALTH 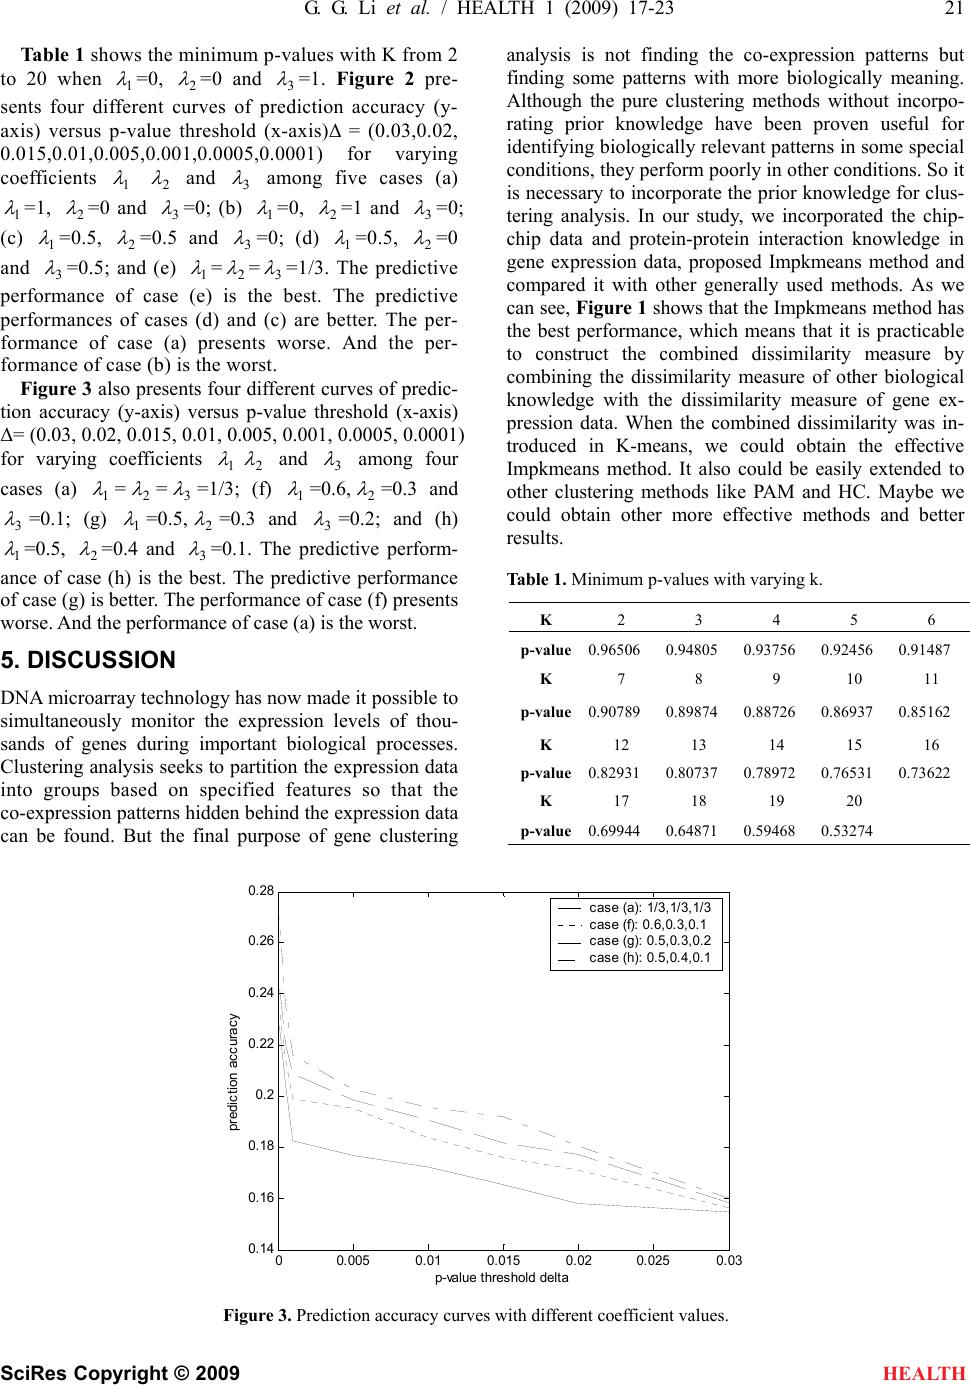 G. G. Li et al. / HEALTH 1 (2009) 17-23 21 SciRes Copyright © 2009 HEALTH Table 1 shows the minimum p-values with K from 2 to 20 when 1 =0, 2 =0 and 3 =1. Figure 2 pre- sents four different curves of prediction accuracy (y- axis) versus p-value threshold (x-axis)Δ = (0.03,0.02, 0.015,0.01,0.005,0.001,0.0005,0.0001) for varying coefficients 1 2 and 3 among five cases (a) 1 =1, 2 =0 and 3 =0; (b) 1 =0, 2 =1 and 3 =0; (c) 1 =0.5, 2 =0.5 and 3 =0; (d) 1 =0.5, 2 =0 and 3 =0.5; and (e) 1 =2 =3 =1/3. The predictive performance of case (e) is the best. The predictive performances of cases (d) and (c) are better. The per- formance of case (a) presents worse. And the per- formance of case (b) is the worst. Figure 3 also presents four different curves of predic- tion accuracy (y-axis) versus p-value threshold (x-axis) Δ= (0.03, 0.02, 0.015, 0.01, 0.005, 0.001, 0.0005, 0.0001) for varying coefficients 1 2 and 3 among four cases (a) 1 =2 =3 =1/3; (f) 1 =0.6, 2 =0.3 and 3 =0.1; (g) 1 =0.5,2 =0.3 and 3 =0.2; and (h) 1 =0.5, 2 =0.4 and 3 =0.1. The predictive perform- ance of case (h) is the best. The predictive performance of case (g) is better. The performance of case (f) presents worse. And the performance of case (a) is the worst. 5. DISCUSSION DNA microarray technology has now made it possible to simultaneously monitor the expression levels of thou- sands of genes during important biological processes. Clustering analysis seeks to partition the expression data into groups based on specified features so that the co-expression patterns hidden behind the expression data can be found. But the final purpose of gene clustering analysis is not finding the co-expression patterns but finding some patterns with more biologically meaning. Although the pure clustering methods without incorpo- rating prior knowledge have been proven useful for identifying biologically relevant patterns in some special conditions, they perform poorly in other conditions. So it is necessary to incorporate the prior knowledge for clus- tering analysis. In our study, we incorporated the chip- chip data and protein-protein interaction knowledge in gene expression data, proposed Impkmeans method and compared it with other generally used methods. As we can see, Figure 1 shows that the Impkmeans method has the best performance, which means that it is practicable to construct the combined dissimilarity measure by combining the dissimilarity measure of other biological knowledge with the dissimilarity measure of gene ex- pression data. When the combined dissimilarity was in- troduced in K-means, we could obtain the effective Impkmeans method. It also could be easily extended to other clustering methods like PAM and HC. Maybe we could obtain other more effective methods and better results. Table 1. Minimum p-values with varying k. K 2 3 4 5 6 p-value 0.96506 0.94805 0.93756 0.92456 0.91487 K 7 8 9 10 11 p-value 0.90789 0.89874 0.88726 0.86937 0.85162 K 12 13 14 15 16 p-value 0.82931 0.80737 0.78972 0.76531 0.73622 K 17 18 19 20 p-value 0.69944 0.64871 0.59468 0.53274 00.005 0.01 0.015 0.02 0.0250.03 0.14 0.16 0.18 0.2 0.22 0.24 0.26 0.28 p-value threshold delta prediction accuracy case (a): 1/3,1/3,1/3 case (f): 0.6,0.3,0.1 case (g): 0.5,0.3,0.2 case (h): 0.5,0.4,0.1 Figure 3. Prediction accuracy curves with different coefficient values. 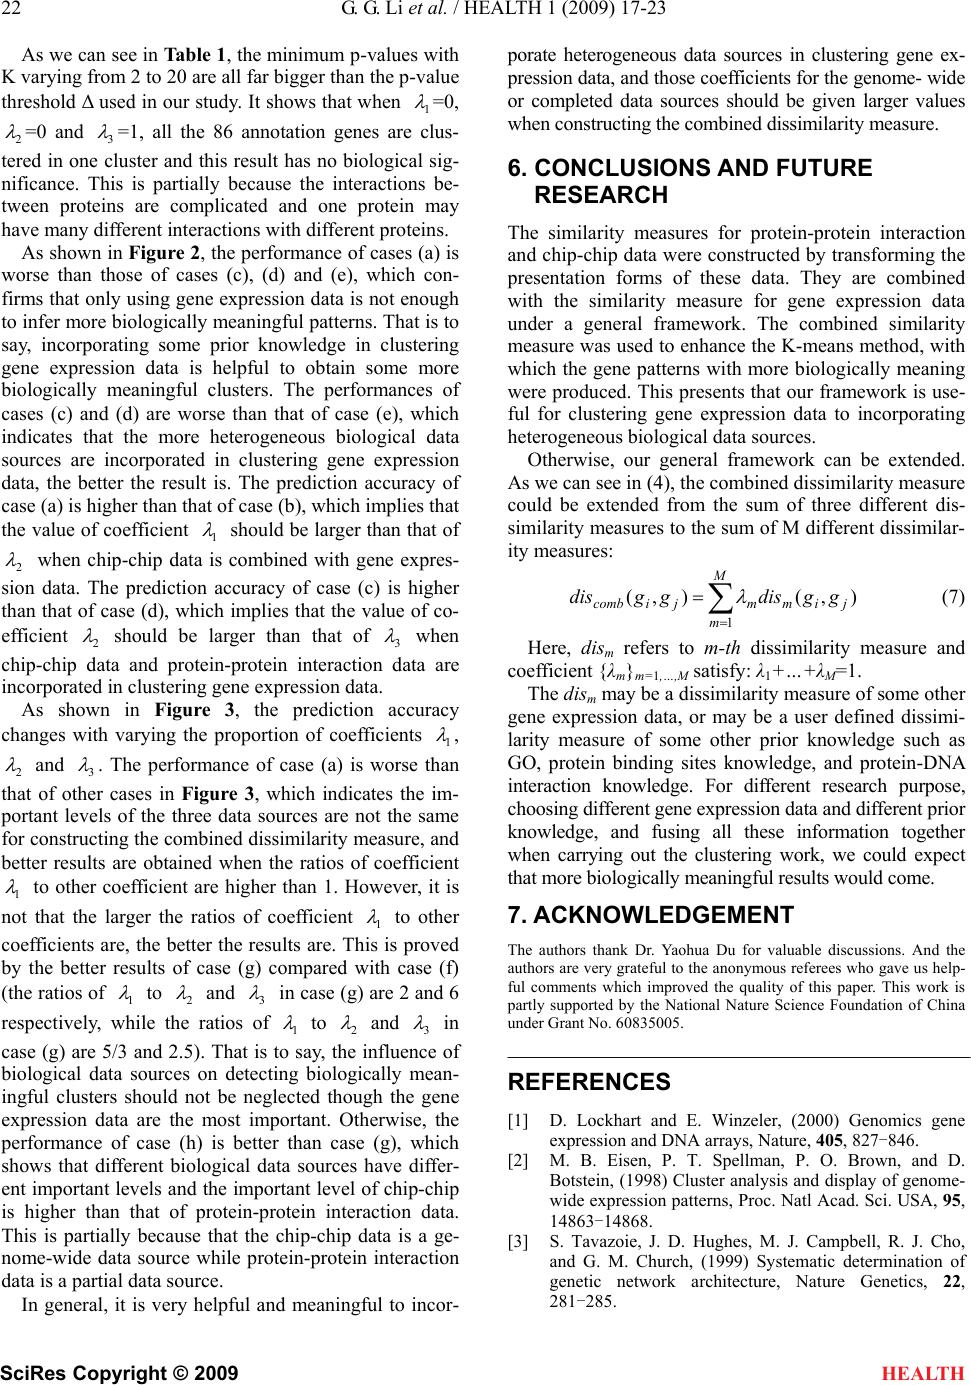 22 G. G. Li et al. / HEALTH 1 (2009) 17-23 SciRes Copyright © 2009 HEALTH As we can see in Table 1, the minimum p-values with K varying from 2 to 20 are all far bigger than the p-value threshold Δ used in our study. It shows that when 1 =0, 2 =0 and 3 =1, all the 86 annotation genes are clus- tered in one cluster and this result has no biological sig- nificance. This is partially because the interactions be- tween proteins are complicated and one protein may have many different interactions with different proteins. As shown in Figure 2, the performance of cases (a) is worse than those of cases (c), (d) and (e), which con- firms that only using gene expression data is not enough to infer more biologically meaningful patterns. That is to say, incorporating some prior knowledge in clustering gene expression data is helpful to obtain some more biologically meaningful clusters. The performances of cases (c) and (d) are worse than that of case (e), which indicates that the more heterogeneous biological data sources are incorporated in clustering gene expression data, the better the result is. The prediction accuracy of case (a) is higher than that of case (b), which implies that the value of coefficient 1 should be larger than that of 2 when chip-chip data is combined with gene expres- sion data. The prediction accuracy of case (c) is higher than that of case (d), which implies that the value of co- efficient 2 should be larger than that of 3 when chip-chip data and protein-protein interaction data are incorporated in clustering gene expression data. As shown in Figure 3, the prediction accuracy changes with varying the proportion of coefficients 1 , 2 and 3 . The performance of case (a) is worse than that of other cases in Figure 3, which indicates the im- portant levels of the three data sources are not the same for constructing the combined dissimilarity measure, and better results are obtained when the ratios of coefficient 1 to other coefficient are higher than 1. However, it is not that the larger the ratios of coefficient 1 to other coefficients are, the better the results are. This is proved by the better results of case (g) compared with case (f) (the ratios of 1 to 2 and 3 in case (g) are 2 and 6 respectively, while the ratios of 1 to 2 and 3 in case (g) are 5/3 and 2.5). That is to say, the influence of biological data sources on detecting biologically mean- ingful clusters should not be neglected though the gene expression data are the most important. Otherwise, the performance of case (h) is better than case (g), which shows that different biological data sources have differ- ent important levels and the important level of chip-chip is higher than that of protein-protein interaction data. This is partially because that the chip-chip data is a ge- nome-wide data source while protein-protein interaction data is a partial data source. In general, it is very helpful and meaningful to incor- porate heterogeneous data sources in clustering gene ex- pression data, and those coefficients for the genome- wide or completed data sources should be given larger values when constructing the combined dissimilarity measure. 6. CONCLUSIONS AND FUTURE RESEARCH The similarity measures for protein-protein interaction and chip-chip data were constructed by transforming the presentation forms of these data. They are combined with the similarity measure for gene expression data under a general framework. The combined similarity measure was used to enhance the K-means method, with which the gene patterns with more biologically meaning were produced. This presents that our framework is use- ful for clustering gene expression data to incorporating heterogeneous biological data sources. Otherwise, our general framework can be extended. As we can see in (4), the combined dissimilarity measure could be extended from the sum of three different dis- similarity measures to the sum of M different dissimilar- ity measures: ),(),( 1 jim M m mjicomb ggdisggdis (7) Here, dism refers to m-th dissimilarity measure and coefficient {λm}m=1,…,M satisfy: λ1+…+λM=1. The dism may be a dissimilarity measure of some other gene expression data, or may be a user defined dissimi- larity measure of some other prior knowledge such as GO, protein binding sites knowledge, and protein-DNA interaction knowledge. For different research purpose, choosing different gene expression data and different prior knowledge, and fusing all these information together when carrying out the clustering work, we could expect that more biologically meaningful results would come. 7. ACKNOWLEDGEMENT The authors thank Dr. Yaohua Du for valuable discussions. And the authors are very grateful to the anonymous referees who gave us help- ful comments which improved the quality of this paper. This work is partly supported by the National Nature Science Foundation of China under Grant No. 60835005. REFERENCES [1] D. Lockhart and E. Winzeler, (2000) Genomics gene expression and DNA arrays, Nature, 405, 827-846. [2] M. B. Eisen, P. T. Spellman, P. O. Brown, and D. Botstein, (1998) Cluster analysis and display of genome- wide expression patterns, Proc. Natl Acad. Sci. USA, 95, 14863-14868. [3] S. Tavazoie, J. D. Hughes, M. J. Campbell, R. J. Cho, and G. M. Church, (1999) Systematic determination of genetic network architecture, Nature Genetics, 22, 281-285.  G. G. Li et al. / HEALTH 1 (2009) 17-23 23 SciRes Copyright © 2009 HEALTH [4] P. Tamayo, D. Slonim, J. Mesirov, Q. Zhu, S. Kitareewan, E. Dmitrovsky, E. S. Lander, and T. R. Golub, (1999) Interpreting patterns of gene expression with self-organizing maps: Methods and application to hematopoietic differentiation, Proc. Natl Acad. Sci. USA, 96, 2907–2912. [5] S. Raychaudhuri, J. M. Stuart, and R. B. Altman, (2000) Principal component analysis to summarize microarray experiments: Application to sporulation time series, Pac. Symp. Biocomput., 455–466. [6] M. P. Brown, W. N. Grundy, D. Lin, N. Cristianini, C. W. Sugnet, T. S. Furey, M. Jr. Ares, and D. Haussler, (2000) Knowledge-based analysis of microarray gene expression data by using support vector machines, Proc. Natl Acad. Sci, 97, 262–267. [7] H. Xia, A. Panaye, and B. T. Fan, (2007) Nonlinear SVM approaches to QSPR/QSAR studies and drug design, Current Computer-Aided Drug Design, 3, 341–352. [8] D. Hanisch, A. Zien, R. Zimmer, and T. Lengauer, (2002) Coclustering of biological networks and gene expression data, Bioinformatics, 18, 145–154. [9] J. Kasturi and R. Acharya, (2005) Clustering of diverse genomic data using information fusion, Bioinformatics, 21, 423–429. [10] K. Rafal and Z. Adam, (2006) Incorporating gene ontology in clustering gene expression data, CBMS’06. [11] L. Kaufman and P. Rousseeuw, (1990) Finding groups in data: An introduction to cluster analysis, Wiley, New York. [12] S. Chris, B. Bobby-Joe , R. Teresa, B. Lorrie, B. Ashton, and T. Mike, (2006) BioGRID: A general repository for interaction datasets, Nucleic Acids Research, Database issue, 34, D535–D539. [13] X. loannis, F. Esteban, S. Lukasz, D. Xiaoqun, T. Michael, M. Edward, and E. David, (2001) DIP: The database of interacing proteins: 2001 update, Nucleic Acids Research, 29, 239–241. [14] C. Alfarano, C. E. Andrade, K. Anthony, N. Bahroos, M. Bajec, K. Bantoft, D. Betel, B. Bobechko, K. Boutilier, and E. Burgess, (2005) The biomolecular interaction network database and related tools: 2005 update, Nucleic Acids Res., 33, D418–D424. [15] A. Zanzoni, L. Montecchi-Palazzi, M. Quondam, G. Ausiello, M. Helmer-Citterich, and G. Cesareni, (2002) MINT: A molecular INTeraction database, FEBS Lett., 513, 135–140. [16] H. W. Mewes, C. Amid, R. Arnold, D. Frishman, V. Guldener, G. Mannhaupt, M. Munsterkotter, P. Pagel, N. Strack, and V. Stumpflen, (2004) MIPS: Analysis and annotation of proteins from whole genomes, Nucleic Acids Res, 32, 41–44. [17] C. T. Harbison, D. B. Gordon, T. I. Lee, N. J. Rinaldi, K. D. Macisaac, T. W. Danford, N. M. Hannett, J. B. Tagne, D. B. Reynolds, J. Yoo, et al., (2004) Transcriptional regulatory code of a eukaryotic genome, Nature, 431, 99–104. [18] T. I. Lee, N. J. Rinaldi, F. Robert, D. T. Odom, Z. Bar-Joseph, G. K. Gerber, N. M. Hannett, C. T. Harbison, C. M. Thompson, I. Simon, et al., (2002) Tanscriptional regulatory networks in Saccharomyces cerevisiae, Science, 298, 799–804. [19] S. Tavazoie, J. D. Hughes, M. J. Campbell, R. J. Cho, and G. M. Church, (1999) Systematic determination of genetic network architecture, Nature Genetics, 22, 281–285. [20] J. Handl, J. Knowles, and D. Kell, (2005) Computational cluster validation in post-genomic data analysis, Bioinformatics, 21, 3201–3212. [21] N. Bolshakova, F. Azuje, and P. Cunningham, (2005) A knowledge-driven approach to cluster validity assessment, Bioinformatics, 21, 2546–2547. [22] A. Thalamuthu, M. Indranil, X. J. Zeng, and G. C. Tseng, (2006) Evaluation and comparison of gene clustering methods in microarray analysis, Bioinformatics, 22, 2405–2412. [23] P. T. Spellman, G. Sherlock, M. Q. Zhang, V. R. Iyer, K. Anders, M. B. Eisen, P. O. Brown, D. Botstein, and B. Futcher, (1998) Comprehensive identification of cell cycle-regulated genes of the yeast Saccharomyces cerevisiae by microarray hybridization, Mol. Biol. Cell, 9, 3273–3297. [24] B. Trond, D. Bjarte, and J. Inge, (2004) LSimpute: accurate estimation of missing values in microarray data with least squares methods, Nucleic Acids Research, 32(3). [25] Young Lab, http://web.wi.mit.edu/young/regulatory_ code.
|