Circuits and Systems
Vol.07 No.09(2016), Article ID:69177,10 pages
10.4236/cs.2016.79225
Critical Evaluation of Linear Dimensionality Reduction Techniques for Cardiac Arrhythmia Classification
Rekha Rajagopal, Vidhyapriya Ranganathan
Department of Information Technology, PSG College of Technology, Coimbatore, India

Copyright © 2016 by authors and Scientific Research Publishing Inc.
This work is licensed under the Creative Commons Attribution International License (CC BY).
http://creativecommons.org/licenses/by/4.0/


Received 7 April 2016; accepted 25 April 2016; published 28 July 2016
ABSTRACT
Embedding the original high dimensional data in a low dimensional space helps to overcome the curse of dimensionality and removes noise. The aim of this work is to evaluate the performance of three different linear dimensionality reduction techniques (DR) techniques namely principal component analysis (PCA), multi dimensional scaling (MDS) and linear discriminant analysis (LDA) on classification of cardiac arrhythmias using probabilistic neural network classifier (PNN). The design phase of classification model comprises of the following stages: preprocessing of the cardiac signal by eliminating detail coefficients that contain noise, feature extraction through daubechies wavelet transform, dimensionality reduction through linear DR techniques specified, and arrhythmia classification using PNN. Linear dimensionality reduction techniques have simple geometric representations and simple computational properties. Entire MIT-BIH arrhythmia database is used for experimentation. The experimental results demonstrates that combination of PNN classifier (spread parameter, σ = 0.08) and PCA DR technique exhibits highest sensitivity and F score of 78.84% and 78.82% respectively with a minimum of 8 dimensions.
Keywords:
Data Preprocessing, Decision Support Systems, Feature Extraction, Dimensionality Reduction

1. Introduction
Electrocardiogram (ECG) is the most commonly used tool for analysis in the field of cardiology. Recording ECG for a longer duration of time is simple whereas analyzing it every beat is a tedious process. ECG is a non-stationary signal which means whenever the heart rate is abnormal, the wave form shows irregularities. But the irregularities are non-periodic in nature and hence manual observation takes a longer time. Hence, there is a need to develop automation strategies for the identification of cardiac abnormalities and manage sudden cardiac death [1] .
Abnormality in the normal rhythm of heartbeat causes arrhythmia. Heart beats can be classified to five classes namely class N (beats originating in the sinus node), class S (Supra ventricular ectopic beats), class V (Ventricular ectopic beats), class F (Fusion beats) and class Q (unknown beats including paced beats). The important requirements of an automated system are reduced complexity, fast decision making and less memory. This can be accomplished with the usage of dimensionality reduction techniques. Dimensionality reduction is the mapping of data in higher dimensional space to meaningful representation in lower dimensional space such that dimensionality of data is reduced to manageable size. Dimensionality reduction is very important in a classification system in order to mitigate the curse of dimensionality, computational complexity and memory requirement. Curse of dimensionality means that for a given sample size, there is a maximum number of features above which the performance of a classifier gets degraded. The objective of this work is to evaluate the performance of three different linear dimensionality reduction techniques in classification of ECG arrhythmias.
In general, the algorithm used for automated classification includes (1) preprocessing, (2) feature extraction, (3) dimensionality reduction and (4) classification. The preprocessing of recorded ECG signals is done in order to eliminate the important noises that degrade the classifier performance, such as baseline wandering, motion artifact, power line interference and high frequency noise. Currently, researchers use many filtering techniques like morphological filtering [2] , integral coefficient band stop filtering [3] , finite impulse response filtering [4] , 5 - 20 Hz band pass filtering [5] [6] , median filtering [7] and wavelet based denoising [7] - [9] for preprocessing. Commonly extracted ECG features include (a) Temporal features, (b) Amplitude based features, (c) Wavelet transform based features, (d) Stockwell transform based features.
Dimensionality reduction is applied in order to remove redundancy and extract useful information from captured features. The important advantages of linear technique are its simple geometric interpretations and attractive computational properties. Non linear dimensionality reduction techniques perform poorly compared to linear techniques on some natural data sets [10] [11] . Some of the commonly used non linear techniques are Kernel PCA, locally linear embedding, diffusion map and sammon mapping.
Support vector machine (SVM) [5] [12] - [18] , probabilistic neural network (PNN) [9] [15] [19] [20] , back propagation neural network [21] , multilayer perceptron neural network (MLPNN) [6] [15] [22] , linear discriminant classifier [7] [23] [24] , mixture of experts [15] and unsupervised clustering [25] [26] are commonly used by researchers for classification of ECG arrhythmia. The parameters like accuracy, sensitivity and specificity are used in literature for evaluating the performance of a classifier. This work concentrates on evaluating the performance of automated classification system when DR techniques such as principal component analysis (PCA), multi dimensional scaling (MDS) and linear discriminant analysis (LDA) are used. The next section discusses the materials and methods used in this work.
2. Materials and Method
The MIT_BIH arrhythmia database [6] is used in this work. It contains 48 half-hour excerpts of two channel ambulatory ECG recordings, obtained from 47 subjects studied by the BIH arrhythmia laboratory. The recordings were digitized at 360 samples per second per channel with 11 bit resolution over 10 mV range. The reference annotations for each beat were included in the database. Four records containing paced beats (102, 104, 107 and 217) were removed from analysis as specified by AAMI. The total number of heart beats in each class is given in Table 1.
Figure 1 shows the architecture of the proposed work. The entire experiments are carried out using Matlab R2014a. The details of the methodology carried out are summarized below.
2.1. Data Preprocessing
The records contain continuous ECG recording for duration of 30 minutes. The raw ECG signals include

Table 1. Number of heartbeats in each class.

Figure 1. Architecture of the proposed work.
base-line wander, motion artifact and power line interference noise. The discrete wavelet transform (DWT) is used for denoising the ECG signal and also for extracting the important features [18] [27] [28] from original ECG signal. DWT captures both temporal and frequency information. The DWT of the original ECG signal is computed by successive high pass and low pass filtering of that signal. This can be mathematically represented in the following equations,
 (1)
(1)
 (2)
(2)
where, x [n] is the original ECG signal samples, g and h are the impulse response of high pass and low pass fil- ters respectively, and ,
,  are the outputs of high pass and low pass filters after sub sampling by 2. This procedure is repeated until the required decomposition level is reached. The low frequency component is called approximation and high frequency component is called detail.
In this work, the raw ECG signals are decomposed into approximation and detail sub bands up to level 9 using Daubechies (“db6”) wavelet basis function [29] . The detail coefficients contain most of the noise information. Hence, soft thresholding is applied to the detail coefficient at each level. Denoised ECG signal is computed based on the original approximation coefficient at 9th level and modified detail coefficient of levels from 1 to 9. After denoising, the continuous ECG waveform is segmented into individual heartbeats. This segmentation is done by identifying the R peaks using Pan Tompkins algorithm [11] and by considering 99 samples before R peak and 100 samples after R Peak. This choice of 200 samples, including R peak for segmentation is taken be-cause it constitutes one cardiac activity with P, QRS and T waves. Figure 2 shows a segment of the recorded ECG waveform of patient identifier: 100 after preprocessing.
2.2. Feature Extraction
The database with 44 records (97,890 heartbeats) is divided into ten sets each containing 9789 heartbeats. Nine sets are used for training (88,101 heartbeats) and one set for testing (9789 heartbeats). From each heartbeat, wavelet based features are extracted by using daubechies wavelet (“db4”). Daubechies wavelet with level 4 decomposition is selected in this work after making performance comparisons with discrete meyer wavelet and other levels of daubechies wavelet including “db2”, “db6”. A total of 107 features are produced by the 4th level approximation subband and another 107 features by the 4th level detail subband.
2.3. Dimensionality Reduction
Wavelet based features are obtained as a result of db4 wavelet transform. In order to extract useful information from the features and to remove redundancy the following dimensionality reduction techniques are applied. Linear mapping of high dimensional data to low dimensional data is done by this technique. The important advantages of linear technique are its simple geometric interpretations and attractive computational properties [11] .
2.3.1. Principal Component Analysis (PCA)
PCA that maximizes the amount of variance in the data is used in this work. The steps followed for dimensionality reduction of data matrix X consisting of n ECG samples xi ( ) with D features from each sample are given below,
1. Subtraction of the mean
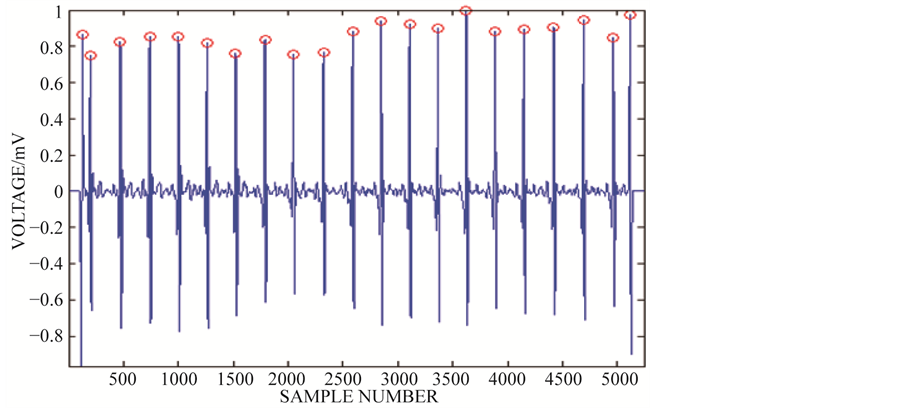
Figure 2. Segment of continuous ECG waveform after preprocessing.
This step produces a data set whose mean ( ) is zero.
2. Calculation of covariance matrix C

3. Calculation of eigenvectors V and eigen values E

4. Sorting of eigen vectors
Eigen vector with highest eigen value is the principal component of the data. Eigen vectors are ordered by eigen value, highest to lowest.
5. Projection of data
Projected data = 
Arrhythmia classification is done by varying the selection of components from 1 to 10 in the projected data and the results are analyzed.
Arrhythmia classification is done by varying the selection of components from 1 to 10 in the projected data and the results are analyzed.
2.3.2. Multi Dimensional Scaling (MDS)
MDS produce a geometric map of data matrix X with “n” ECG samples to Euclidean space with “n” samples. The steps followed for dimensionality reduction are given as follows,
1. Assign samples to arbitrary coordinates in p-dimensional space.
2. Compute Euclidean distances dij among all pairs of samples across all dimensions, to form the Dhat matrix.
3. Compare the input matrix X with the Dhat matrix by evaluating the stress function.
4. Adjust the coordinates of each sample in the direction that achieves maximal stress.
5. Repeat steps 2 to 4 till stress value won’t get any lower.
Based on significant eigen values, low dimensional mapping is obtained.
2.3.3. Linear Discriminant Analysis (LDA)
LDA technique provides highest possible discrimination between ECG classes so that samples can be classified accurately. The steps followed are shown as follows,
1. Calculate the within class covariance matrix and is computed by,

where,  and “K” is the total number of arrhythmia classes, Nk is the total number samples in arrhythmia class Ck and xn is the DWT coefficient vector of nth sample in class Ck.
2. Calculate the between class covariance matrix and is computed by,
 , where,
3. The total covariance matrix is obtained by,

4. The projection matrix is computed as,

5. The LDA coefficients are obtained as, 
Arrhythmia classification is done by varying the selection of LDA components from 1 to 10 columns in “y” and the results are analyzed (Table 2).
Table 2. Properties of DR techniques.
D: Dimensionality of input sample; d: Number of top eigen values; n: Number of data points; t: min (D, d).
2.4. Probabilistic Neural Network Classifier
Probabilistic neural network (PNN) is used for classification of ECG beats. It is a feed forward network with input, hidden, summation and output layer. When an input is given, the hidden layer computes the distances from the inputs and training input vectors to produce a vector whose elements indicate how close the input is to a training input. Summation layer sums these contributions for each class of inputs to produce as its net output a vector of probabilities. Output layer picks the maximum of these probabilities, and produces a 1 for that class and a 0 for the other classes. Radial basis function (RBF) is used as the transfer function. PNN is trained with 88101 ECG beat samples which includes training examples from all five classes. Training and testing matrix is computed such that each row represents an ECG heartbeat and features occupy columns.
The performance of the arrhythmia classifier system is evaluated using performance metrics such as accuracy, sensitivity, specificity, false positive rate and F score. These metrics are computed by calculating TP (True Positive), TN (True Negative), FP (False Positive) and FN (False Negative) count and are defined as follows: Sensitivity = TP/(TP + FN), Specificity = TN/(TN + FP), False positive rate = (FP/(TN + FP)*100, F score = 2TP/(2TP + FP + FN) and Accuracy = (TP + TN)/(TP + FP + FN + TN). The process is repeated ten times such that each set is used once for testing. The overall performance of the classifier is computed by taking the average of all ten folds.
3. Results and Discussions
The goodness of a classifier in accurately classifying the test heartbeat class is measured mainly by the sensitivity and F score. The reason for not considering accuracy is that even a poor classifier can show good accuracy in favoring class with more training examples. Figure 3 shows the results of average accuracy of PNN classifier for different DR techniques and dimensions taken from 10 fold cross validation. The result shows that PCA is able to get highest accuracy of 99.41% even with eight dimensions. Sensitivity is an important classification parameter which indicates the number of correctly identified arrhythmias from patients. Figure 4 shows the results of average sensitivity of PNN classifier for different DR techniques and dimensions taken from 10 fold cross validation. Experimental results show that PCA with eight dimensions is able to achieve 78.84% sensitivity with only 8 dimensions. LDA is able to produce only a sensitivity of 55.27% even when 10 dimensions are used. Specificity indicates the true negative rate and is shown in Figure 5. The result shows that PCA is able to get highest specificity of 99.49% with ten dimensions. Average false positive rate for different DR techniques and dimensions taken from 10 fold cross validation is shown in Figure 6. PCA produces the least false positive rate of 0.5% with ten dimensions. F score is an important parameter that combines both precision and recall. The average F score result for various DR techniques and different dimensions are shown in Figure 7. Results show that PCA gives highest F-score of 78.82% with 8 dimensions itself. Figures 8-10 show the variation of average F-score with respect to different spread values during PNN classification using various dimensionality reduction techniques. PNN with PCA coefficients yielded highest F-score of 78.82% at spread value 0.08. PNN with MDS coefficients yielded highest F-score of 73.79% at spread value 0.08. PNN with LDA coefficients yielded highest F-score of 51.73% at spread value 0.05. Time taken for dimensionality reduction by various DR techniques is shown in Table 3.
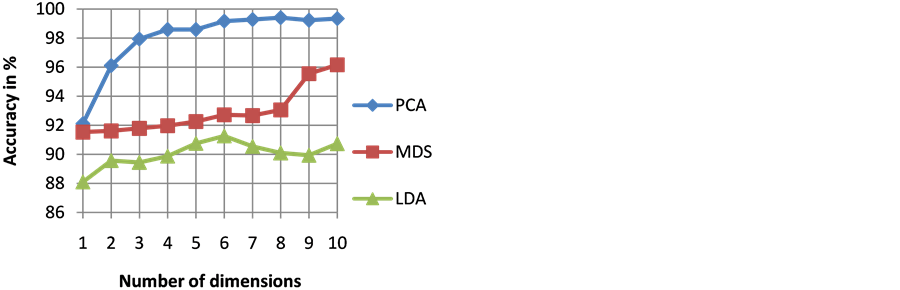
Figure 3. Results of average accuracy of PNN classifier for different DR techniques and dimensions.
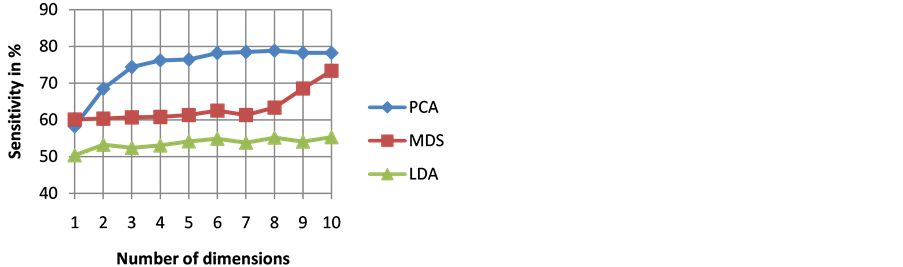
Figure 4. Results of average sensitivity of PNN classifier for different DR techniques and dimensions.
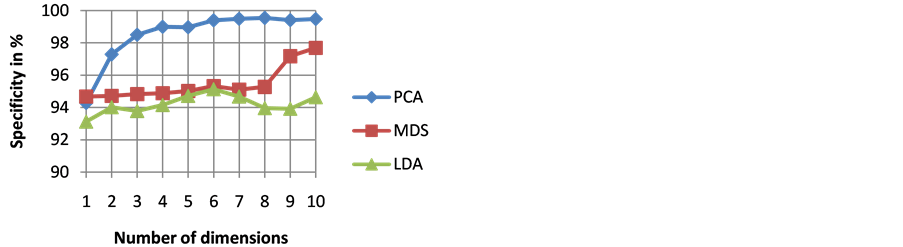
Figure 5. Results of average specificity of PNN classifier for different DR techniques and dimensions.
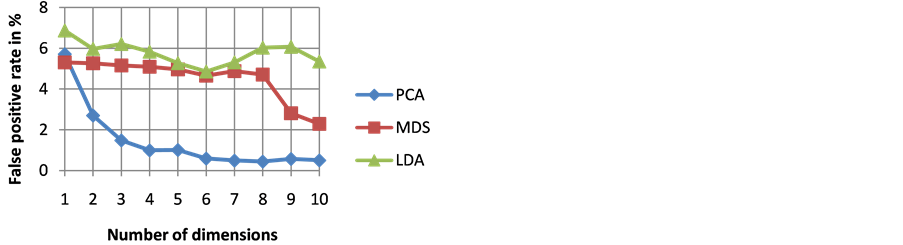
Figure 6. Results of average false positive rate of PNN classifier for different DR techniques and dimensions.
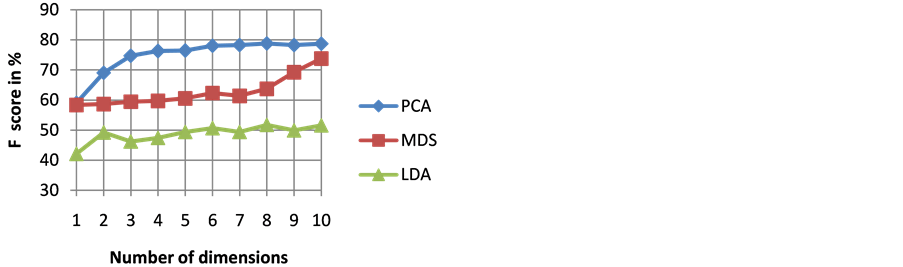
Figure 7. Results of average F score of PNN classifier for different DR techniques and dimensions.

Figure 8. Variation of average F score with respect to different spread values during PNN classification using PCA coefficients.

Figure 9. Variation of average F score with respect to different spread values during PNN classification using MDS coefficients.
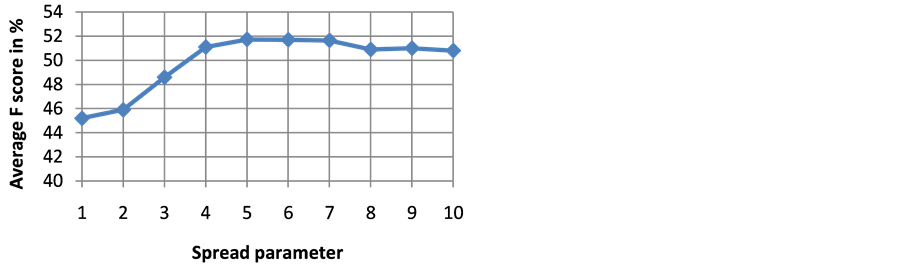
Figure 10. Variation of average F score with respect to different spread values during PNN classification using LDA coefficients.
Table 3. Computation time required by various DR techniques for the input ECG data samples.
4. Conclusion
Classification of cardiac arrhythmias into five different classes as per AAMI standard is performed. Classifier performance is evaluated by using various linear dimensionality reduction techniques with different dimensions of data representations. Experimental results revealed that conventional linear DR technique like PCA is easy to apply but is not able to capture important information required for class discrimination from very lower dimensional data representation. Hence, nonlinear DR techniques can be applied to capture significant information from lower dimensional representation itself. At the same time, nonlinear techniques face the important drawback of tuning the parameters. Time required for computation is also high compared to linear DR techniques. MDS and LDA require comparatively more time for low dimensional mapping than PCA. PCA in combination with PNN classifier provides the highest sensitivity and F score with reduced computation time.
Cite this paper
Rekha Rajagopal,Vidhyapriya Ranganathan, (2016) Critical Evaluation of Linear Dimensionality Reduction Techniques for Cardiac Arrhythmia Classification. Circuits and Systems,07,2603-2612. doi: 10.4236/cs.2016.79225
References
- 1. Mehra, R. (2007) Global Public Health Problem of Sudden Cardiac Death. Journal of Electrocardiology, 49, 118-122.
http://dx.doi.org/10.1016/j.jelectrocard.2007.06.023 - 2. Kim, J., Shin, H.S., Shin, K. and Lee, M. (2009) Robust Algorithm for Arrhythmia Classification in ECG Using Extreme Learning Machine. BioMedical Engineering OnLine, 8, 31.
http://dx.doi.org/10.1186/1475-925X-8-31 - 3. Liang, W., Zhang, Y., Tan, J. and Li, Y. (2014) A Novel Approach to ECG Classification Based upon Two-Layered HMMs in Body Sensor Networks. Sensors, 14, 5994-6011.
http://dx.doi.org/10.3390/s140405994 - 4. Kim, H., Yazicioglu, R.F., Merken, P., Van Hoof, C. and Yoo, H.J. (2010) ECG Signal Compression and Classification Algorithm with Quad Level Vector for ECG Holter System. IEEE Transactions on Information Technology in Biomedicine, 14, 93-100.
- 5. Asl, B.M., Setarehdan, S.K. and Mohebbi, M. (2008) Support Vector Machine-Based Arrhythmia Classification Using Reduced Features of Heart Rate Variability Signal. Artificial Intelligence in Medicine, 44, 51-64.
http://dx.doi.org/10.1016/j.artmed.2008.04.007 - 6. Wiensand, J. and Guttag, J.V. (2010) Patient Adaptive Ectopic Beat Classification Using Active Learning. Computers in Cardiology, 37, 109-112.
- 7. Moody, G.B. and Mark, R.G. (2001) The Impact of the MIT-BIH Arrhythmia Database. IEEE Engineering in Medicine and Biology, 20, 45-50.
http://dx.doi.org/10.1109/51.932724 - 8. Oresko, J.J., Jin, Z., Huang, S., Sun, Y., Duschl, H. and Cheng, A.C. (2010) A Wearable Smart Phone Based Platform for Real Time Cardiovascular Disease Detection via Electrocardiogram Processing. IEEE Transactions on Information Technology in Biomedicine, 14, 734-740.
http://dx.doi.org/10.1109/TITB.2010.2047865 - 9. Martis, R.J., Rajendra Acharya, U. and Lim, C.M. (2013) ECG Beat Classification Using PCA, LDA, ICA and Discrete Wavelet Transform. Biomedical Signal Processing and Control, 8, 437-448.
http://dx.doi.org/10.1016/j.bspc.2013.01.005 - 10. van der Maaten, L. and Postma, E. (2009) Dimensionality Reduction: A Comparative Review. TiCC, Tilburg University, Tilburg.
- 11. Das, M.K. and Ari, S. (2014) Electrocardiogram Beat Classification Using S-Transform Based Feature Set. Journal of Mechanics in Medicine and Biology, 14, Article ID: 1450066.
http://dx.doi.org/10.1142/s0219519414500663 - 12. Daamouche, A., Hamami, L., Alajlan, N. and Melgani, F. (2012) A Wavelet Optimization Approach for ECG Signal Classification. Biomedical Signal Processing and Control, 7, 342-349.
http://dx.doi.org/10.1016/j.bspc.2011.07.001 - 13. Ubeyli, E.D. (2008) Usage of Eigen Vector Methods in Implementation of Automated Diagnostic Systems for ECG Beats. Digit Signal Process, 18, 33-48.
http://dx.doi.org/10.1016/j.dsp.2007.05.005 - 14. Melgani, F. and Bazi, Y. (2008) Classification of Electrocardiogram Signals with Support Vector Machines and Particle Swarm Optimization. IEEE Transactions on Information Technology in Biomedicine, 12, 667-677.
http://dx.doi.org/10.1109/TITB.2008.923147 - 15. Ye, C., Vijayakumar, B.V.K. and Coimbra, M.T. (2012) Heartbeat Classification Using Morphological and Dynamic Features of ECG Signals. IEEE Transactions on Biomedical Engineering, 59, 2930-2941.
http://dx.doi.org/10.1109/TBME.2012.2213253 - 16. Song, M.H., Lee, J., Cho, S.P., Lee, K.J. and Yoo, S.K. (2005) Support Vector Machine Based Arrhythmia Classification Using Reduced Features. International Journal of Control, Automation, and Systems, 3, 571-579.
- 17. Singh, B.N and Tiwari, A.K. (2006) Optimal Selection of Wavelet Basis Function Applied to ECG Signal Denoising. Digital Signal Processing, 16, 275-287. http://dx.doi.org/10.1016/j.dsp.2005.12.003
- 18. Sufi, F., Khalil, I. and Mahmood, A.N. (2011) A Clustering Based System for Instant Detection of Cardiac Abnormalities from Compressed ECG. Expert Systems with Applications, 38, 4705-4713.
http://dx.doi.org/10.1016/j.eswa.2010.08.149 - 19. Zhu, B., Ding, Y. and Hao, K. (2013) A Novel Automatic Detection for ECG Arrhythmias Using Maximum Margin Clustering with Immune Evolutionary Algorithm. Computational and Mathematical Methods in Medicine, 2013, Article ID: 453402.
http://dx.doi.org/10.1155/2013/453402 - 20. Pan, J. and Tompkins, J.W. (1985) A Real Time QRS Detection Algorithm. IEEE Transactions on Biomedical Engineering, 32, 230-236.
http://dx.doi.org/10.1109/TBME.1985.325532 - 21. Yu, S.N. (2006) Combining Independent Component Analysis and Back Propagation Neural Network for ECG Beat Classification. Proceeding of Engineering in Medicine and Biology Society (EMBC), New York, 3090-3093.
- 22. Zidelmal, Z., Amirou, A., Ould-Abdeslamand, D. and Merckle, J. (2013) ECG Beat Classification Using a Cost Sensitive Classifier. Computer Methods and Programs in Biomedicine, 111, 570-577.
http://dx.doi.org/10.1016/j.cmpb.2013.05.011 - 23. Huang, K. and Zhang, L.Q. (2014) Cardiology Knowledge Free ECG Feature Extraction Using Generalized Tensor Rank One Discriminant Analysis. EURASIP Journal on Advances in Signal Processing, 2014, 2.
http://dx.doi.org/10.1186/1687-6180-2014-2 - 24. Chazal, P., Dwyer, M.O. and Reilly, R.B. (2004) Automatic Classification of Heartbeats Using ECG Morphology and Heartbeat Interval Features. IEEE Transactions on Biomedical Engineering, 51, 1196-1206.
- 25. Ghoraani, B. and Krishnan, S. (2012) Discriminant Non-Stationary Signal Features Clustering Using Hard and Fuzzy Cluster Labeling. EURASIP Journal on Advances in Signal Processing, 2012, 250.
http://dx.doi.org/10.1186/1687-6180-2012-250 - 26. Rai, H.M., Trivedi, A. and Shukla, S. (2013) ECG Signal Processing for Abnormalities Detection Using Multi-Resolution Wavelet Transform and Artificial Neural Network Classifier. Measurement, 46, 3238-3246.
http://dx.doi.org/10.1016/j.measurement.2013.05.021 - 27. Mazomenos, E.B., Biswas, D., Acharyya, A., Chen, T., et al. (2013) A Low-Complexity ECG Feature Extraction Algorithm for Mobile Healthcare Applications. IEEE Journal of Biomedical and Health Informatics, 17, 459-569.
http://dx.doi.org/10.1109/TITB.2012.2231312 - 28. Li, D., Pedrycz, W. and Pizzi, N.J. (2005) Fuzzy Wavelet Packet Based Feature Extraction Method and Its Application to Biomedical Signal Classification. IEEE Transactions on Biomedical Engineering, 52, 1132-1139.
http://dx.doi.org/10.1109/TBME.2005.848377 - 29. Das, M.K. and Ari, S. (2014) ECG Beats Classification Using Mixture of Features. International Scholarly Research Notices, 2014, Article ID: 178436.
http://dx.doi.org/10.1155/2014/178436