 Journal of Geoscience and Environment Protection, 2014, 2, 60-67 Published Online April 2014 in SciRes. http://www.scirp.org/journal/gep http://dx.doi.org/10.4236/gep.2014.22010 How to cite this paper: Gaber, M. M. et al. (2014). Effect of Partially Replacing Corn Meal by Wet Date on Growth Perfor- mance in Nile Tilapia (Oreochromis niloticus) Fingerlings, Diets Supplemented with Digestarom®. Journal of Geoscience and Environment Protection, 2, 60-67. http://dx.doi.org/10.4236/gep.2014.22010 Effect of Partially Replacing Corn Meal by Wet Date on Growth Performance in Nile Tilapia (Oreochromis niloticus) Fingerlings, Diets Supplemented with Digestarom® M. M. Gaber1*, E. H. Labib2, E. A. Omar2, M. A. Zaki3, A. M. Nour3 1National Institute of Oceanography and Fisheries, Cairo, Egypt 2Departments of Animal and Fish Production, Faculty of Agriculture, Alexandria University, Saba Basha, Egypt 3Departments of Animal and Fish Production, Faculty of Agriculture, Alexandria University, El Shatby, Egypt Email: gabermagdy@yahoo.com Received January 2014 Abstract A 3-month randomized factorial design 4 × 2 (four levels 0, 15, 30, and 45%) of wet Date (WD), two levels (0 and 0.03%) of Digestarom® (D) and three replicates. The trial was conducted in twenty four glass aquaria. Ten fingerlings of Nile tilapia were placed in each aquarium with an av- erage weight 15.40±0.3 g fish. Fish were fed twice daily (six days a week) at a rate of 3% of body weight. The results revealed that, mean final weight (g/fish), SGR (%/day), feed conversion ratio, PPV and PER, were significantly (p ≤ 0.05) affected by the levels of WD and level of D. And the best diet achieved which containing 30% WD supplemented with 0.03% D. From the above results and the economic information of these studies it can be concluded that, diet containing 30% of WD with 0.03% D exhibited the highest net profit and would seem to be the most desirable level of WD and D in the system studied. Keywords Nile Tilapia; Wet Date; Digestarom® 1. Introduction Annual production of wet date in Egypt about 1.1 million tons representing 16% of total world production (FAO, 2004) and approximately 10-15% of this amount represents the total possible crop of wet date (110000-165000 tons annually). However, this amount was not all available, only those from manufactured date can be collected. Wet dates are easy to grind in an ordinary hammer mill (EL-Shazly et al., 1963). Therefore, they are first dried and powdered with grain grinder stone mill. Yousif, et al. (1996) reported that, the inclusion of the Wet date did not influence fish growth. Increasing body protein and decreasing body fat was observed of fish fed on diets *  M. M. Gaber et al. supplemented with date pits meal due to estrogenic action of date pits was hypothesized as direct cause of this phenomenon. Azaza et al. (2008) noted that, waste date meal could be substitute soybean meal up to 300 gkg−1 without compromising growth of Nile tilapia. On the other hand El-Sayed et al. (2006) found that date pits based diets replaced up to 75% wheat bran resulted in reduced growth rates and feed utilization efficiency of Nile tila- pia. And reported that, fungi degraded pits (DDP) could replace 300/kg dietary corn. While, Belal (2008) found that, growth performance of Nile tilapia fed sprouted date pits diets not differ from control diet. This study was carried out to determine the feasibility of using wet date as energy source for replacement corn meal in practical diets supplemented with 0.03% Digestarom® on Nile tilapia fingerlings. 2. Material and Methods 2.1. Experimental Diets The wet dates were collected from waste date. The wet date were dried in oven dried at 60˚C - 80˚C for 72 hr, then crushed in disc crusher and then powdered with grain grinding stone mill. The other materials were finely ground in a house blender and used in the formulation of eight experimental diets isonitrogenous (303 gkg−1) and isocaloric (18.4 kjg−1). The experiment was designed in a factorial design (4 × 2). Eight tested diets were formulated to contain 0, 15, 30, and 45% wet date instead of Yellow Corn meal, without or with 0.03 Digesta- rom® as described in Table 1. Each ingredient was thoroughly mixed with the other ingredients, vitamins, minerals mix and 0.03% Digesta- rom® was then added to the diet 5-8 with continuous mixing. (Digestarom® (D) is a dried combination of natural attracting spices that stimulate digestibility). A few drops of soybean oil was added at the same time of mixing warm distilled water (45˚C) which was slowly added until the diets began to clump. Diets were processed by a mincer with die into 3 mm diameter, spaghetti-like strands, sun-dried and stored in air tight containers. The ex- perimental fish were fed the test diets for a one week as adaptation period to adapt them to these test diets. After the adaptation period was completed, fish in each aquarium were reweighed, and their initial weights were rec- orded. Fish in each aquarium were fed twice daily (six days a week) at a rate of 3% of body weight for 90 days. The experimental work of the present study was carried out at the Department of Animal and Fish Production, Faculty of Agriculture (El-Shatby); Alexandria University, Egypt. 2.2. Culture Condition Nile tilapia (Oreochromis niloticus) fingerlings obtained from Berseek Fish Hatchery, El-Behera Governorate were used in the present study. Fish were placed randomly in twenty four glass aquaria with dimensions of 100 × 40 × 30 cm and 100 l capacity of water per aquarium, three replicates per treatment were used in this study. Each aquarium stocked with ten fingerlings of Nile tilapia with an average initial body weight of 15.40±0.3 g fish. Each aquarium was cleaned daily in order to prevent accumulation of fecal materials and reduce the growth of algae, and the same amount of fresh water was used to refill the aquaria. Water was partially changed once every three days using fresh water. Aeration was continuously provided using an air blower. The test diets were fed to triplicate aquaria two times daily at rate of 3% of body weight for 90 days. 2.3. Preparation of Samples At the end of twelve weeks of growth study, fish per tank were collected for analysis. Fish were homogenized for whole body analysis and frozen at -18°C. The homogenized samples were oven dried at 60 - 80˚C for 48 hrs. Proximate analyses of whole body, protein, lipid, and ash were performed according to standard AOAC (2000) methods and gross energy (Ballistic bomb calorimeter, Gallenhamp, En gl and). 2.4. Water Quality Water quality parameters (temperature, dissolved oxygen, pH, ammonia, nitrate and nitrite) were monitored to ensure water quality remained well within limits recommended for Nile tilapia. Water temperature and dissolved oxygen were measured every other day using an YSI Model 58 oxygen meter (Yellow Springs Instruments, Yellow Springs, OH). Ammonia and nitrite were measured at wkly intervals. Alkalinity was monitored twice weekly using the titration methods of Golterman et al. (1978) pH was monitored twice weekly using an elec-  M. M. Gaber et al. tronic pH meter (pH pen Fisher Scientific, Cincinnati, OH). During the feeding trial, the water quality parameter averaged ( ± SD): water temperature 27.8 ± 0.8˚C dissolved oxygen 4.8 ± 0.4 mgl-1; pH 7.4 ± 0.6; ammonia 0.01 ± 0.04 mgl-1; nitrite 0.1 ± 0.05 mgl-1; nitrate 1.5 ± .2 mgl-1; alkalinity 181 ± 46 mgl-1. 2.5. Calculations and Statistical Analysis Calculations of growth parameters were conducted according Cho and Kaushik (1985). Data were analyzed by analysis of variance (ANOVA) using the SAS ANOVA procedure (Statistical analysis system 1933) Duncan’s multiple range tests was used to compare differences among individual means. Treatment effects were consi- dered significant at p < 0.05. All percentages and ratio were transformed to arcsine values prior to analysis (Zar, 1984). 3. Results There were no significant differences in water quality parameter among the treatments during experimental pe- riod. Water quality parameters were within the acceptable range for Nile tilapia growth (Stickney, 1979). 3.1. Feed Quality The amino acids as well as the nutrient contents of the diets are presented in Tables 1 and 2. The essential ami- no acid of the basal diets meets the requirements of Nile tilapia (Santiago and Lovell, 1988). 3.2. Growth Performance The changes in mean body weight (g/fish) of Nile tilapia fed on eight tested diets containing 0, 15, 30, and 45% WD instead of YC, without or with 0.03% Digestarom® during the period of the experiment (3 months) are shown in Figure 1. In the beginning of the experiment, mean weight was not significantly different among the treatments (p > 0.05). The overall averages ± SD of Nile tilapia 15.4 ± 0.5 g/fish for weight. At the end of the experiment, the mean weight (Figure 1) ranged between 49.6±3.5 g at the highest level wet date and 55.9±2.9 g Table 1. Composition of experimental diets fed to Nile tilapia fingerlings (g.100 g-1diet). Ingredients Diets Without Supplement D With D 0.03%D 1 (0%) 2 (15%) 3 (30%) 4 (45%) 5 (0%) 6 (15%) 7 (30%) 8 (45%) Fish meal Soybean meal Yellow corn meal Wet date (WD )1 Soybean oil Vita. & min2 Digestarom®3 23.0 29.0 45.0 - 2.0 1.0 -- 23.0 29.0 38.25 6.75 2.0 1.0 -- 23.0 29.0 31.5 13.5 2.0 1.0 -- 23.0 29.0 24.75 20.25 2.0 1.0 -- 23.0 29.0 45.0 - 2.0 1.0 0.03 23.0 29.0 38.25 6.75 2.0 1.0 0.03 23.0 29.0 31.5 13.5 2.0 1.0 0.03 23.0 29.0 24.75 20.25 2.0 1.0 0.03 Proximate analyses (%) Moisture Crude protein Crude fat Ash Crude fiber NFE 4 GE (kjg-1)5 P/E6 9.08 30.49 6.27 7.71 4.89 41.56 18.4 69.33 9.22 30.43 6.37 8.25 4.95 40.75 18.4 69.58 9.46 30.43 6.49 8.8 5.03 39.79 18.4 69.80 9.70 30.40 6.58 9.33 5.09 38.90 18.4 70.08 9.05 30.49 6.30 7.75 4.91 41.50 18.4 69.34 9.17 30.47 6.39 8.26 4.96 40.15 18.4 69.60 9.41 30.43 6.46 8.81 5.04 39.85 18.4 69.86 9.68 30.40 6.57 9.32 5.08 38.95 18.4 70.08 1Wet Da te meal, date waste seed and grinded to fine particles; 2Premix supplied according to Xie; Cui; Yang & Liu (1997); 3Digestarom® (D) is a dried combination of natural attracting spices that stimulate digestibility; 4NFE (Nitrogen free extract) = 100-(%moisture +%C. protein +%C. fat +%C. fiber +ash); 5Gross energy (GE) = calculated as 5.621.64, 39.5 and 17.24 kjg-1 of protein, fat and carbohydrate respectively according to NRC, 1993); 6P/E ratio (protein to energy ratio) = mg protein/kj GE. 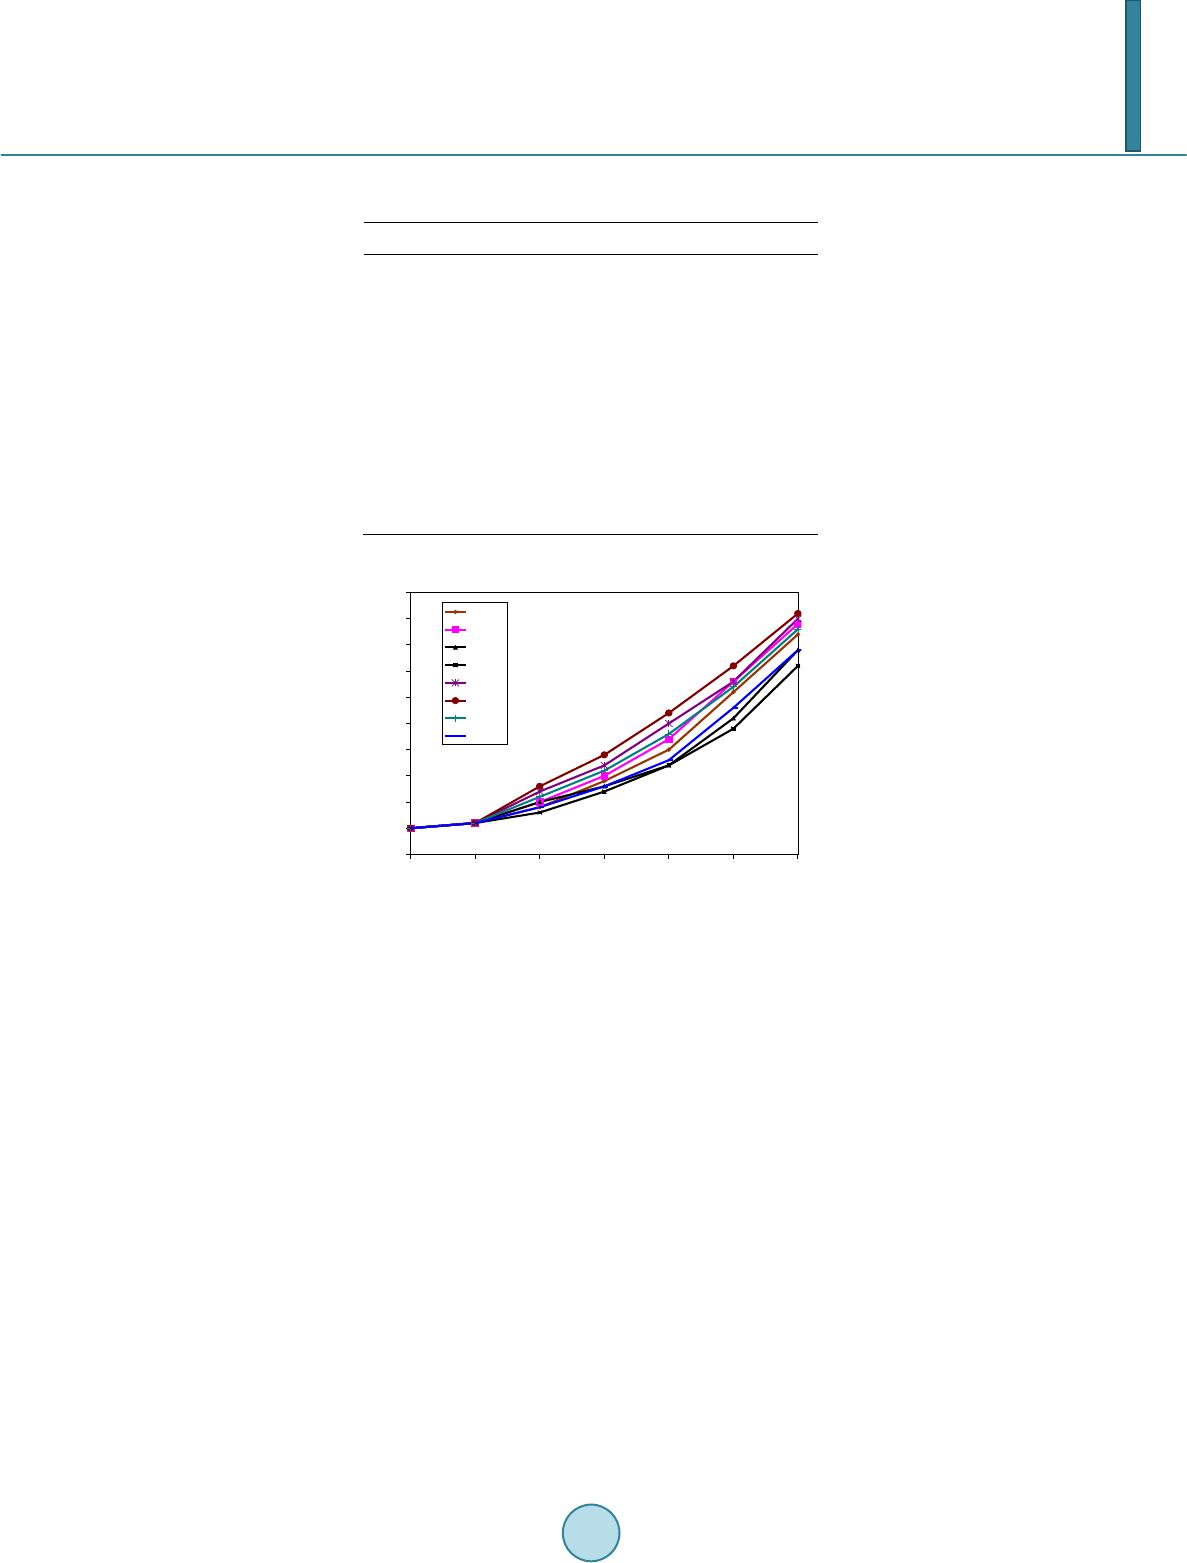 M. M. Gaber et al. Table 2. Amino acid composition content of basal diet and amino acid requirements of Nile tilapia (g.100 g-1diet). Indispensable amino acid Required1 Diet 1 (control) Arginine 1.6 1.52 Histidine 0.65 0.97 Isoleucine 1.18 1.32 Leucine 1.29 1.81 Lysine 1.95 1.69 Methionine 1.02 0.88 Phenylalanine 1.43 1.22 Threonine 1.43 1.37 Valine 1.06 1.39 1From Santiago & Lovell (1988). Figure 1. Effect of different levels of wet date diets supple- mented with 0% and 0.03% Digestarom® on weight gains of Nile tilapia fingerlings. at lowest level wet date. The mean weight was significantly affected by wet date, and D supplementation rate. The overall data of final individual weight and specific growth rate (SGR) for Nile tilapia reared at four levels wet date and D supplementation for a period of 3 months in aquarium are presented in Table 3. It can be con- cluded from this table, mean final weight (g/fish), and SGR (%/day) were significantly (p < 0.05) affected and the best fish weight was obtained with the 30% level wet date and supplemented with 0.03% D. The results of feed conversion ratio (FCR), protein productive value (PPV%) and protein efficiency ratio (PER) are presented in Table 3. Feed conversion ratio and protein productive value, protein efficiency ratio were significantly (p ≤ 0.05) affected by level wet date and exhibited the best results at the 30% level wet date and at supplemented with Digestarom® (D). Feed intake was significantly higher in Nile tilapia fed on 30% WD at 0.03% D than other WD levels. The feed conversion ratio (FCR) of Nile tilapia fed on 30% WD at 0.03% D was not significantly different (p > 0.05) when compared with control diet (Diets with 0% WD). Increasing die- tary levels of WD from 30 to 45% caused decreasing feed intake and deterioration (FC). Protein efficiency ratio (PER), protein productive value (PPV) was significantly higher at 30% WD and supplemented with 0.03% D. The lowest PER, PPV were observed at 45% WD without and with D. 3.3. Whole Body Composition The chemical compositions of whole body parameters of Nile tilapia fingerlings fed diets containing different levels of WD supplemented without and with 0.03% D are summarized in Table 4. Value of moisture, crude 10 15 20 25 30 35 40 45 50 55 60 Initial 1st 152nd 153rd 154 th 155 th 156 th 15 Experimental period (days) Diet 1 Diet 2 Diet 3 Diet 4 Diet 5 Diet 6 Diet 7 Diet 8  M. M. Gaber et al. Table 3. Growth performance and nutrient utilization of Nile tilapia fed the experimental diets. Classification Average fish weight (g/fish) SGR 3 FI (g/fish)4 FCR5 PER6 PPV7 1IB W 2FB W Wet date levels 0% 15% 30% 45% 10.54 ± 0.1 10.58 ± 0.1 10.51 ± 0.1 10.59 ± 0.1 42.19 ± 5.6d 45.94 ± 2.9c 55.06 ± 4.3a 52.30 ± 3.2b 1.65 ± 0.2d 1.75 ± 0.1c 1.97 ± 0.1a 1.90 ± 0.1b 45.4 ± 1.7c 49.3 ± 1.4b 50.2 ± 0.4b 51.4 ± 1.0a 1.47 ± 0.2c 1.40 ± 0.1b 1.20 ± 0.2a 1.20 ± 0.1a 2.3 ± 0.3d 2.40 ± 0.1c 2.90 ± 0.4a 2.70 ± 0.2b 34.0 ± 4.7c 35.8 ± 2.1c 46.3 ± 6.0a 41.1 ± 0.1b Digestarom® 0% 0.03% 10.50 ± 0.1 10.61 ± 0.1 45.25 ± 5.8b 52.50 ± 5.0a 1.73 ± 0.2b 1.90 ± 0.1a 48.2 ± 2.8b 49.9 ± 2.0a 1.43 ± 0.2b 1.20 ± 0.3a 2.2 ± 0.2b 2.8 ± 0.3a 35.8 ± 6.6b 42.8 ± 5.9a WD x D N.S ** ** ** ** ** ** Values are mean ± standard deviation. Values in the same row with same superscripts are not significantly different (p ≥ 0.05). 1IBW = initial body weight. 2FBW = final body weight. 3SGR, specific growth rate = (Ln FBW-Ln IBW)/90x100. 4FI = feed intake 5FCR, feed conversion ratio = dry feed fed/ body weight gain. 6PER, protein efficiency ratio = final body weight gain/protein intake X100. 7PPV%, protein productive value = protein gained in fish body (g)/ protein fed (g) X100. Table 4. Whole body composition (% wet weight basis) of fish at the end of the experiment. Classification Moisture Crude protein Ether extract Ash Energy (Kj/100g) Wet date levels (WD) 0% 15% 30% 45% 75.0 ± 0.8a 74.7 ± 0.2ab 73.9 ± 0.2bc 74.5 ± 0.2b 14.5 ± 0.3b 14.7 ± 0.2bc 15.5 ± 0.1a 14.8 ± 0.2b 5.4 ± 0.2b 5.5 ± 0.1b 5.8 ± 0.1a 5.4 ± 0.1b 5.2 ± 0.2b 5.2 ± 0.1b 4.9 ± 0.1c 5.4 ± 0.1a 592.0 ± 26.9ab 587.9 ± 17.6c 599.2 ± 11.1a 601.8 ± 03.7a Digestarom® (D) NS NS NS 0% 0.03% 74.5 ± 0.5 74.5 ± 0.8 14.8 ± 0.4 14.9 ± 0.4 5.5 ± 0.2 5.6 ± 0.2 5.2 ± 0.2a 5.1 ± 0.2b 596.8 ± 11.2 593.7 ± 21.6 WD x D NS NS NS ** ** Values are mean ± standard deviation. Values in the same row with same superscripts are not significantly different (p ≥ 0.05). protein (CP%), ether extract (EE%) and ash content were highly significantly (p < 0.05) different between all fish groups. However, energy contents significantly not (p > 0.05) different among all fish groups. Incorporation WD at 30% replacement level only did significantly increase protein content. 4. Discussion Approximately 30% of yellow corn meal (CM) energy could be replaced by WD, and result in growth rates in Nile tilapia higher than a CM-based diet. This is the first time to our knowledge that wet date meal has been demonstrated to be effective in replacing CM in fish diets. Based on feed intake the palatability of control diet and diets 2, 3, 5, 6 and 7 appeared to be better than the two diets 4 and 8 (Table 3 and Figure 1). Feed intake was significantly higher (P < 0.05) in Nile tilapia fed diets containing 30% WD without and with 0.03% D. The feed conversion ratio (FCR) of Nile tilapia fed WD at 30% inclusion levels was significantly different (P > 0.05), compared with those fed other levels of WD. Increasing dietary WD levels from 30 to 45 % caused significant deterioration in FCR (P < 0.05). On the other hand, El-Sayed et al. (2006) noted that increasing dietary DP le- vels from 25 to 100% did not cause any further deterioration in FCR (P > 0.05). There were significant differ- ences in weight gain and feed conversion (FCR) was significantly greater with diets 30% WD at 0.03% D than with the other diets. Diet 3 contained 30% WD and represented the highest level of substitution, which was sig- nificantly different from the other diets (Table 3). These results are in agreement with the results of El-Sayed et al. (2006) and Yousif et al. (1996). While Osman et al. (2001) found that growth performance values were sig- nificantly (P<0.05) higher in Nile tilapia fed diet which containing 50% date pits treated with H2SO4 and NaOH, whereas fish fed diet containing 50 % untreated date pits gave the lowest values (P > 0.05), in our experiment.  M. M. Gaber et al. Also, Belal (2008) found that growth performance of Nile tilapia fed diet containing of fungi Trichoderma ree- sei-degraded date pits DDP could replace 300 g kg−1 of dietary corn with better growth results, when compared with those fish fed the other diets. In the present experiment, the lowest final fish weight was obtained by fish fed on diets containing 45% WD replacing CM, without and with 0.03% D. similar results have been reported by Yousif et al. (1996), who found that blue tilapia (Oreochromis aureus) fed date pits as carbohydrate source without growth enhancing supple- ment had significantly poor performance. The poor performance of tilapia fed WD may have been due to their high contents of simple sugars (Yousif et al., 1996), whereas tilapia is known to utilize complex sugars more ef- ficiently than simple sugars. In support, Shiau and Lin (1993) studied the effects of starch or fructose on the growth and feed efficiency of (Ore ochromis. niloticus x Oreochromis aureus) hybrids. They found that starch was better utilized than glucose. This result is also applied to specific growth rate (SGR%). The results showed that diets containing 30% WD without or with 0.03% D as feed additives was significantly different from con- trol diets (1) in its effect on fish performances. The present results are in agreement with the finding of Belal and Al-Owafeir (2009) who found that growth performance, including SGR% of Nile tilapia fed the control diet are similar to fish fed date pits fed at 15 and 30 levels. Similar results have been reported for probiotic use in diets for tilapia fingerling by Khattab et al. (2004); Salem (2008); Eid and Mohamed (2008); Mohamed et al. (2007), El-Dakar et al. (2007) and Carnevali et al. (2006). Increasing dietary levels from 30 to 45% in the experimental diets with other additives increased significantly (P < 0.05), protein efficiency ratio (PER), protein productive value (PPV%) and energy utilization (EU%) about control diet (2, 3, 4 and 5 vs. diet 1). Similar results have been reported by El-Sayed et al. (2006) who noted that PER, PPV% and EU% were significantly affected (P < 0.05) by increasing date pits levels in Nile tilapia diets. Also significant (P < 0.05) improvement was observed with D addition in FCR, PER and PPV within each re- placement category. Protein efficiency ratio (PER) and protein productive value (PPV%) were significantly higher on the replacement rate was 30% WD and 0.03% D The lowest protein productive value (PPV%) (30.7%) was observed with diet (1) as opposining the high inclusion levels of Osman et al. (2001). The same trend was obtained with the Energy utilization (EU%). However, these results are in agreement with the results of Mehrim, (2001); Diab et al. (2002); Khattab et al. (2004); Mohamed et al. (2007) and Eid and Mohamed (2008.), for tila- pia. The present results confirm those obtained by Azaza et al. (2008) in their work on waste date meal fed to Nile tilapia and Abd El-Maksoud et al. (1999) on tilapia fed diets supplemented with Marjoram leaves. Calculations of economical efficiency of the tested diets based on cost one kg gain in weight of Nile tilapia in comparison with the control group are shown in Table 5. Net profit were gradually increased with the increasing levels of WD and with addition of the D and reached the highest for the diet 3 and 7. At the level of WD re- placement (30%) with 0.03% D, it was found that Nile tilapia could be produced cheaper than fish fed on the Table 5. Economic information for Nile tilapia. Ite ms Diets Without supplement D With supplement D 1 (0%) 2(15%) 3(30%) 4(45%) 5(0%) 6(15%) 7(30%) 8(45%) Food cost kg diet (LE) No. fish stocked/m3 No fish harvested m3 Harvested (kgm-1) Food used(kg/m-1) Fingerling cost (LE)1 Food cost2 Total cost (LE) Value of harvest (8.6 LE. kg-1) Net profit (LE) 2.9 100 100 3.7 4.4 18.3 12.8 31.1 31.8 0.82 2.7 100 100 4.3 4.8 18.2 13.0 31.2 37.0 6.2 2.8 100 100 5.1 5.1 18.1 14.3 32.4 43.9 11.5 2.7 100 100 4.9 5.1 18.0 13.8 31.8 42.1 10.3 2.9 100 100 4.7 4.7 18.5 13.6 32.1 40.4 8.3 2.8 100 100 4.9 5.6 17.4 15.7 33.1 42.1 9.0 2.8 100 100 5.9 4.9 17.0 13.7 30.7 50.7 20.8 2.7 100 100 5.5 5.2 17.5 14.0 31.5 47.3 16.8 1LE = Lever Egyptian, one Dollar equal 6.12 LE; 2Feed cost of 1 kg ingredients used were 6 LE for fish meal, 23.9 LE for soybean meal, 1.75 LE yellow corn meal, and 0.5 LE date stone, 12 LE for Digestarom®, 6.5 LE for soybean oil, 5.0 LE vitamin and minerals, ingredient price at start of 2012.  M. M. Gaber et al. control diet. These results may indicate that the costs of one kg of diet declined by the incorporation of non conventional energy sources supplemented with 0.03% D due to its low price and this is in agreement with El-Sayed et al., (2006) and from the previous results, it could be concluded that the diet containing 30% WD with 0.03% Digestarom® as dietary energy sources in formulation of Nile tilapia diets instead of 30% yellow corn meal have positive improvement effects on Nile tilapia performance. From feed utilization data and from the economical point of view the diet contained 30% WD and supplemented with 0.03% D could be recom- mended as feed for Nile tilapia fingerlings. References Abd El-Maksoud, A. M. S., Abouul-Fotouh, G. E., Allam, S. M., & Abou Zied, R. M. (1999). Effect of Marjoram Leaves (Majorana hortensis) as a Feed Additive on the Performance of Nile Tilapia (Oreochromis niloticus) Fingerlings. Egyp- tian Journal of Nutrition and Feeds, 1, 39-47 . AOAC (2000). Association of Official Analytical Chemists, Official Methods of Analysis (17th ed.) Washington DC. Azaza, M. S., Mensi, F., Kammoun, W., Abd Elouaheb, A., Brini, B., & Kraiem, M. (2008). Nutritional Evaluation of Waste Date Fruit as Partial Substitute for Soybean Meal in Practical Diets of Juvenile Nile Tilapia, (Oreochromis niloticus). Aquaculture Nutrition Published Online: 2 June 2008, Journal Compilation © 2009 Blackwell Publishing. Belal, I. E. H., & Al-Owafeir, M. A. (2009). Incorporating Date Pits (Phoenix dactylifera) and Their Sprouts in Se mi-Purified Diets for Nile Tilapia (Oreochromis niloticus L.). Journal of the World Aquaculture Society, 35, 452 -459. http://dx.doi.org/10.1111/j.1749-7345.2004.tb00110.x Belal, I. E. H. (2008). Evaluating Fungi-Degraded Date Pits as a Feed Ingredient for Nile Tilapia (Oreochromis niloticus L). Aquaculture Nutrition, 14, 445-452. http://dx.doi.org/10.1111/j.1365-2095.2007.00548.x Carnevali, O., De Vivo, L., S u lp izi o , R., Gioacchin, G., Olivotto, I., Silvi, S., & Cresci, A. (2006). Growth Improvement by Probiotic European Sea Bass Juveniles (Dicentrarchus labrax, L.), with Particular Attention to IGF-1, Myostatin and Co r- tisol Gene Expression. Aquaculture, 258, 430-438. http://dx.doi.org/10.1016/j.aquaculture.2006.04.025 Cho, C. Y., & Kaushik, S. J. (1985). Effect of Protein Intake on Metabolizable and Net Energy Values of Fish Diets. In: C. B. Cowey, A. M. Mackie, & J. G. Bell (Eds.), Nutrition and Feeding in Fish (pp. 95-117 ). Lond on : Academic Press. Diab, A. S., EL-Nagar, O. G., & Abd-El-Hady, M. Y. (2002). Evaluation of Nigella sativa L. (Black Seeds; Baraka), Allium sativum (Garlic) & Biogen as a Feed Additives on Growth Performance of (Oreochromis niloticus) Fingerlings. Vetrenary Medical Journal, Suez Canal University, 2, 745-753. Eid, A., & Mohamed, K. A. (2008). Effect of Using Probiotic as Growth Promoters in Commercial Diets for Monosex Nile Tilapia (Oreochromis niloticus) Fingerlings. 8th International Symposium on Tilapia in Egypt. El-Dakar, A. Y., Shalaby, S. M., & Saoud, I. P. (2007). Assessing the Use of Dietary Probiotic/Prebiotic as Enhancer of Spine Foot Rabbit Fish (Singanus rivulatus) Survival and Gr o wt h. Aquaculture Nutrition, 13, 407-412. http://dx.doi.org/10.1111/j.1365-2095.2007.00491.x El-Sayed, A. F. M., Hamza, W. R., & Al-Darmaki, M. (2006). Evaluation of Date Pits as a Feed Ingredient for Juvenile and Adult Nile tilapia (Oreochromis niloticus) Reared in a Recirculating System. Proceeding of 7th International Symposium on Tilapia aquaculture. El-Shazly, K., Ibrahim, I., & Karam, H. (1963). Nutritional Value of Date Seeds for Sheep. Journal of Animal Science, 22, 894-897. FAO (Food and Agriculture Organization of the United Nations) (2004). Fishery Statistics 2002. Rome: Capture Production, FAO . Golterman, H. L., Clymo R. S., & Ohnstad, M. A. M. (1978). Methods of Physical and Chemical Analysis of Fresh Waters (214 p). Oxford: Blackwell Scientific Publications. Khattab, Y. A. E., Shalaby, A. M. E., Saffa, M. S., El-Marakby, H., & Ri zl Alla, E. H. (2004). The Physiological Changes and Growth Performance of the Nile Tilapia (O. niloticus) after Feeding with Biogen® as Growth Promoter. Egypt Journal of Aquatic Biology and Fisheries, 8, 145-15 8. Mehrim, A. I. M. (2001). Effect of Some Chemical Pollutants on Growth Performance, Feed and Nutrient Utilization of Nile Tilapia (O. niloticus) (215 p). M.Sc. Th esi s , Saba Basha: Alexandria University. Mohamed, K. A., Abdel Fattah, B., & Eid, A. M. S. (2007). Evaluation of Using Some Feed Additives on Growth Perfor- mance and Feed Utilization of Monosex Nile Tilapia (O. niloticus) Fingerlings. Agricultural Research Journal, Suez Can- al University, 7, 49-54 . NRC (1993). Nutrient Requirements of Warm Water Fishes and Shellfishes. Washington DC: National Academy Press. Osma n, M. F., Alhadrami, G. A. , & Ben Zayed, A. A. (2001). Sulfuric Acid Treated Date Pits as a Dietary Ingredient in Nile Tilapia (Oreochromis niloticus) Diets. Egyptian Journal of Nutrition and Feeds, 4, 753 -754.  M. M. Gaber et al. Salem, M. E. M. (2008). Studies on Some Medicinal Plants as Mycotoxins in Fish Diets. M.Sc. Department of Animal Pro- duction, Thesis Submitted to the Faculty of Agriculture University Kafr Elsheikh University. Santiago, C. B., & Lovell, R. T. (1988). Amino Acid Requirements for Growth of Nile Tilapia. Journal of Nutrition, 188, 1540-1546. Shiau, S. Y., & Lin, S. E. (1993). Effect of Supplemental Dietary Chromium and Vanadium on the Utilization of Different Carohydrates in Tilapia Oreochromis niloticus × Oreochromis aureus. Aquaculture, 110, 321 -330. http://dx.doi.org/10.1016/0044-8486(93)90379-D Statistical Analysis System (1993). SAS/STAT User’s Guide Release 6.03 Ed i tio n . Cary, North Carolina, USA: SAS Institute Inc. Stickney, R. R. (1979). Principles of Warm Water Aquaculture. New York: Wiley International Science. Xie, S., Cui, Y., Yang, Y., & Liu, J. (1997). Energy Budget of Nile Tilapia, Oreochromis niloticus in Relation to Ration Size. Aquaculture, 154, 57-68. http://dx.doi.org/10.1016/S0044-8486(97)00039-2 Yousif, O. M., Osman, M. F., & Alhadrami, G. A. (1996). Evaluation of Date and Date Pits as Dietary Ingredients in Tilapia (Oreochromis aureus) Diets Differing in Protein Sources. Bioresearch Technology, 57, 81-85. http://dx.doi.org/10.1016/0960-8524(96)00054-5 Zar, J. H. (1986). Biostatistician Analysis. New Jersey, USA: Prentice Hall, Englewood Cliffs.
|