 Journal of Power and Energy Engineering, 2014, 2, 345-351 Published Online April 2014 in SciRes. http://www.scirp.org/journal/jpee http://dx.doi.org/10.4236/jpee.2014.24046 How to cite this paper: Doost, A.K. and Akhlaghi, M. (2014) Estimation and Comparison of Solar Radiation Intensity by Some Models in a Region of Iran. Journal of Power and Energy Engineering, 2, 345-351. http://dx.doi.org/10.4236/jpee.2014.24046 Estimation and Comparison of Solar Radiation Intensity by Some Models in a Region of Iran Abdollah Khalesi Doost, Mozhgan Akhlaghi Mechanical group, Engineering Faculty, Islamic Azad University, Semnan Branch, Semnan, Iran Email: Ab.khalesi@yah oo.com, m_akhlaghi1024@gmail.com Received February 2014 Abstract Due to the increasing explanation of new energy application on a world scale and because of the reduction of environmental pollution arise from usage of solar energy in high potential regions, the necessity of solar radiation measurement in different regions of Iran is obvious. Therefore, in this study, the amount of radiation is measured by Pyranometer from beginning of February to August 2010 in Semnan (The central part of Iran), and it is compared with daily sunny hours, dif- ferent estimated models of daily radiation such as Angstrom-Pryskat (Montis, Climate classifica- tion based on the Terwartha scientific map, using the results of 40 worldwide station, using the results of 9 Synoptic stations in Iran), the Maximum likelihood (using the results of 100 stations in worldwide, using the results of 9 Synoptic station in Iran). Finally, Terwartha scientific map model is proposed because of matching more with measured data on location. Keywords Solar Radiation Intensity; Solar Energy Estimation Models; Total Daily Radiation; Direct Radiation 1. Introduction The amount of solar radiation models using geographical conditions sunshine hours radiation outside the at- mosphere and the experimental results obtained from several stations, calculated or predicted In addition to the relation of Angstrom-periscat in national level has been tested in many countries such as Australia and Canada, Carribbean countries (Guatemala, vest India and Venezueela), Middle East countries (in- cluding Kuwait, Iraq, Egypt and Turkey) South Asian countries (including Srilanka, India and Pakistan, and Ni- geria, Sudan and Lesotho in Africa. In southeast Asian countries, Hong Kong, Macau, Thailand, Malysia, Sin- gapure, Vietnam and China have been connected such studies. Many researchers have used solar inclination and latitude. Some of them have used combination of sunny hours, air temperature and relative humidity in their ex- perimental models. Some of them were related the total amount of daily solar radiation with sunshine hours, rel- ative humidity, maximum temperature, latitude, altitude from sea surface, and the position from surface water or they compile their equation based on sunshine hours, relative humidity, air average temperature, moderate soil temperature, solar inclination, moderate cloudiness and average evaporation.  A. K. Doost, M. Akhlaghi In one of these studies in Iran a method was proposed for predicting daily global radiation in Tehran which is generalized later for Iran large cities [1]. Another research model was compiled to predict daily radiation in different cities of Ira n [2 ]. In this model distance correction coefficient from Sun-Earth cloudiness coefficient, and sun bright hour, are used as the first important data. Also monthly and annual radiations were estimated in Shiraz [3]. Furthermore, two computa- tional models were proposed to predict the direct radiation flux and broadcast, total, hourly, daily and monthly. These models were established using data from meteorological country organization and then Bandar Abbas took the generalization [4]. In other researches, measurable data daily total energy during 1984-1992, and number of sunshine hours per day during 1985-1990, were reviewed and analyzed based of the amount of daily total radiation measured ener- gy in Kerman, two analytical equations were calibrated [5,6]. The improved relation with high accuracy was used with high accuracy for estimating total solar radiation south eastern of Iran, afterwards with the use of sun brigth hours monthly filter coefficients was calculated for Shiraz. Also the relationship proposed for estimating monthly average air filter coefficients in different cities of Iran, and air filter coefficient amounts were calculated, th ese amounts were compared with experimental data and the amounts obtained from the proposed methods of other researchers. Afterwards, the effect of factors such as alti- tude from sea, the number of dusty days during month and seasonal changes of Sun-Earth distance was taken into consideration [8 ,9 ]. 2. Geographical Area To extract the total radiation data from the Pyranometer in Islamic Azad University Semnan Branch, the geo- graphic coordinate 53026' longitude, 35036' latitude and 1217 meter altitude have been installed and used. To ex- tract the data pertain to daily sunny hours with sun-geornalist device has been used from Semnan synoptic weather station. 3. Method of Calculation In this research two submodels are used to estimate the monthly average of daily radiation [7]. 1) Angstrom-Priskat (Terwartha ranking, Gupinatan, Proffesor Montis coefficients and using data from 9 synoptic stations in Iran) 2) Maximum probability (Akinoghlu and Ejevit in 100 worldwide stations, using 9 synoptic stations in Iran) To calculate these models the stages are presented as follow: 1) Calculation of coefficient related to model equations 2) To calculate the total amount of solar radiation according to equations 3) To compare the results using the models equation with the measurement results Calculation procedures for these models are presented as follows: 1) Computing the coefficients of the model 2) Calculate the total amount of solar radiation according to equation 3) Comparing the results obtained using the model with the measured results. In order to analyze the relationship between the measured total amount of daily solar radiation with the calcu- lated values, the total daily radiation using Kipp & Zonen Pyranometer measured over a six month period and the amount of sunshine hours daily using a sun journalist Lambrsht Germany during the period of measurement simultaneously, and then we should use the estimated models to be more variable in the model used to calculate them: ( ) ( ) 23.45sin 360284365n δ = ++ (1) In the relation (1), n is the number of days in a year. [ ] 1arccostan tan 15 s ω δϕ =+− (2) In this study, the solar constant, Gsc, 1353 w/m2 is considered.  A. K. Doost, M. Akhlaghi 024 36002 360 1 0.033coscoscos sinsinsin π365 360 sc s s Gn H πω ϕδω ϕδ × =+ ×+ (3) 2 /15arccos[tantan]N δϕ = − (4) Equation (5) offers the monthly average daily total radiation by Angstrom-Prysk at. (5) by calculating the mean value of Equation (3) is achieved during the month, the monthly average daily sunshine hours and calculating the mean value of Equation (4) is obtained during the month (Mean value of these variables must be taken into account in the month). a and b are the coefficients of the equation for calculating the total radiation of different ways, including: (Terwartha category, the coefficients Professor Muntys use information 9 synoptic stations in Iran) is used [7]. 3.1. Estimate Monthly Average Daily Solar Radiation Using Climate Classification Based On the Scientific Map TERWARTHA This method is based on the vegetation type and climatic conditions will be evaluated case’s Rankings mark for BW or dry desert climate that features weather is Semnan. In this case, the coefficients a and b are defined as follows: a = 0.25 b = 0.5 Using the coefficients in the model Angstrom-Pryskat Figure 2 is obtained. 3.2. Monthly Average Daily Radiation Estimates Using Data from 9 Synoptic Stations in Iran In reviewing the data from 9 synoptic stations were, Angstrom-Pryskat Coefficients model is obtained as fol- lows: a = 0.2551 b = 0.4466 Using the above coefficients in the Angstrom-Pryskat model, figure (2) is obtained. Comparing the results of Figures 1-3 and the results of monthly measurements in Figure 4 is shown. 3.3. Maximum likelihood The second model is a Maximum likelihood model to estimate monthly average daily radiation. Model in Equa- tion (6) is shown. 2 o H nn ab c H NN =++ (6) Figure 1. Estimate monthly average daily solar radiation us- ing Montis cofficients. 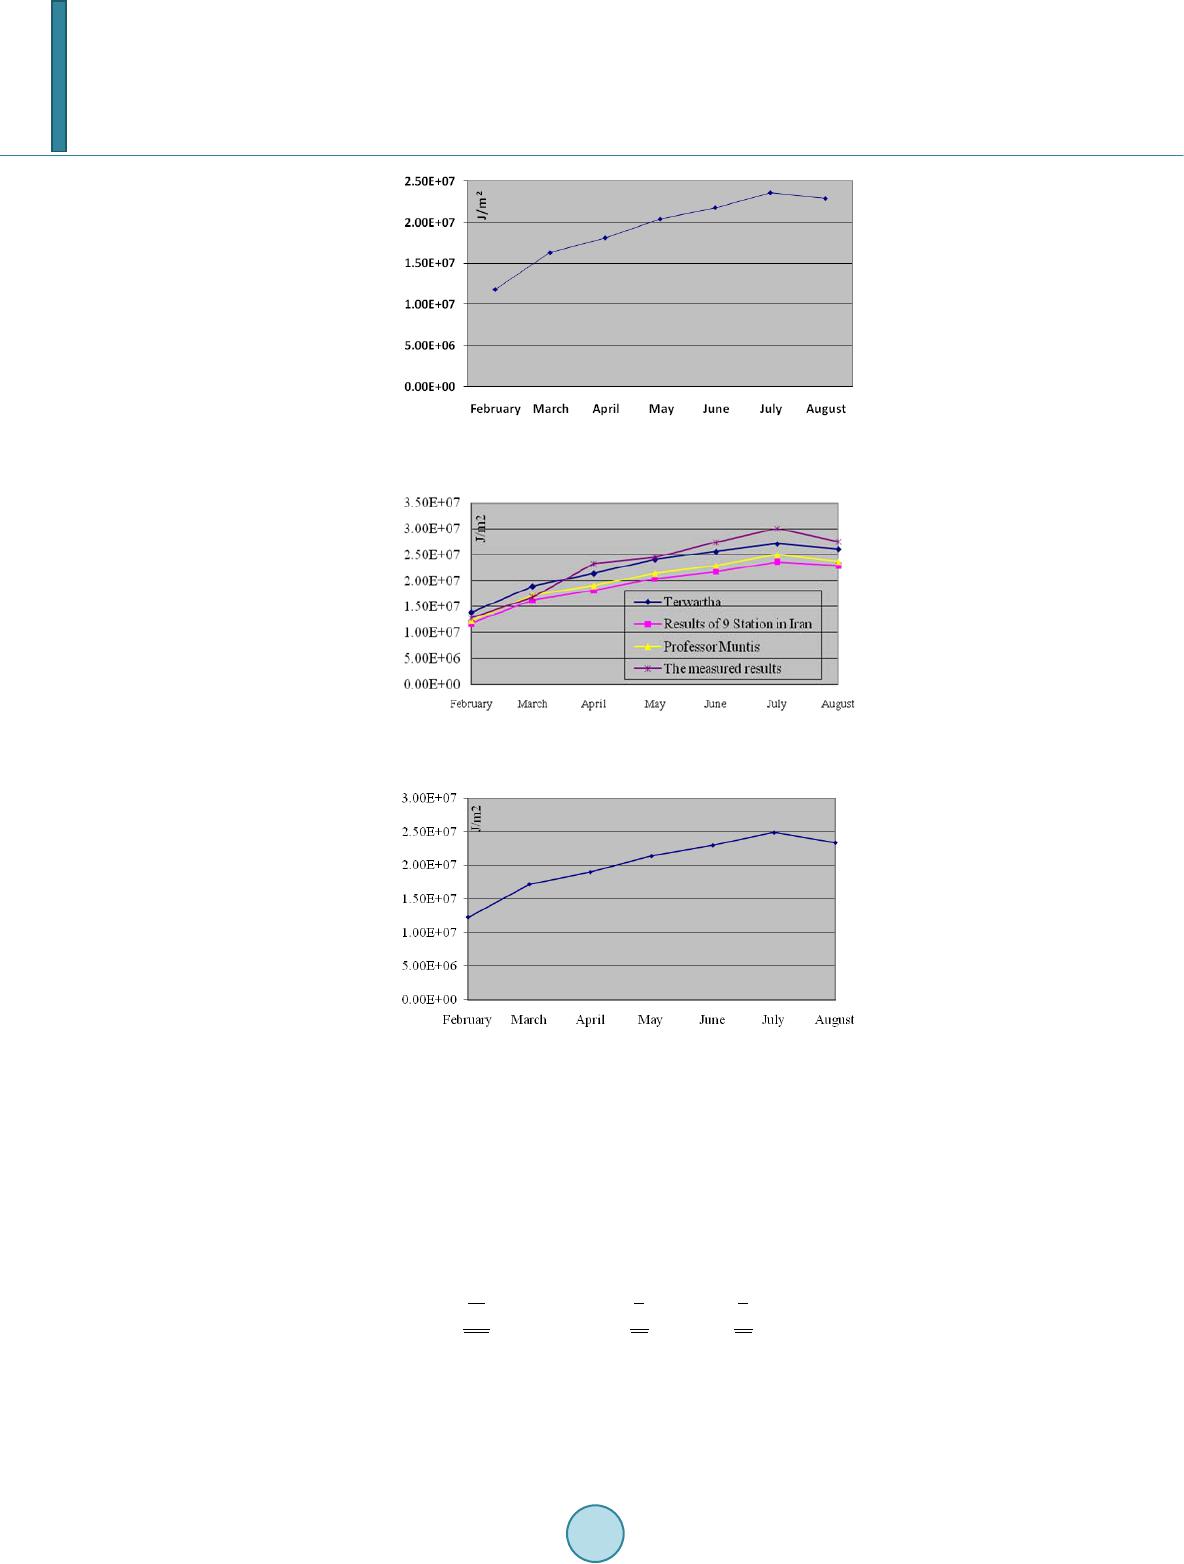 A. K. Doost, M. Akhlaghi Figure 2. Monthly average daily radiation using data from 9 station in Iran. Figure 3. Compares the results of different methods of Angstrom-Pryskat with measurement results. Figure 4. Estimation of monthly average daily solar radiation using data from 100 stations in the world. This model is used to calculate the monthly average of total daily radiation, the a, b and c are achieved by us- ing different ways including: Akinoghlu and Ejevit in 100 stations in the world and use results of 9 synoptic sta- tions in Iran. 3.4. Akinoghlu and Ejevit on 100 Stations Worldwide Akinoghlu and Ejevit using data from 100 stations in the world, with correlation are arrived coefficients of Equ- ations (7). 2 0.145 0.8450.280 o H nn H NN =+− (7) Using these coefficients and using meteorological data of Semnan is obtained Figure 4. Using data from 9 synoptic stations in Iran and Solve Correlation equations, coefficients of Maximum like- lihood model, the Equation (8) is obtained. 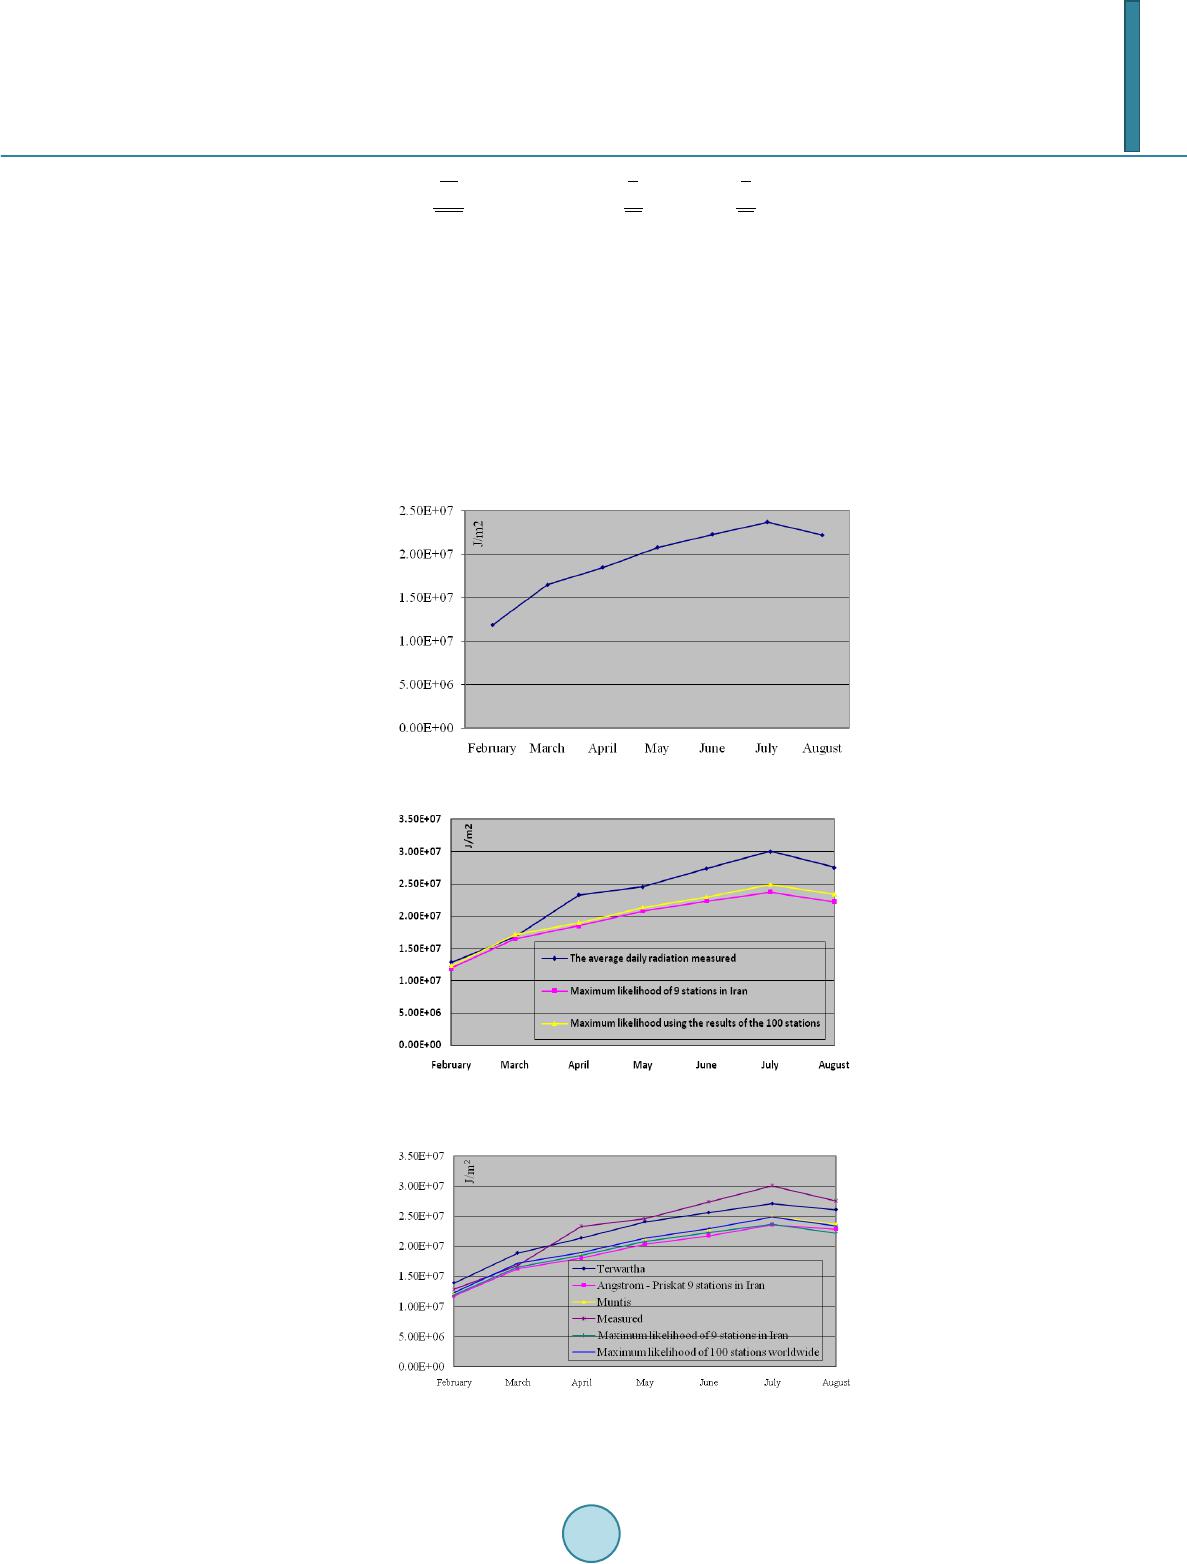 A. K. Doost, M. Akhlaghi ( ) 2 0.1088 0.97490.4421 0.91 H nn H NN o r =+− = (8) According to the above results and meteorological data of Semnan, is obtained Figure 5. To compare radiation estimation use the charts above using Maximum likelihood method and The actual re- sults obtained by measuring the result of Figure 6 are obtained. Comparing the above results conclude the results in less than 100 weather stations world meteorological data in 9 different synoptic weather stations of Semnan in Iran is thus obtained. The results of (3) and (6) (compares model types of Angstrom-Pryskat and Maximum likelihood) in the Fig- ure 7 are shown. Peak probability model by comparing the results obtained with the model Angstrom-Pryskat can be seen from Figure 5. Most likely results 9 synoptic stations in Iran. Figure 6. Compares the results with the actual results meas- ured with the Maximum likelihood model. Figure 7. Compares model types of Angstrom-Pryskat and Maximum likelihood.  A. K. Doost, M. Akhlaghi Table 1. The calculated error values for the various parameters. t MBD^2 RMSE^2 RMSE MBD Model 1.1585 5.99E+11 3.28E+12 1.81E+06 7.74E+05 Terwartha 4.5989 1.56E+13 2.00E+13 4.47E+06 3.95E+06 Angstrom-Pryskat 9 stations in Iran 3.8447 9.01E+12 1.27E+13 3.56E+06 3.00E+06 Muntys 4.4083 1.45E+13 1.89E+13 4.35E+06 3.80E+06 Maximum likelihood of 9 stations in Iran 3.8113 9.27E+12 1.31E+13 3.62E+06 3.05E+06 Maximum likelihood of 100 stations worldwide the above chart. Climate classification maps using coefficients based on academic results Tervartha closer to the measured results are compared with other models. 4. Calculate the Error To calculate the statistical measure for the accuracy of changes predictions in both the root mean square (RMSE) and mean changes in both quantity (MBD), the t-statistic was used to assess the accuracy of the values obtained. The root mean square value changes were defined by Equation (9) as: ( ) 1 2 2 ,, 1 1n im ic i RMSEH H n= = − ∑ (9) Where n is the number of data pairs. Two variations of root mean square (RMSE) provides information on the performance of short-term relationships, and for this purpose the actual deviation between the calculated value and the measured value is compared sentence by sentence. The actual deviation between the calculated value and the measured value is less, we will have a better model. A large deviation in the series may lead to an in- crease in RMSE. Both the mean changes according to Equation (10) are defined as: ( ) 1,, 1 n i im ic MBDH H n = = − ∑ (10) ( ) 1 22 22 1n MBD tRMSE MBD − = − (11) Using the t-statistic in Equation (11), if t-statistic is smallest the value of the test methods used to predict the actual outcome is closer’s. In Table 1, these amounts have been calculated. 5. Conclusion According to the results of calculations by means of the coefficients a and b are different Angstrom-Priskat Angstrom and compare them with the measured results, it can be seen in the model measured Tervartha best matches with the data. Also with regard to the results of the model calculation of Maximum likelihood coeffi- cients vary a and b and c and compare them with the results of the measurements can be seen that the methods proposed model, the Maximum likelihood 100 stations world is more compatible with the data measured. Com- paring the measured data in all models, the best model for estimating radiation data for Semnan Tervartha model is determined, which has the minimum error. References [1] Samimi, J. (1994) Estimation of Height-Dependent Solar Irradiation and Application to the Solar Climate of Iran. Solar Energy, 52, 401-409. http://dx.doi.org/10.1016/0038-092X(94)90117-K [2] Ashjaee, M., Roomina, M.R. and Ghafourian-Azar, R. (1993) Estimating Direct, Diffuse, Global Solar Radiation for Various Cities in Iran by Two Methods and Their Comparison with the Measured Data. Solar Energy, 50, 441-446. http://dx.doi.org/10.1016/0038-092X(93)90066-W  A. K. Doost, M. Akhlaghi [3] Saffaripour, M.H. (1995) Availability of Solar Energy in Kerman and Development of Empirical Formula to Predict Solar Radiation Intensity in Kerman Province MS Thesis (in Persian). Mechanical Engineering Department, Shahid Bahonar University of Kerman. [4] Yaghoubi, M.A. and Sabzevari, A. (1996) Further Data on Solar Radiation in Shiraz, Iran. Renewable Energy, 4, 393- 399. http://dx.doi.org/10.1016/0960-1481(96)00010-9 [5] Bahadori, M.N. and Mirhosseini, S.A. (2004) Solar Radiation Data for Various Cities in Iran (in Persian). Presented at the Third Conference on Optimization of Fuel Consumption in Building, 603-619. [6] Sabziparvar, A.A. (2008) A Simple Formula for Estimating Global Solar Radiation in Central Arid Deserts of Iran. Renewable Energy, 33, 1002-1010. [7] Gary, H. P. and Parkash, J. (2000) Solar Energy Fundamentals and Application. McGraw Hill, 67-84. [8] Ghaemmaghami, S.J., Geula, F. and Hussai n, P. (1997) Solar Energy Basics. Tehran University. [9] Safaei, B., Asadi, M.K., Taghizadeh, H., Jyl av y, A., Taleghani, G. and Danesh, M. (2005) Estimating Solar Energy Potential in Iran and Related Radiation Atlas. Journal of Nuclear Science and Technology, 33, 27-34. [10] Saffar, M.H. and Mehrabian, M.A. (2010) The Total Amount of Solar Radiation Forecasts Using the Kerman Profile. Geometry, Ast ronomy, Geography and Meteorology and Research Journals, 3-13. List of Symbols —The angle of inclination —Sunset hour angle —Latitude —Radiation daily —Monthly average daily radiation —Solar Day (h) —Monthly mean solar day —Solar Constant r—The correlation coefficient RMSE—Two change root mean square value MBD—Average changes in two values t—Measure the accuracy of the results
|