 Journal of Power and Energy Engineering, 2014, 2, 259-270 Published Online April 2014 in SciRes. http://www.scirp.org/journal/jpee http://dx.doi.org/10.4236/jpee.2014.24037 How to cite this paper: Aamir, M., Qiang, L., Xun, Z., Hong, W. and Zubair, M. (2014) Ultra Fast Spray Cooling and Critical Droplet Daimeter Estimation from Cooling Rate. Journal of Power and Energy Engineering, 2, 259-270. http://dx.doi.org/10.4236/jpee.2014.24037 Ultra Fast Spray Cooling and Critical Droplet Daimeter Estimation from Cooling Rate Muhammad Aamir1*, Liao Qiang1, Zhu Xun1, Wang Hong1, Muhammad Zubair2 1Key Laboratory of Low-Grade Energy Utilization Technologies and Systems, Chongqing University, Chongqing, China 2Department of Basic Sciences, University of Engineering and Technology (UET), Taxila, Pakistan Email: *aamir.muhammad1@cqu.edu.cn, aamircqu@gmail.com Received December 2013 Abstract Spray cooling is an effective tool to dissipate high heat fluxes from hot surfaces. This paper tho- roughly investigates the effects of spray parameters on the cooling time and cooling rate under varying inlet pressure using water as the coolant. Cylindrical samples of stainless steel with con- stant diameter, D = 25 mm, and thickness δ: 8.5 mm, 13 mm, 17.5 mm and 22 mm were investi- gated. Critical droplet diameter to achieve an ultrafast cooling rate of 300˚C/s was estimated by using analytical model for samples of varying thickness. At an inlet pressure of 0.8 MPa, maximum cooling rates of 424.2˚C/s, 502.81˚C/s and 573.1˚C/s were achieved for wall super heat ΔT = 600˚C, 700˚C and 800˚C respectively. Keywords Spray Cooling; Ultra Fast Cooling Rate; Inlet Pressure; Critical Droplet Diameter 1. Introduction Spray cooling is a very powerful heat management technique which is frequently applied in steel industry, ad- vance lasers, electronics devices and emergency cooling application such as power plants. Spray cooling has been reported to achieve as high as 10 MW/m2 [1-3]. There are enormous experimental and computational stu- dies which have been conducted to get the overall theoretical understanding and potential application of spray cooling in different fields of technology [4,5]. Due to complex nature of interaction of liquid and vapor phase, liquid impact and phase change in spray cooling, it is difficult to understand the heat removal phenomena, so overall understanding of spray cooling is still in its infancy stages [1,2]. Extensive experimental and computa- tional work is still required to get the complete picture of mechanism underlying the heat transfer phenomena during spray cooling. It is the esteem requirement of present development in different fields of technology to fabricate brands of steel which can fulfill the increasing technical requirements such as more moderate strength, better hardenability and good weldability, high tensile strength better creep and corrosion resistance etc. [6]. These mechanical *Corresponding author.  M. Aamir et al. properties of steel are directly related to microstructure of the steel which in return directly depend on the finish roll temperature and rate of cooling. In a typical production line of run out table of steel industry, the strips are reheated to a hot rolling temperature close to 900˚C and then cooled down to coiling temperature of 600˚C [7]. Cooling in this temperature range should develop multiphase microstructures to produce advance high quality steels. It is not possible to produce multiphase structures with conventional laminar cooling because creation of such structures requires very high cooling rate. Spray cooling technology has been reported to achieve such high cooling rates (~140˚C /s for 6mm, 300˚C /s for a 4 mm thick carbon steel strip). Spray cooling with such a high cooling rates is called ultrafast cooling [8,9]. Ultrafast cooling (UFC) is supposed to be achieved if the multipli- cation product of plate thickness (mm) and cooling rate (˚C/s) is greater than a threshold value of 800 [10,11]. Present research focused primarily on the effect of inlet pressure on the ultra fast cooling rate and secondly it discussed an analytical model to estimate the critical droplet diameter of an impinging droplet during water spray cooling. 2. Experimental Setup and Methods The experimental spray cooling system used in this research comprises three main systems namely fluid supply system, instrument system and heating system as shown in the Figure 1. 2.1. Fluid Supply System Fluid delivery system (FSS) was consisted of a spray nozzle supplied by Spray Systems Co. Ltd. It was a B1/2GG-SS16 type of nozzle with maximum working pressure of 150 psi (1.034 MPa). FSS was equipped with a CDL3-36 non-self-priming vertical multistage centrifugal pump with a head of 152m. It can work in the fluid working temperature limits of −15˚C to + 120˚C. Coriolis mass flow meter (ZLJ series) had been used in the fluid delivery system to measure the mass flow rate of the fluid during spraying process. FSS had also been provided with a pressure sensor (0 - 2.5 MPa), and temperature sensors (K type thermocouples) to measure the pressure and temperature of the fluid in the FSS. A bypass had been provided in the FSS to control the inlet pressure of the pray nozzle. The FSS was connected with a water tank to supply the water. Water tank (capacity: 50 gallon) was equipped with 4 heaters to vary the inlet fluid temperature. 2.2. Instrumentations System Instrumentations system includes all of the necessary electronic equipment to drive the FSS, to power heaters and to acquire necessary measurements. It consists of a data acquisition system installed in personal computer, thermocouples installed at different geometrical locations inside the stainless steel hot plate and FSS delivery system to monitor the temperature variations. Figure 1. Sketch of experimental facility. 1. Water Tank 2. Bypass 3. Pump 4. Valve 5. Pressure gauge 6. Mass flow Meter 7. Pressure Sensor 8. Temperature Sensor 9. Spray nozzle 10. Spray Chamber 11. Stainless Steel Hot Plate 12. Water Heater 13. Electricity Switch 14. Data Acquisition Devise (Agilent) 15. Computer 16. Out flow 15 6 8 1 3 5 24 P P 12 4 7 8 8 9 10 F 13 14 11 16  M. Aamir et al. 2.3. Heating Syst em Fabricated Hot Surface The primary component of hot surface is a stainless steel sample (cylindrical shape) with a diameter of 27 mm and thickness δ: 8.5 mm, 13 mm, 17.5 mm, and 22 mm. Four stainless steel plates of above mentioned thick- nesses were used in present study. Thermocouples were installed along the diameter of cylindrical block. The diameter of each thermocouple hole is φ = 2 mm with varying depths (12.5 mm, 8.5 mm and 4.5 mm). The ver- tical distance between 2 adjacent thermocouple holes on same vertical line is 4.5mm and distance from the mid- dle of hole to plate surface is 2 mm as shown in the side view of heater in Figure 2. In present work, we studied 1D spray heat transfer from top surface of the heater so cylindrical surface of the heater was insulated with ceramic tube and bottom surface was subjected to natural conviction as shown in Fig- ure 3. Benson burner with natural gas was used to heat up the block to desire high temperature (100˚C - 800˚C). 3. Spray Parameters and Analytical Model In the present study nozzle pressure, surface temperature was varied. The mean volume diameter (MVD) was estimated by using following equation [12]. ( ) 0.37 30 9.5// 2 n ddP sin α = ∆ (1) where d30, ΔP, dn and α (=46˚C) represent mean volume diameter, pressure drop between the nozzle pressure and the spray chamber pressure, the nozzle diameter and the nozzle spray angle respectively. The mean velocity, uo of the spray droplets impinging on the test surface was calculated by using following equation [13]. Figure 2. Sketch of the stainless steel test blocks. Figure 3. Holder assembly of heated samlpe.  M. Aamir et al. ( ) 0.5 230 2/12 /2 ojl l uuPv dgx ρρ = +∆−− ( 2) where uj, v, ρl, g, and x represent spray velocity at nozzle exit, surface tension of the fluid, density of fluid, gra- vitational acceleration and nozzle to surface distance respectively. uj can be calculated by simplifying Bernoulli equation [14] (3) where Pn represents nozzle pressure. The Sauter mean diameter (SMD), d32 was estimated by using the estimate d32=0.8MVD [13]. The SMD, d32 was used to calculate the spray Weber number, We which was defined as, ( 4) By using the theoretical model proposed by [1], following equation relates critical droplet size (D0,cr) with steel plate thickness (δplate) while steel plate was sprayed cooled from one side. (Cooling load for UFC) = (Heat removed per droplet) × (Surface renewal rate) × (Site density) ( ) ( ) ( ) lg ( )/1/ p Platedlevap UFC ACdT dtmhtA N δρ −=× ××× (8) Based on the energy balance, evaporation rate of a droplet can be expressed as, (9) Using expression for hemispherical droplet contact area with plat surface and expression for its mass we can get, ( )() 23 / 2/3 nethemihemi lfg qrd dtrh π πρ ″ =− (10 ) Derivation and simplification of Equation (10) results, / /2 heminetl fg drdtqhB ρ ″ −= = (11) where is defined as (12) Integration of Equation (11) results in an expression for droplet evaporation time as, 0, 00, 0, 0, 0 2 evap hemi themi hemi hemihemievap evap r rD drB dtrBttBB −=⇒ =⇒== ∫∫ ( 13 ) Simplifying Equation (8) for 1 m2 steel strip surface and using the definition of and from Equa- tions (10) and (13), we get, ( ) ( )() 32 00, 0, 21 6 pplatelfg plate UFC hemi hemi dT B C Dh dtD D π ρ σρ −= ×× (14) Substituting definition of B from Equation (11) and using the equality between the volume of spherical and hemi spherical droplet i.e. 33 3 0,0 0,0 2 12 6 hemi hemi DDD D ππ =⇒= (15 ) Equation (14) can be rearrange as ( ) ( ) " 12 pplate net plate UFC dT Cq dt π ρσ −= (1 6) Using Equation (10) and basic definition of and , Equation (16) can be expressed as ( ) ( ) ( ) ( 2/3 4/344 0 0, //12[/ pPlatev surfacewcrsurfacew UFC Plate CdTdtkTTCDTT ρ δπσ −= −+− (17) where, ( ) " 44 radsurface w q TT σ = − (18)  M. Aamir et al. ( ) "v surfacew cond kT T qe − = (19) Where e is vapor film thickness and estimated by using equation (20) as in [15]. ( ) 1/3 1/3 4/3 4/3 200 0 () v vlsurface w fg v kT g eDeC TTD h µρ ρν ∆⇒= ×− (20) The coefficient is given as [15], 2 1/3 v ( /) ovlfgv Ckgh v µρ ρ = (21) As the radiative heat flux is negligible, so ignoring radiative heat flux term, and rearranging Equation (17) we get: ( ) ( ) ( ) ( ) () 2/3 4/3 0, 0 [/12(/)//] Plate crvpsurfacew UFC Plate DkCCdT dtTT δπ ρ = −− (22) The condition Do=2a is satisfied and capillary length, a is defined as a = (v/gρl)1/2. The estimated value of coefficient Co for stainless steel was 0.1375 at an average surface temperature of 750˚C which is well above the Liedenfrost temperature of water. The surface material does not affect droplet evaporation time in film evapora- tion regime [15]. Using the standard values of parameters, Equation (22) for constant super heat of 725˚C can now be simplified as: 4/3 9 0, 12.8510 Plate cr D δ − = × (23) By expressing drop diameter in µm, and plate thickness in mm, Equation (23) takes the form: ()( ) 4/3 0, 12.85 Plate cr mm Dm δµ = (24) 4. Result and Discussion 4.1. Cooling Histories at Different Inlet Pressures and Surface Temperature Figure 4 showed the cooling histories of stainless steel sample of thickness, δ = 13 mm under different inlet pressure of the while using water as coolant. Considerable variation in the cooling histories can be observed with the change in the inlet pressure of the fluid. Cooling time required to bring the sample initially at a high temperature to fluid temperature varies with inlet pressure. By increasing the inlet pressure of the fluid, the mean velocity, uo of the spray droplets impinging on the test surface increases as well as the droplet size decreases. These two important parameters have significant effect on the cooling history of the tests block. Initial increase in the inlet pressure, shorten the time required to cool the test surface to fluid temperature. Shorten cooling time trend can easily be observed in Figures 4(a)-(d). After a threshold inlet pressure of 0.8 MPa, cooling time has as increasing trend with some exceptions (Figure 4 (g). The exceptional case can be explained by considering the effect of mean droplet velocity and droplet diameter on the cooling performance of the fluid. Small size droplets are more efficient in removing the heat from a hot surface while it is needed for such droplet to have sufficient residing time on the hot surface to absorb heat from the surface to fully evaporate. On the other hand, in present study, droplet size is decreased by increasing the inlet pressure of the fluid, which in response increases the mean droplet velocity. To a certain inlet pressure, mean droplet velocity has positive effect in decreasing the cooling time of the target surface with decreasing mean droplet size. But after a critical value of pressure, the mean velocity has negative effect on cooling time due to the fact the residing time of the droplet on the hot sur- face decreases with increasing velocity of the droplet. Another factor which affects the cooling efficiency of the droplet is the splashing and rebound of the droplet from the surface due higher pressure and velocity of the droplet which have negative impact on the residing time of the droplet on the surface. 4.2. Critical Droplet Diameter and Surface Super Heat Using the mathematical model in Equation (22) for a hypothetical cooling rate of 300˚C/s, an estimation of crit- ical droplet diameter at different surface super heat for samples of varying thickness is shown in Figure 5. It is  M. Aamir et al. 05 10 1520 25 0 50 100 150 200 250 300 350 400 450 500 550 600 650 700 750 800 850 Temperature ( o C) Time (s) 100 o C 200 o C 300 o C 400 o C 500 o C 600 o C 700 o C 800 o C (a) 05 10 15 20 25 0 50 100 150 200 250 300 350 400 450 500 550 600 650 700 750 800 850 Temperature ( o C) Time (s) 100 o C 200 o C 300 o C 400 o C 500 o C 600 o C 700 o C 800 o C ( b) 05 10 15 20 25 0 50 100 150 200 250 300 350 400 450 500 550 600 650 700 750 800 850 Temperature ( o C) Time (s) 100 oC 200oC 300oC 400oC 500oC 600oC 700oC 800oC (c) 05 10 1520 25 0 50 100 150 200 250 300 350 400 450 500 550 600 650 700 750 800 850 Temperature ( o C) Cooling Time (s) 100 o C 200 o C 300 o C 400 o C 500 o C 600 o C 700 o C 800 o C ( d) 05 10 15 20 25 0 50 100 150 200 250 300 350 400 450 500 550 600 650 700 750 800 850 Temperature ( o C) Cooling Time (s) 100 o C 200 o C 300 o C 400 o C 500 o C 600 o C 700 o C 800 o C (e) 05 10 15 20 25 0 50 100 150 200 250 300 350 400 450 500 550 600 650 700 750 800 850 Temperature ( o C) Cooling Time (s) 100 o C 200 o C 300 o C 400 o C 500 o C 600 o C 700 o C 800 o C (f) 05 1015 20 25 0 50 100 150 200 250 300 350 400 450 500 550 600 650 700 750 800 850 Temperature ( o C) Cooling Time (s) 100 o C 200 o C 300 o C 400 o C 500 o C 600 o C 700 o C 800 o C (g) 05 10 15 20 25 0 50 100 150 200 250 300 350 400 450 500 550 600 650 700 750 800 850 Temperature ( o C) Cooling Time (s) 100 o C 200 o C 300 o C 400 o C 500 o C 600 o C 700 o C 800 o C ( h)  M. Aamir et al. 05 10 15 2025 0 50 100 150 200 250 300 350 400 450 500 550 600 650 700 750 800 850 Temperature ( o C) Cooling Time (s) 100 o C 200 o C 300 o C 400 o C 500 o C 600 o C 700 o C 800 o C (i) Figure 4. Cooling histories (a) 0.2 MPa, (b) 0.4 MPa, (c) 0.6 MPa, (d) 0.8 MPa, (e) 1.0 MPa, (f) 1.2 MPa, (g) 1.4 MPa, (h) 1.6 MPa, (i) 1.8MPa. clear from the Figure 5. The critical droplet size for a required cooling rate increases with increasing surface super heat. 4.3. Critical Droplet Diameter and Thickness of the Sample Figure 6 shows the variation of critical droplet diameter of the fluid droplets impinging on the test surface in- itially maintain at an elevated surface temperature. Critical droplet diameter decreases with the increase in the thickness of the sample. In other words, a specific cooling rate can be maintained at the expense of energy to produce smaller droplets. Mathematical model has its application limitations. 4.4. Effect of Inlet Pressure on Velocity and Diameter of the Droplet Figure 7 is the manifestation of effect of inlet pressure on the velocity of the droplet in current study. Velocity of the droplet is a dominant parameter in spray cooling studies which affect the cooling performance of the spray along with the size of the impinging droplets already discusses in Section 4.1. An exponential increase in the mean velocity, uo, and nozzle exit velocity, uj, is observed with increasing inlet pressure. At low pressure, uo and uj have values very close to each other, but as the inlet pressure increases the two curves move more apart from each other, showing the dominance of mean spray velocity, uo over nozzle inlet velocity, uj. As the inlet pressure of the fluid increases at the nozzle exit, the size of the droplets decreases. Mean volume diameter (MVD) and Sauter mean diameter (SMD) are two important characteristics of the spray. MVD and SMD decreases with the increase in the inlet pressure as shown in Figure 8. 4.5. Effect of Inlet Pressure and Surface Temperature on Cooling Rate As it is clear from Figures 7 and 8 that inlet pressure has a dominant effect on the droplet size and velocity, so it is obvious that inlet pressure will also affect the cooling rate of the sample. The effect of inlet pressure on the cooling rate of the sample is shown in Figure 10. Cooling rate increases with the increase in the inlet pressure until 0.8 MPa. When inlet pressure is further increased to 1.0 MPA, a sudden decrease in the cooling rate is ob- served. Further increase in the inlet pressure shows little effect on the cooling rate. This behavior can be ex- plained by considering the combining effect of the droplet size and droplet velocity on the cooling performance of the spray. In the lower pressure range, increasing droplet velocity along with depressing droplet size helps the droplet to penetrate through the insulting vapor film, developed at the heated surface due to evaporation of the fluid, causing effective contact between the droplet and the heated surface. As a result of an effect contact be- tween the surface and the droplet results in a better cooling performance of spay, which results in an increased cool rate. At higher pressure range, there is a negative effect of velocity on the effective contact time of droplet to the heated surface. Effective contact time of the droplet decreases with increasing velocity of the droplet, which in return decreases the cooling efficiency of the spray. Another aspect, which might have a significant cause of lower cooling rates at higher pressure range, is relatively small droplet size. High temperature 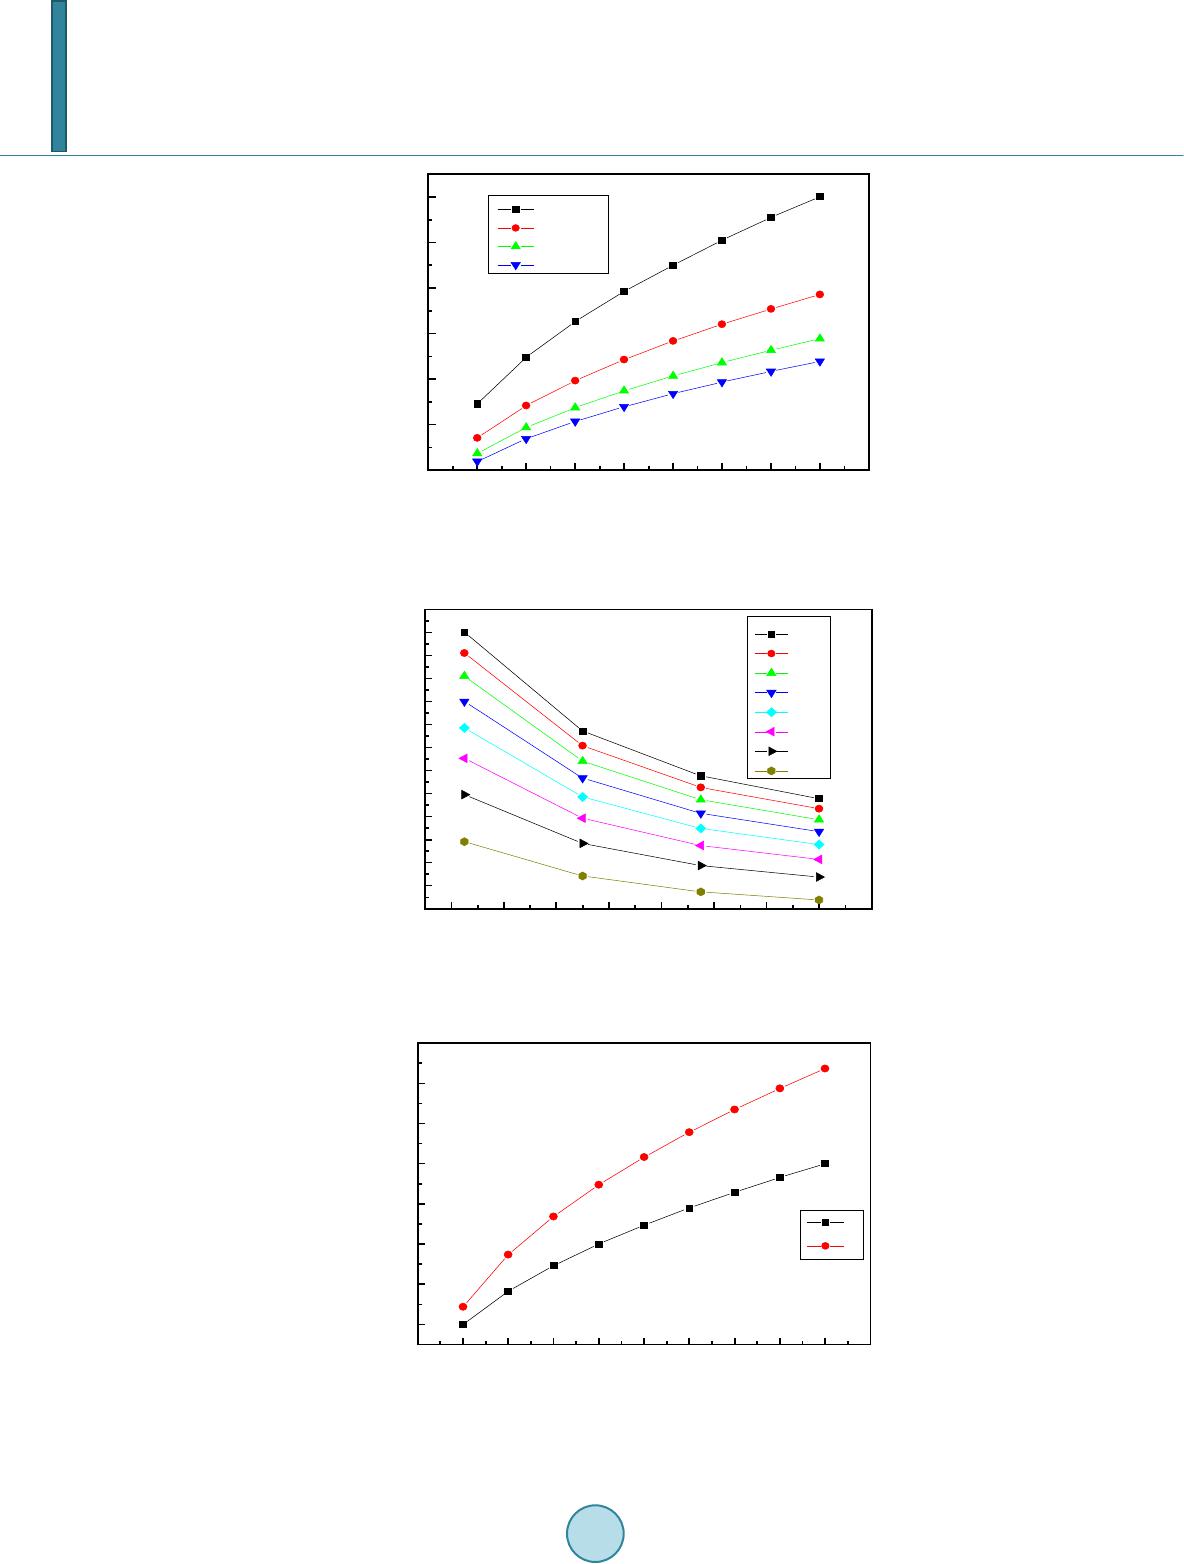 M. Aamir et al. 0100 200 300 400 500 600700 800 900 20 40 60 80 100 120 140 Critical Diameter ( µm ) Surface Super Heat ∆T (oC) δ=8.5mm δ=13mm δ=17.5mm δ=22mm Figure 5. Variation of critical droplet size with surface super heat of the sample. 810 12 14 16 1820 22 24 20 30 40 50 60 70 80 90 100 110 120 130 140 150 Droplet Diameter (µm) Thickness (mm) 800 o C 700 o C 600 o C 500 o C 400 o C 300 o C 200 o C 100 o C Figure 6. Variation of critical droplet diameter with thickness of the sample. 0.0 0.2 0.4 0.6 0.8 1.0 1.2 1.4 1.6 1.8 2.0 20 30 40 50 60 70 80 90 Velocity (m/s) Pressure (MPa) u j u o Figure 7. Variation of mean velocity, uo, spray velocity at nozzle exit, uj, with inlet pressure. 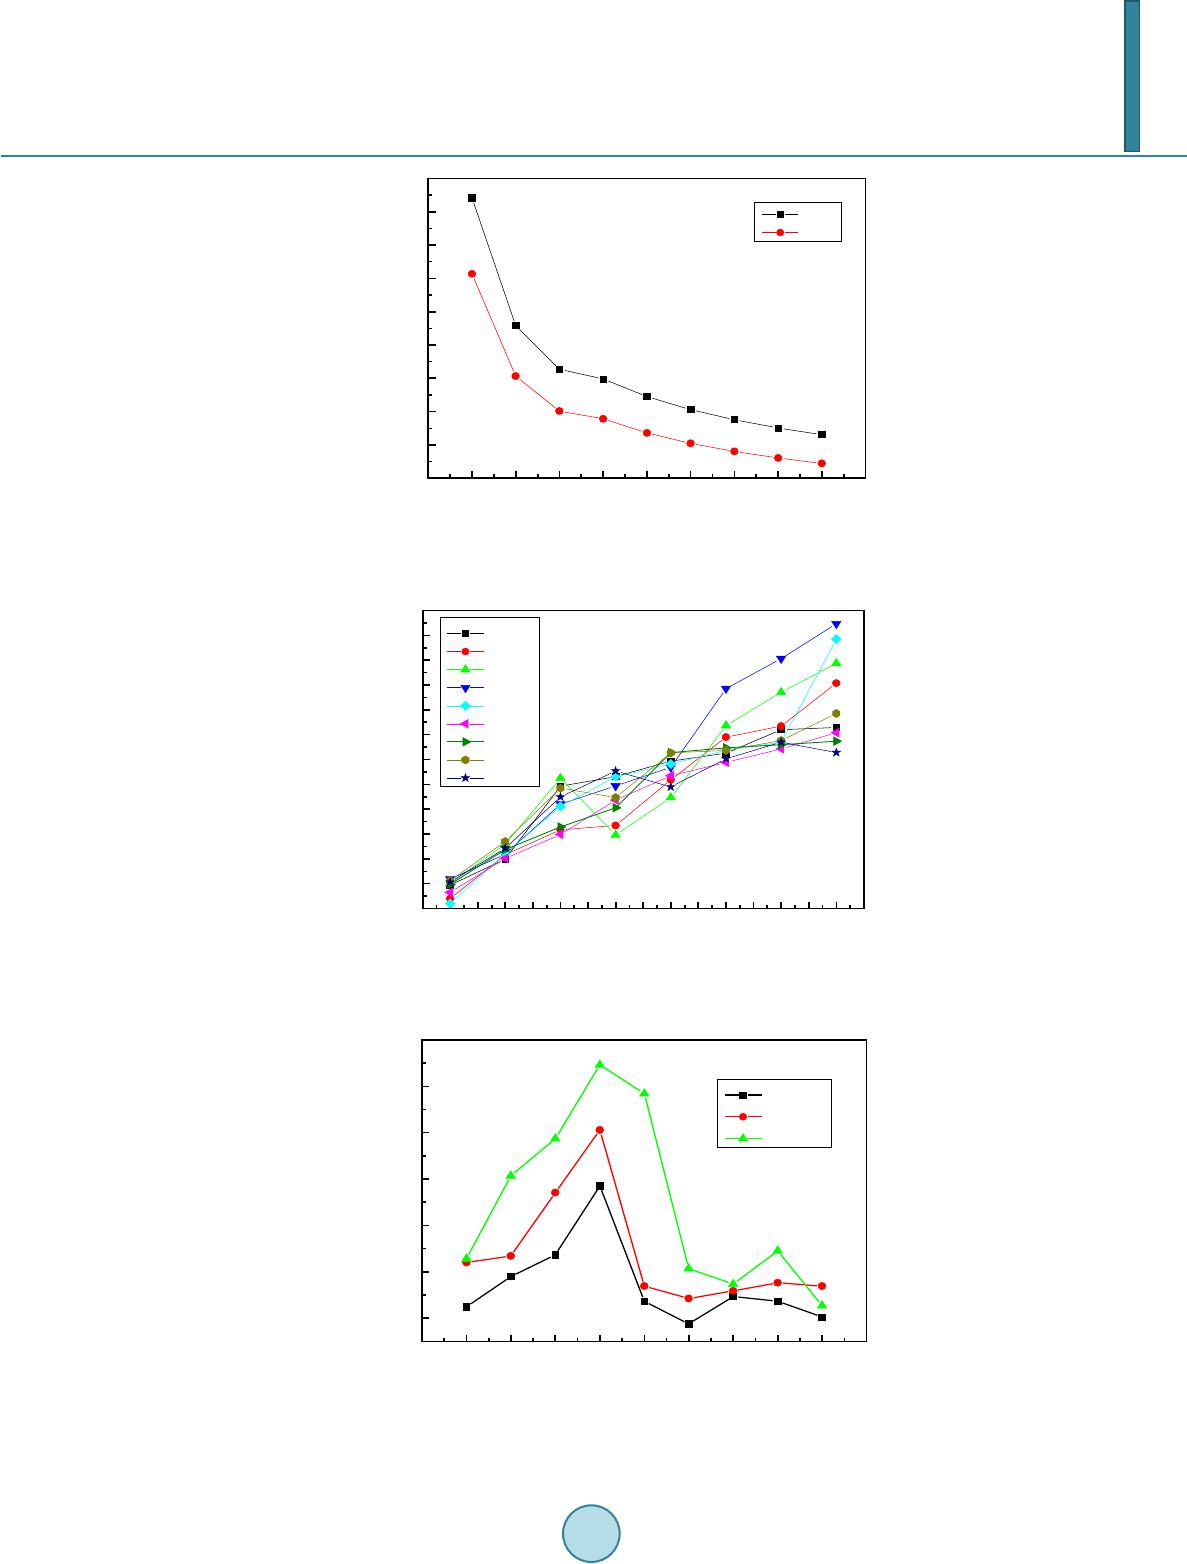 M. Aamir et al. 0.0 0.2 0.4 0.6 0.8 1.0 1.2 1.4 1.6 1.8 2.0 300 400 500 600 700 800 900 1000 1100 1200 Droplet Diameter (µm) Inlet Pressure (MPa) MVD SMD Figure 8. Effect of inlet pressure on droplet mean volume diameter (MVD) and Sauter mean diameter (SMD). 50100 150 200 250 300 350 400 450 500 550 600 650 700 750 800 850 0 50 100 150 200 250 300 350 400 450 500 550 600 Cooling Rate (oC/ s) Surface Super Heat (∆T ( o C)) 0.2MPa 0.4MPa 0.6MPa 0.8MPa 1.0MPa 1.2MPa 1.4MPa 1.6MPa 1.8MPa Figure 9. Variation of cooling rate with surface super heat for differ- ent inlet pressure. 0.0 0.2 0.4 0.6 0.8 1.0 1.2 1.4 1.6 1.8 2.0 300 350 400 450 500 550 600 Cooling Rate ( o C/s) Inlet Pressure (MPa) ∆Τ=600 ο C ∆Τ=700 ο C ∆Τ=800 ο C Figure 10. Effect of in let pressure on cooling rate for different sur- face super heat.  M. Aamir et al. (600oC~800oC) of hot surface may cause the droplets of very small size to evaporate at vapor film surface before effective and actual contact of droplet with the hot surface. Earlier evaporation of droplets at the vapor film sur- face might be another cause of decrease in the cooling rate at higher inlet pressure range. It is obvious that cooling rate of the sample increases as the surface super heat increases as shown in Figure 9. 5. Conclusions Present study examined the problem of ultra fast spray quenching of stainless steel plates of varying thickness under varying spraying conditions. It is concluded from the present study that: Water Spray cooling can be used as an alternative of jet impingement cooling to achieve very high strip cooling rate in the range of Ultra Fast Cooling (UFC) in steel manufacturing industry. 1) Cooling time to cool the hot sample to fluid temperature decreases considerably with increasing inlet pres- sure of the fluid to certain critical value of pressure. Very high pressure has no significant effect on the cooling efficiency of the spray. 2) Theoretical model predicts that smaller droplets can be more efficient to achieve higher cooling rates for thicker samples at low wall super heat. 3) Spray mean velocity, nozzle exit velocity increases while MVD and SMD decreases with increasing inlet pressure 4) For a given nozzle type there exist a critical inlet pressure at which maximum rates are achieved. At an in- let pressure of 0.8 MPa, maximum cooling rates of 424.2˚C/s, 502.81˚C/s and 573.1˚C/s were achieved for ΔT = 600˚C, 700˚C and 800˚C respectively. Acknowledgements Authors are grateful for the support by the State Key Development Program for Basic Research of China (Grant No. 2012CB720403); National Natural Science Foundation of China (No. 50906102); SRF for ROCS, SEM ([2010]1561), Natural Science Foundation of Chongqing, China (No. CSTC2011jjA90015). Nomenclature A Surface area of the sample (m2) a Capillary length (m) B Constant in eq. 9 Co Coefficient in eq. 12 Cp Specific heat capacity (J/kg K) Do Initial diameter of droplet (µm) Do,cr Critical droplet diameter (µm) dn Nozzle orifice diameter (mm) e Vapor film thickness g Acceleration due to gravity (m/s2)) hfg Latent heat of evaporation (J/kg) k Thermal conductivity mdl Mass of droplet (kg) N Number of droplets per unit area of plate (m-2) Pn Nozzle pressure (MPa) q″ Heat flux (W/m2) Tsurface Surface Temperature Tsat Water saturation temperature Tw Working temperature of water tevap Droplet evaporation time (s) Greek Letters: α Nozzle Spray angle (˚C) ρ Density (kg/m3)  M. Aamir et al. µ Viscosity (kg/ms) v Surface tension (N/m) δplate Thickness of test plate (mm) σ Stefan-Boltzmann constant (W/m2 K4) φ Diameter of thermocouple hole Subscripts: cr Critical cond Co nductio n d Droplet hemi Hemispherical l Liquid n Nozzle o Initial rad Radiation w Water sat Satu ration v Vapor References [1] Bhattacharya, P., Samanta, A.N. and Chakraborty, S. (2009) Spray Evaporative Cooling to Achieve Ultra-Fast Cooling in Run Out Table. International Journal of Thermal Sciences, 48, 1741-1747. http://dx.doi.org/10.1016/j.ijthermalsci.2009.01.015 [2] Selvam, R.P., Lin, L. and Ponnappan, R. (2006) Direct Simulation of Spray Cooling: Effect of Vapor Bubble Growth and Liquid Droplet Impact on Heat Transfer. International Journal of Heat and Mass Transfer, 49, 4265-4278. http://dx.doi.org/10.1016/j.ijheatmasstransfer.2006.05.009 [3] Yang, J., Chow, L.C. and Paris, M.R. (1996) Nucleate Boiling Heat Transfer in Spray Cooling. Journal of Heat Trans- fer, 118, 668-671. http://dx.doi.org/10.1115/1.2822684 [4] Lucas, A., Simon, P., Bourdon, G., Herman, J. C. , Riche, P., Neutjens, J. and Harlet, P. (2004) Metallurgical Aspects of Ultra Fast Cooling in Front of the Down-Coiler. Steel Research, 75, 139-146. [5] Hatta, N. and Osakabe, H. (1989) Numerical Modeling for Cooling Process of a Moving Hot Plate by a Laminar Water Curtain. ISIJ International, 29, 919-925. http://dx.doi.org/10.2355/isijinternational.29.919 [6] Ravikumar, S. V., Jha, J.M., Sarkar, I., Mohapatra, S .S. , Pal, S.K. and Chakraborty, S. (2013) Achievement of Ultrafast Cooling Rate in a Hot Steel Plate by Air-Atomized Spray with Different Surfactant Additives. Experimental Thermal and Fluid Science, 50, 79-89. http://dx.doi.org/10.1016/j.expthermflusci.2013.05.007 [7] Cox, S.D., Har dy , S.J. and Parker, D.J. (2001) Influence of Runout Table Operation Setup on Hot Strip Quality, Sub- ject to Initial Strip Condition, Heat Transfer Issues. Iron Making & Steel Making, 28, 363-372. http://dx.doi.org/10.1179/irs.2001.28.5.363 [8] Han, B., Liu, X.H., Wang, G.D. and Sh e, G.F. (2005) Development of Cooling Process Control Technique in Hot Strip Mill. Journal of Iron and Steel Research International, 12, 12-16. [9] Mohapatra, S.S., Ravikumar, S.V., Andhare, S., Chakraborty, S. and Pal, S.K. (2012) Experimental Study and Optimi- zation of Air Atomized Spray with Surfactant Added Water to Produce High Cooling Rate. Journal of Enhanced Heat Transfer, 19, 397-408. http://dx.doi.org/10.1615/JEnhHeatTransf.2012004285 [10] Wendelstorf, J., Spitzer, K.H. and Wendelstorf, R. (2008) Spray Water Cooling Heat Transfer at High Temperatures and Liquid Mass Fluxes. International Journal of Heat and Mass Transfer, 51, 4902-4910. http://dx.doi.org/10.1016/j.ijheatmasstransfer.2008.01.032 [11] Karwa, N., Gambaryan-Roisman, T., Stephan, P. and Tropea, C. (2011) A Hydrodynamic Model for Sub Cooled Liq- uid Jet Impingement at the Leiden Frost Condition. International Journal of Thermal Sciences, 50, 993-1000. http://dx.doi.org/10.1016/j.ijthermalsci.2011.01.021 [12] Hsieh, S.S. , Fan, T.C. and Tsai, H.H. (2004) Spray Cooling Characteristics of Water and R-134a. Part I: Nucleate Boiling. International Journal of Heat and Mass Transfer, 47, 5703-5712. http://dx.doi.org/10.1016/j.ijheatmasstransfer.2004.07.022 [13] Ciofalo, M., Caronia, A., Di Liberto, M. and Pu leo, S. (2007) The Nukiyama Curve in Water Spray Cooling: Its Deri- vation from Temperature-Time Histories and Its Dependence on the Quantities That Characterize Drop Impact. In te r-  M. Aamir et al. national Journal of Heat and Mass Transfer, 50, 4948–4966. http://dx.doi.org/10.1016/j.ijheatmasstransfer.2007.09.022 [14] Santangelo, P.E. (2010) Characterization of High-Pressure Water-Mist Sprays: Experimental Analysis of Droplet Size and Dispersion. Experimental Thermal and Fluid Science, 34, 1353-1366. http://dx.doi.org/10.1016/j.expthermflusci.2010.06.008 [15] Biance, A.L., Clanet, C. and Quere, D. (2003) Leidenfrost Drops. Physics of Fluids, 15, 1632-1637. http://dx.doi.org/10.1063/1.1572161
|