 HEALTH, 2009, 1, 8-16 Published Online June 2009 in SciRes. http://www.scirp.org/journal/health Studies on biological effect of lycopene on Hippocampus of hyperlipemia rats Yao-Chi Zeng1,4, Min-Yu Hu1*, Shu-Lin Qu2, Liang Zeng3 1Department of Nutrition and Food Hygiene, School of Public Health, Central South, University, Changsha, 410078, China. (Yao-chi ZENG, E-mail:0731zyc@163.com), 2The Medical College of Hunan Normal University, Changsha, 410006, China, 3Tumor Hospital of Hunan Province, Changsha, 410006, China, 4Shenzhen Nanshan Health Bureau, Shenzhen, 518059, China; *Corresponding author: Prof. Min-Yu Hu, Ph.D, Department of Nutrition and Food Hygiene, Tel & Fax: +86-731-4805452, School of Public Health, Central South, University, Changsha , Hunan 410078, P. R. China. (E-mail: huminyu@xysm.net) Received 13 April 2009; revised 1 May 2009; accepted 7 May 2009. ABSTRACT Objective: This study investigated into the ef- fect of lycopene on expression of APP, bax and bcl-2 in hippocampal CA1 region of rats with hyperlipidemia. Methods: By total cholesterol (TC) and body weight, 48 adult male SD rats were randomized into six groups, a normal control group, fed with basic feed; a high-fat model group, fed with high-fat feed; a positive drug control group, fed with high-fat feed and administrated with fluvastatin sodium at a dose of 10 mg·kg·bw-1·d-1 by gastric perfusion; and lycopene groups at three dose levels, fed with high-fat feed and administrated with lycopene at doses of 11, 22 and 44 mg·kg·bw-1·d-1 respec- tively also by gastric perfusion. Caudal venous blood samples of rats in all groups were taken at week 0, week 1 and week 3 after the experiment started so as to assay TC, TG, LDL-C and HDL-C; at the end of the experiment, rat brains were taken and sections of the hippocampal CA1 re- gion were prepared. Expression of APP, bax and bcl-2 in the CA1 region was determined by im- munohistochemical methods and morphologi- cal examination was carried out. Results: One week after fed with high-fat feed, models of hy- perlipidemia rats were established; at the end of experiment, hippocampal APP and bax expres- sion was enhanced while bcl-2 expression was significantly weakened (p<0.05); to rats with hyperlipidemia, both lycopene and fluvastatin sodium could reduce TC, TG and LDL-C, inhibit expression of hippocampal APP and bax and promote expression of bcl-2 (p<0.05). Conclu- sion: Lycopene down-regulates the expression of bax and up-regulates that of bcl-2 mainly by reducing serum TC and LDL-C and weakening expression of APP in the hippocampal CA1 re- gion of rats with hyperlipidemia, thereby main- taining normal morphology of hippocampal neurons and facilitating the protection of the brain. Keywor ds: lycopene; hyperlipidemia; hippocampus; APP; bax; bcl-2 1. INTRODUCTION Lycopene is a potent singlet oxygen scavenger and has the effect of preventing free radical injuries. Studies have shown that it has many important bioactivities, e.g., quenching singlet oxygen, eliminating reactive oxygen species, blocking lipid peroxidation, suppressing cell reproduction, reinforcing immunity, and inducing gap junction intercellular communication [1,2,3,4]. Both epidemiological and laboratorial studies suggest that lycopene, a powerful antioxidant agent, can reduce the risk of cardiovascular diseases [5,6]. Early studies indi- cate that lycopene can effectively lower levels of serum TC, TG and LDL-C of rabbits with artherosclerosis in- duced with high fat and inhibit atherogenesis with an effect equivalent to that of fluvastatin [7,8]. As is sug- gested by studies, hyperlipidemia can cause injuries to the brain. Rise of blood cholesterol may harm endothe- lial cells of cerebral arteries and capillaries, accelerate progress of atherosclerosis and slow cerebral blood flow, thereby injuring cerebral metabolism and increasing risks of cognitive function impairment and dementia. In addition, blood cholesterol increase may also directly lead to neuronal degeneration related to cognitive func- tion. The biological mechanism [9] may be that blood cholesterol increase affects APP metabolism of neurons  Y. C. Zeng et al. / HEALTH 1 (2009) 8-16 9 SciRes Copyright © 2009 HEALTH and accelerates production and sediment of Aβ, thereby leading to cognitive function impairment. Every 10% increase of blood cholesterol can double the quantity of Aβ plaques in the brain [10]. Morphological changes of cranial neurons and decrease of cognitive ability both correlate with Aβ increase. Aβ can also mediate disor- ders of signal transduction pathways and lead to apop- tosis in the end [11]. Lycopene can penetrate the blood-brain barrier and be present in the central nervous system [12]. Charu K. et al found that after eight weeks’ feeding with lycopene at a dose of 10μg.kg.bw-1, this substance became detectable at various concentrations from blood and tissue of mice and the lycopene concen- tration in the brain tissue was 9.24±3.19 ng.g-1 wet tis- sues, indicating that lycopene taken from food can pass through the blood-brain barrier and reach the brain tissue [13]. Studies carried out by Foy CJ et al. [14] showed that deficiency of a series of anti-oxidation nutrients including lycopene is related to such neurodegenerative diseases as Parkinson’s disease, vascular dementia, Alz- heimer disease, etc. To sum up, hyperlipemia can impair the brain tissue, while lycopene has blood lipid lowering action and can pass through the blood-brain barrier, so we think lycopene has protective effect on brains of hy- perlipemia rats. In this study, hyperlipidemia animal models were es- tablished by feeding rats with high-fat feed and then, lycopene was administrated to see its effect on serum lipid and expression of APP, bax and bcl-2 in the hippo- campal CA1 region of the subject animals so as to inves- tigate into the possible protective effect of lycopene on the hippocampus. 2. MATERIALS AND METHODS 2.1. Formulation and Supply of High-Fat Feed Basic feed comprising wheat (20%), rice (20%), corn (10%), bean cake (24%), fish flour (10%), wheat bran (10%), salt (1%), bone meal (2%), milk powder (2) and multivitamins (1%) was prepared by Experimental Zo- ology Division, Xiangya Medical College of Central South University. The content of protein in the feed was 19% assayed by Kjeldah method. High-fat feed: Animal models were established with reference to the method adopted by Deepa et al [15] us- ing high-fat feed containing basic feed (94.5%), choles- terol (4%), cholic acid (1%) and propylthiouracil (0.5%). 2.2. Apparatus and Reagents Amyloid precursor protein (APP) rabbit anti-mouse polyclonal antibodies (Lot: 20080601) were purchased from Wuhan Boster Bioengineering Co., Ltd; bax and bcl-2 rabbit anti-mouse polyclonal antibodies and DAB color development kits were all produced by Beijing Zhong Shan-Golden Bridge Biological Technology Co., Ltd and were expected to expire in July of 2009. Lyco- pene powder with a purity of 90% (Lot: 041202) was obtained from North China Pharmaceutical Co., Ltd. Fluvastatin sodium capsules (Lot: X0006) were supplied by Novartis AG. Kits of serum lipid indexes were pro- duced by BioSino Bio-technology and Science Inc. Other instruments used in the study included a TP1020 auto dehydrating machine for organic tissue (Germany Leica), a ZT-14s staining machine (Yaguang, Xiaogan of Hubei), a Finesse325 common paraffin section machine (Thermo Shandon) and a BX40 light microscope (Olympus). Fluvastatin is used together with lifestyle changes (diet, weight-loss, exercise) to reduce the amount of cholesterol (a fat-like substance) and certain other fatty substances in the blood. Fluvastatin is in a class of medications called HMG-CoA reductase inhibitors (statins). It works by slowing the production of choles- terol in the body. Fluvastatin sodium is an approved lipid lowering drug having passed numerous animal experi- ments and widely applied to the clinic. In animal ex- periments, the optimal dose for rats and rabbits is 10mg. kg-1 [16,17]. 2.3. Animals and Grouping 48 adult male SD rats, weighing 195±10 g, were sup- plied by Experimental Zoology Division, Xiangya Medical College of Central University. After adaption feeding for one week with the basic feed, the animals were weighed on an empty stomach and caudal blood was taken to assay serum TC. Then, according to the body weight and TC level, the rats were divided ran- domly into six groups, each containing eight, and caged by two. Arranged were a normal control group (C), fed with basic feed; a high-fat model group (F), fed with high-fat feed; a positive drug control group (FF), fed with high-fat feed and administrated with fluvastatin sodium at a dose of 10 mg·kg·bw-1·d-1; and lycopene groups at three dose levels (FL1, FL2 and FL3), fed re- spectively with high-fat feed and administrated with lycopene at doses of 11, 22 and 44 mg·kg·bw-1·d-1. During the experiment, except group C, which was fed with basic feed, all groups were fed with high-fat feed. In the second week of the experiment, 1% CMC-Na solvent was administrated to group C and group F by gastric perfusion, and fluvastatin sodium and lycopene powder with 1% CMC-Na as the solvent were adminis- trated, also by gastric perfusion, to animals in other groups at the designed doses (the gastric administration volume was 1 ml·d-1 for rats in all groups). The animals were allowed to drink freely and their daily food intakes were recorded. The temperature and relative humidity were respectively controlled at 25±2℃ and 60%~70%. The rats were weighed twice a week and the gastric ad- ministration volumes of fluvastatin sodium and lycopene  10 Y. C. Zeng et al. / HEALTH 1 (2009) 8-16 SciRes Copyright © 2009 HEALTH were adjusted according to the body weights. However, since the dose relative to body weight remained constant, gastric administration was performed according strictly to the designed doses. All experimental procedures were conducted in accordance with the guidelines of the ani- mal ethical committee for animal experimentation in China. 3. METHODS 3.1. Specimen Collection At the ends of week 0, week 1 and week 3 of the ex- periment, the animals were fasted for 12h and then, their tails were cut; blood samples were taken to assay the levels of serum TC, TG, LDL-C and HDL-C. At the end of the experiment, pentobarbital sodium at a dose of 40mg.kg. bw-1 was administrated by peritoneal injection to anesthetize the animals, and then, the animals were deeply anesthetized and perfused via left ventricular with 0.9% saline followed by 4% paraformaldehyde (20ml/min for 5 min). Following decapitation, the brains were removed. After the cerebral meninges was stripped, the brains was fixed in 10% formaldehyde solution .And 24h later, the specimen was cut with a coronal-shaped opening about 5mm in front of the posterior extremity of the biparietal suture; from the plane of the hippocampus and the dentate band under macroscopic observation, a tissue piece about 1cm thick was cut in the direction of the procerebrum and imbedded with paraffin. The cor- onal plane was cut continuously to produce eight sec- tions with a thickness of 4μm for each rat. According to the preparation order, sections of each group were di- vided into eight sets. Immunohistochemical staining was applied to sections of the 1st, 2nd, 4th, 5th, 6th and 8th sets, while HE routine staining was applied to the 3rd and 7th sets. 3.2. Assay Methods Serum TG and TC were analyzed by enzymatic methods of glycerol phosphate oxidase-peroxidase- 4- aminoan- tipyrine (GPOPAP) and cholesterol oxidase-peroxidase- 4-aminoantipyrine (CHOD-PAP) respectively) [18]. Concentrations of HDL-C were determined in the su- pernatant after precipitation of lipoprotein-B using phosphototungstic acid/Mg2+ (PTA/Mg2+), and the con- centrations of LDL-C were calculated as described by Friedewald et al. [19]. All the operation procedures were carried out according to instructions of the kits. Immu- nohistochemical SABC [20] or HE staining of the histo- logical sections was performed to detect APP, bax and bcl-2 positive particles and pathological changes of the hippocampal CA1 region. The principal procedures in- cluded paraffin section deparaffinage and dehydration; 3% H2O2 incubation for 20min; phosphate buffer (PBS) washing; microwave treatment in 0.01mol/L citrate buffer for antigen retrieval; blocking serum application and incubation for 20min; primary antibody application and incubation at 37℃ for 1-2h; horse radish peroxidase labeled secondary application and incubation for 15min; color development with diaminobenzidine (DAB) solu- tion; hematine counterstaining; dehydration; mounting; and light microscopic observation. For the negative con- trol, the operation was basically the same as that for the test groups except that the primary antibody was substi- tuted by phosphate buffer. Presence of brown-yellow particles in the nucleus or the endochylema was consid- ered as indication of positive results. Under a 400× high power lens, 10 fields of view without edge overlap were selected randomly for each section (five fields of view for the hippocampal CA1 region of each side, each field being about 0.075 squm) to count positive particles in each high power field. The number of positive particles was calculated by the following formula: number of positive particles = (the total number of positive cells/the total number of cells)/10 (the number of fields of view). The result was expressed as the mean [21]. Pictures were taken. 3.3. Quality Control All glassware used for the experiment were soaked in a sulfuric acid solution of potassium bichromate for 24h, washed clean with deionized water, rinsed with redis- tilled water for three times and then dried for use. A cer- tain quantity of paraffin sections was drawn for prelimi- nary experiment of immunohistochemical staining so as to elicit the optimal experimental conditions. Lycopene was dissolved in 1% CMC-Na and the gastric admini- stration solution was freshly prepared before use. 3.4. Statistical Methods The data were analyzed with SPSS13.0 software and all measurement data were expressed as mean ± standard deviation (x±S). Analysis of variance was used for group comparisons. Statistical analyses were performed using analysis of variance for mean comparison of mul- tiple samples, S-N-K and LSD tests for paired compari- son, and analysis of variance of data of replicate meas- urements for comparison of different experiment inter- vals. Kruskal-Wallis H test and Spearman correlation analysis were applied to data in non-normal distribution, which were also tested by Nemenyi method of paired comparison. The level of statistical significance for all analyses was set at α=0.05. 4. RESULTS 4.1. General Conditions and Body Weight Changes of Rats During the experiment, rats of all groups exhibited nor- mal activities and had smooth and glossy fur as always.  Y. C. Zeng et al. / HEALTH 1 (2009) 8-16 11 SciRes Copyright © 2009 No significant difference was found in body weight in all groups with the exception of group C at all time points during the experiment (P>0.05). Analysis of vari- ance of replicate measurements showed that, in different stages, body weights of the animals in all groups have significant difference (P<0.05). 4.2. Serum Lipid Index Changes of Rats in Different Stages HEALTH Analysis results of serum lipid indexes of rats in differ- ent stages are shown in Figure 1. As is indicated by the analysis results in Figure 1, at the end of the first week of the experiment, serum TC, TG and LDL-C of rats in the group fed with high-fat feed increased significantly (P<0.05) compared with those of rats in group C, suggesting the success of estab- lishment of hyperlipidemia rat models with no statistical significance of lipid index differences among the groups (P>0.05). At the end experiment, no significant differ- ence was present between TC levels of group FL3 and group FF (P>0.05), neither between TG levels of group FL2 and FL3 and group FF (P>0.05). Compared with the result of group F, the LDL-C levels of all other groups were significantly decreased (P<0.05); the LDL- C level of group FL3 was lower than that of group FF (P<0.05). HDL-C differences of rats in these groups during the experiment had no statistical significance (P>0.05). 4.3. Expression of APP in the Hippocampal CA1 Region Positive APP reaction products are brown-yellow parti- cles distributed in cell membranes and cytoplasma. The analysis results in Table 1 show that: the number of positive APP particles in group F increased significantly compared with that in group C (P<0.05); the number of APP positive particles in groups FF, FL2 and FL3 was significantly lower than that in group F (P<0.05); the difference between group C and group FL1 had no sta- tistical significance (P=0.492); the difference of the Figure 1. The serum lipids of rats at different experimental stage (x±S). Different alphabet superscripts of the same column indi- cate the significant differences between groups (p<0.05); Different symbol (*, #, &) represent significant differences at 0, 1, 3w in the same group (p<0.05). 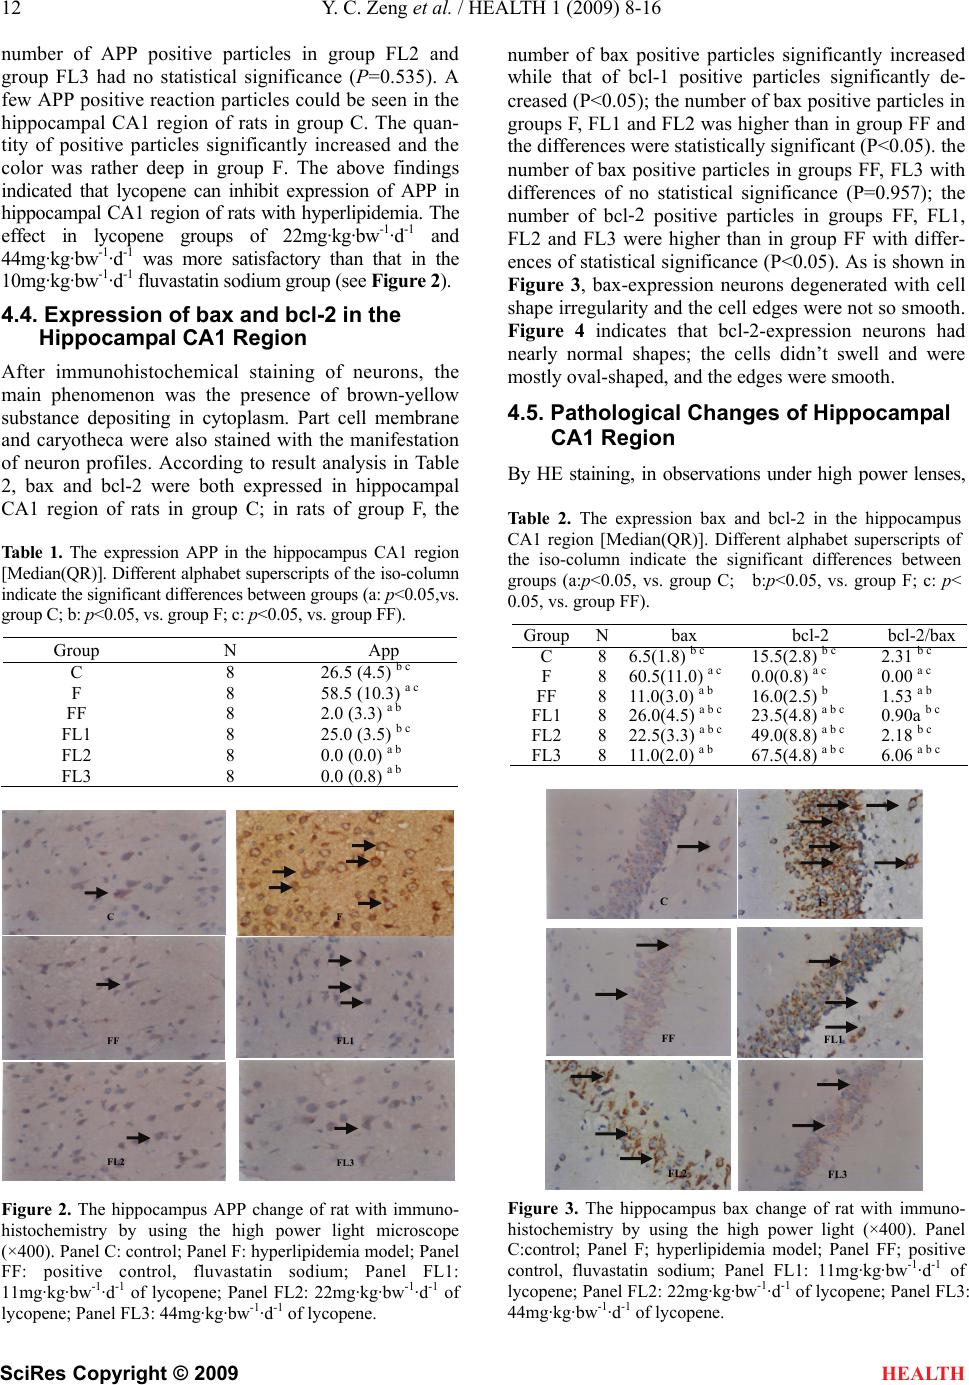 12 Y. C. Zeng et al. / HEALTH 1 (2009) 8-16 SciRes Copyright © 2009 number of APP positive particles in group FL2 and group FL3 had no statistical significance (P=0.535). A few APP positive reaction particles could be seen in the hippocampal CA1 region of rats in group C. The quan- tity of positive particles significantly increased and the color was rat deep in group F. Tabove findings indicated that lycopene can inhibit expression of APP in hippocampal CA1 region of rats with hyperlipidemia. The effect in lycopene groups of 22mg·kg·bw-1·d-1 and 44mg·kg·bw-1·d-1 was more satisfactory than that in the 10mg·kg·bw-1·d-1 fluvastatin sodium group (see Figure 2). 4.4. Expression of bax and bcl-2 in the Hippocampal CA1 Region After immunohistochemical staining of neurons, the main phenomenon was the presence of brown-yellow substance depositing in cytoplasm. Part cell membrane and caryotheca were also stained with the manifestation of neuron profiles. According to result analysis in Table 2, bax and bcloth expressed hippocampal CA1 region of roup C; in rats of group F, the App herhe HEALTH -2 were b ats in gr in Table 1. The expression APP in the hippocampus CA1 region [Median(QR)]. Different alphabet superscripts of the iso-column indicate the significant differences between groups (a: p<0.05,vs. group C; b: p<0.05, vs. group F; c: p<0.05, vs. group FF). Group N C 8 26.5 (4.5) b c F FF FL1 FL2 FL3 8 8 8 8 8 58.5 (10.3) a c 2.0 (3.3) a b 25.0 (3.5) b c 0.0 (0.0) a b 0.0 (0.8) a b Figure 2. The hippocampus APP change of rat with immuno- histochemistry by using the high power light microscope (×400). Panel C: control; Panel F: hyperlipidemia model; Panel FF: positive control, fluvastatin sodium; Panel FL1: 11mg·kg·bw-1·d-1 of lycopene; Panel FL2: 22mg·kg·bw-1·d-1 of lycopene; Panel FL3: 44mg·kg·bw-1·d-1 of lycopene. number of bax positive particles significantly increased while that of bcl-1 positive particles significantly de- creased (P<0.05); the number of bax positive particles in groups F, FL1 and FL2 was higher than in group FF and the differences were statistically significant (P<0.05). the number of bax positive particles in groups FF, FL3 with differences of no statistical significance (P=0.957); the number of bclpositive particles inroups FF, FL1, FL2 and FL3 were higher than in group FF with differ- ences of statistical significance (P<0.05). As is shown in Figure 3, bax-expression neurons degenerated with cell shape irregularity and the cell edges were not so smooth. Figure 4 indicates that bcl-2-expression neurons had nearly normal shapes; the cells didn’t swell and were mostly oval-shaped, and the edges were smooth. 4.5. Pathological Changes of Hippocampal CA1 Region By HE staining, in observations under high power lenses, Table 2. The expression bax and bcl-2 in the hippocampus CA1 region [Median(QR)]. Different alphabet superscripts of the iso-column indicate the significant differences between groups (a:p<0.05, vs. group C; b:p<0.05, vs. group F; c: p< 0.05, vs. group FF -2 g ). GroupNbax bcl-2 bcl-2/bax C F FF FL1 FL2 FL3 8 8 8 8 8 6.5(1.8) b c 60.5(11.0) a c 11.0(3.0) a b 26.0(4.5) a b c 22.5(3.3) a b c 15.5(2.8) b c 0.0(0.8) a c 16.0(2.5) b 23.5(4.8) a b c 49.0(8.8) a b c 2.31 b c 0.00 a c 1.53 a b 0.90a b c 2.18 b c 811.0(2.0) a b 67.5(4.8) a b c 6.06 a b c Figure 3. The hippocampus bax change of rat with immuno- histochemistry by using the high power light (×400). Panel C:control; Panel F; hyperlipidemia model; Panel FF; positive control, fluvastatin sodium; Panel FL1: 11mg·kg·bw-1·d-1 of lycopene; Panel FL2: 22mg·kg·bw-1·d-1 of lycopene; Panel FL3: 44mg·kg·bw-1·d-1 of lycopene. A C E F C FL1 FF FL3 FL2 F C FL1 FF FL3 FL2 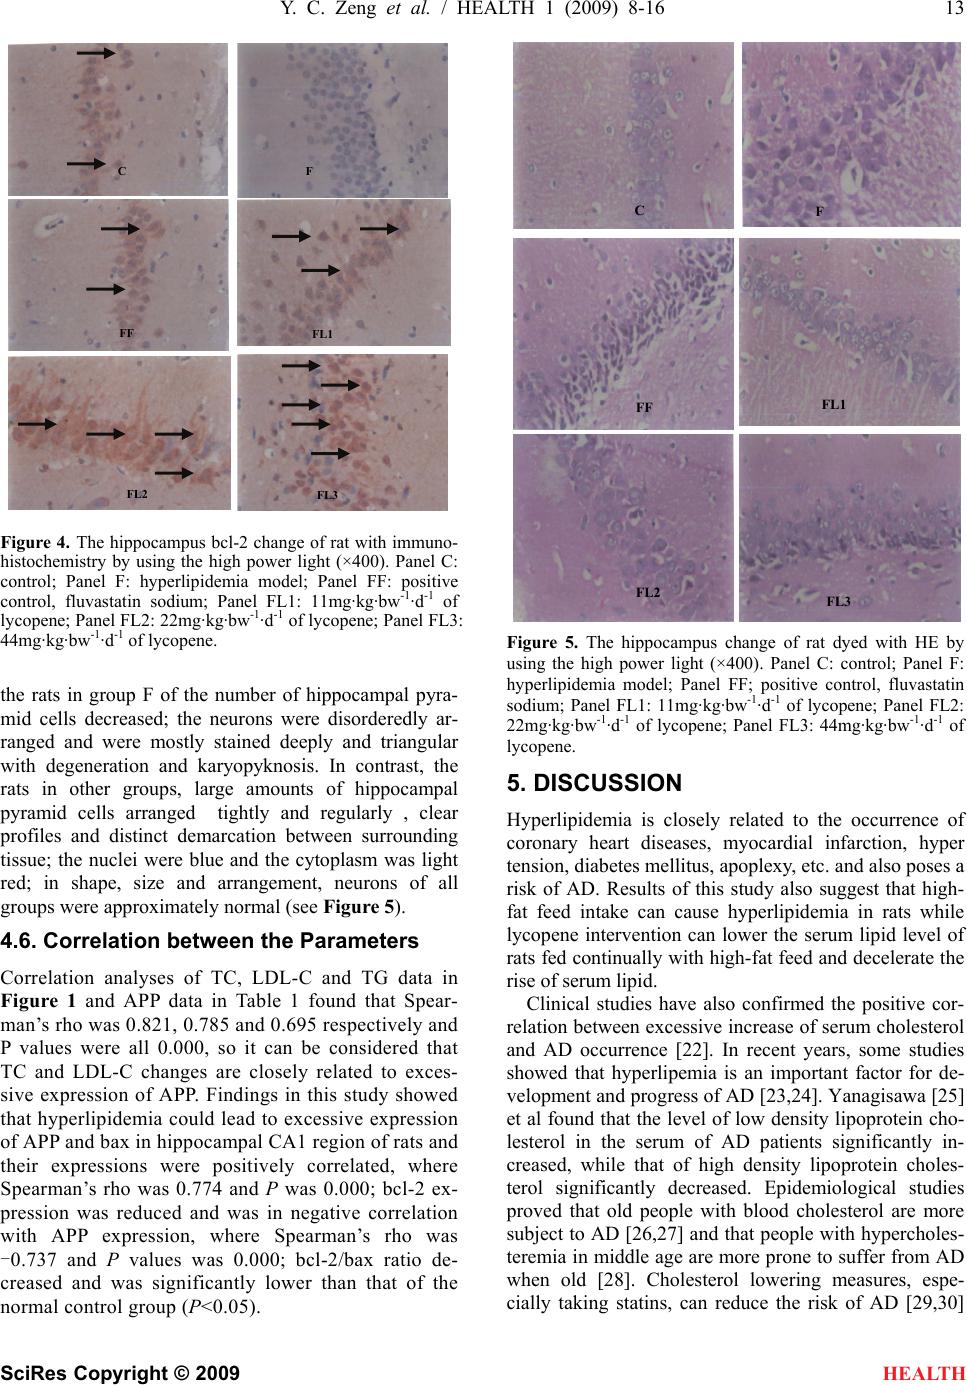 Y. C. Zeng et al. / HEALTH 1 (2009) 8-16 13 SciRes Copyright © 2009 5 HEALTH Figure 4. The hippocampus bcl-2 change of rat with immuno- histochemistry by using the high power light (×400). Panel C: control; Panel F: hyperlipidemia model; Panel FF: positive control, fluvastatin sodium; Panel FL1: 11mg·kg·bw-1·d-1 of lycopene; Panel FL2: 22mg·kg·bw-1·d-1 of lycopene; Panel FL3: 44mg·kg·bw-1·d-1 of lycopene. the rats in group F of the number of hippocampal pyra- mid cells decreased; the neurons were disorderedly ar- ranged and were mostly stained deeply and triangular with degeneration and karyopyknosis. In contrast, the rats in other groups, large amounts of hippocampal pyramid cells arranged tightly and regularly , clear profiles and distinct demarcation between surrounding tissue; the nuclei were blue and the cytoplasm was light red; in shape, size and arrangement, neurons of all groups were approximately normal (see Figure 5). 4.6. Correlation between the Parameters Correlation analyses of TC, LDL-C and TG data in Figure 1 and APP data in Table 1 found that Spear- man’s rho was 0.821, 0.785 and 0.695 respectively and P values were all 0.000, so it can be considered that TC and LDL-C changes are closely related to exces- sive expression of APP. Findings in this study showed that hyperlipidemia could lead to excessive expression of APP and bax in hippocampal CA1 region of rats and their expressions were positively correlated, where Spearman’s rho was 0.774 and P was 0.000; bcl-2 ex- pression was reduced and was in negative correlation with APP expression, where Spearman’s rho was -0.737 and P values was 0.000; bcl-2/bax ratio de- creased and was significantly lower than that of the normal control group (P<0.05). Figure 5. The hippocampus change of rat dyed with HE by using the high power light (×400). Panel C: control; Panel F: hyperlipidemia model; Panel FF; positive control, fluvastatin sodium; Panel FL1: 11mg·kg·bw-1·d-1 of lycopene; Panel FL2: 22mg·kg·bw-1·d-1 of lycopene; Panel FL3: 44mg·kg·bw-1·d-1 of lycopene. . DISCUSSION Hyperlipidemia is closely related to the occurrence of coronary heart diseases, myocardial infarction, hyper tension, diabetes mellitus, apoplexy, etc. and also poses a risk of AD. Results of this study also suggest that high- fat feed intake can cause hyperlipidemia in rats while lycopene intervention can lower the serum lipid level of rats fed continually with high-fat feed and decelerate the rise of serum lipid. Clinical studies have also confirmed the positive cor- relation between excessive increase of serum cholesterol and AD occurrence [22]. In recent years, some studies showed that hyperlipemia is an important factor for de- velopment and progress of AD [23,24]. Yanagisawa [25] et al found that the level of low density lipoprotein cho- lesterol in the serum of AD patients significantly in- creased, while that of high density lipoprotein choles- terol significantly decreased. Epidemiological studies proved that old people with blood cholesterol are more subject to AD [26,27] and that people with hypercholes- teremia in middle age are more prone to suffer from AD when old [28]. Cholesterol lowering measures, espe- cially taking statins, can reduce the risk of AD [29,30] F C FL1 FF FL3 FL2 F C FL1 FF FL3 FL2  14 Y. C. Zeng et al. / HEALTH 1 (2009) 8-16 SciRes Copyright © 2009 - ospective study on a population taking onnected to cholesterol level [35,36]. Basic at high cholesterol is relate g atherosclerosis can aggravate depletion sgenic mice [37]. In vitro gested that whether by in- nervous system. The normal physiological fun tion (s) of APP in learning and memory remains unclear. y processed by site-specific proteoly- e Aβ will be so mediate disor- d that the contents o se of serum TC, LDL-C and TG of fluvastatin has been no study ng-term low APP t the number of -2 vector e HEALTH and relieve cognitive function impairment of AD pa tients [31]. A retr statins showed that the AD incidence rate was 70% lower in people taking the drugs than in the control group [32]. It is a characteristic pathological change of AD that β-amyloid (Aβ) deposits abnormally in special encephalic regions[33,34] and the development of Aβ is intimately c studies have proved thd to syste nervous system development, when more than half of ring neurons will be cleared away; apopto cognitive function impairment and that intake of foods causinof m learning abilities of APP tran cell culture experiments sug hibiting cholesterol synthesis with HMG-CoAR inhibit- ers or by lowering intracellular cholesterol with physical methods, cellular Aβ content could be reduced [38]. APP is a transmembrane glycoprotein, mainly in the centralc- TU APP physiologicall sis firstly by α- secretases or β-secretases, releasing a large fragment called APP (S) that contains most of the extracellular sequences of APP, a small extracellular , the transmstubembrane region and the cytoplasmic tail of APP. These are subsequently cleaved by γ-secretase at multiple sites in the transmembrane region, releasing small peptides, Aβ (1-40) and Aβ (1-42), the major components of AD-associated amyloid fibrils [39]. Aβ, principal constituent of senis aile plaques (degenerated axons surrounding amyloid substance in essence, one of the main pathological changes of AD) [40]. Then the cholesterol level in the blood rises, mor produced in the brain [41]. Morphological changes of cranial neurons and decrease of cognitive ability both correlate with Aβ increase. Aβ can al ders of signal transduction pathways and lead to apop- tosis in the end [42]. It has been found in studies that excessive expression of APP genes is the cause for deposition of β-amyloid [43] anf β- normal. The study indicates that lycopene can maintain morphological normality of hippocampal neurons of hyperlipidemia rats and, possibly by inhibiting excessive expression of hippocampal APP, up-regulate expression APP mRNA and APP protein in hippocampal region of senescence accelerated mice (SAM) increase with the growth of age and excessive expression of hippocampal APP is related to memory loss of SAMs [44]. This study suggests content increa and also excessive APP expression in hippocampal CA1 region of hyperlipidemia rat models established after feeding high-fat feed for three weeks. Lycopene can inhibit excessive APP expression by lowering serum TC and LDL-C levels of rats, reducing injuries to the nerv- ous system caused by hyperlipidemia. Analysis results in Table 1 indicate that APP expression so- dium group and lycopene group of 22 and 44 mg·kg·bw-1·d-1 was significantly lower than that of the normal control group. So far, there report on low expression of APP. In this study, no marked abnormality was found in hippocampus mor- phology observation of rats in the above three groups. Whether lycopene plays its hippocampus protection role through other routes and whether lo expression will bring adverse effect on the organic body should be addressed in further studies. Neuron apoptosis is necessary to dynamic equilibrium maintenance of growth and development of the nervous m and takes place mainly in early stages of the atusis can also remove injured or diseased neurons [45]. However, apoptosis is also an important way of neuron dying; ex- cessive apoptosis may aggravate cerebral ischemic- reperfusion injuries [46]. Apoptosis is the cause for cog- nitive impairment before massive neuron death [47]. It has been proved in studies that neuron loss in AD origi- nates from apoptosis, evidenced by tha NEL positive cells is found by TUNEL method to increase in AD autopsied brain tissue [48] and that apop- tosis-related bcl-2 is found be down-regulated in brains of AD patients [49,50]. Genes related to cerebral neuron tosis include apapopoptosis inhibiting genes and apop- tosis inducing genes. Bcl-2 is an apoptosis inhibiting gene while genes inducing apoptosis mainly include bax, Fas, p53, etc. Bcl-2 and bax are in a balanced system in healthy people. Excessive expression of bcl-2 will in- hibit apoptosis while excessive expression of bax can accelerate apoptosis. The bcl-2/bax ratio regulates the occurrence of apoptosis. A study showed by maintaining the local ratio of bcl-2/bax using the HSV bcl one may protect CA1 pyramidal cell from the delayed neuronal death of transient global ischemia [51]. As is suggested in in vivo and in vitro studies, APP can down-regulate expression of bcl-2 while up-regulate of bax [52]. Morphological observation showed thathat t hippocampal pyramidal cells of the model group de- creased and were arranged disorderedly while morphol- ogy of hippocampal region of other groups was basically of apoptosis inhibiting gene bcl-2, down-regulate ex- pression of apoptosis promoting gene bax and maintain- ing constancy of bcl-2/bax ratio so as to protect hippo- campal neurons. To conclude, lycopene can effectively reduce serum lipid level of experimental hyperlipidemia rats with the dose of 44mg·kg·bw-1 having the most marked effect. pene down-regulates theLyco expression of bax and up-regulates that bcl-2of mainly by reducing serum TC and LDL-C and weakening expression of APP in the hippocampal CA1 region of rats with hyperlipidemia, thereby facilitating the protection of the brain. However, the specific working mechanism, the optimal effectiv doses in different tissues and the adverse effect still re- 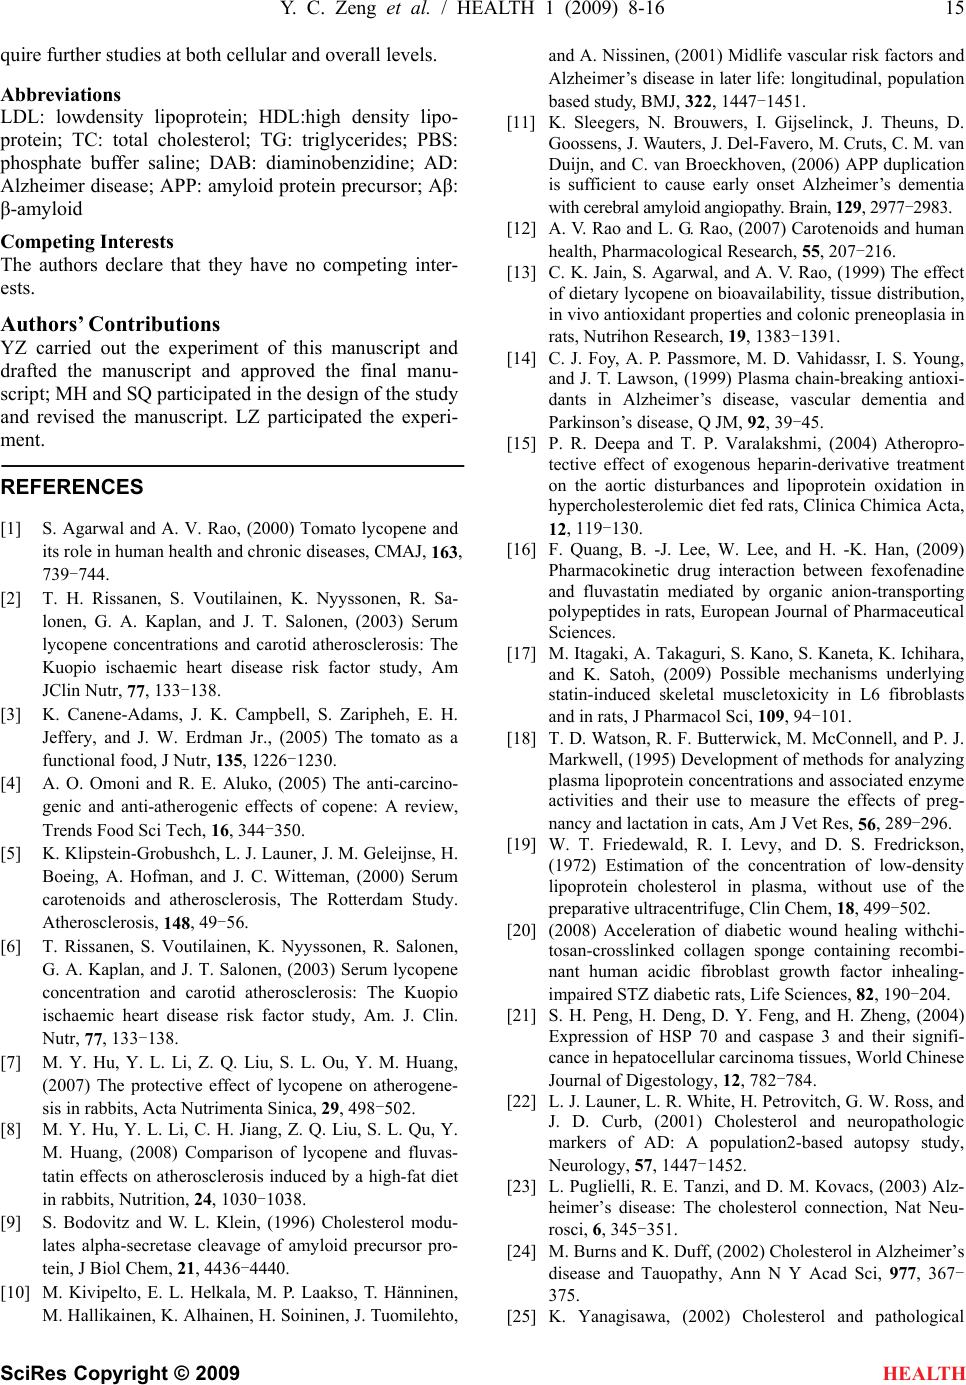 Y. C. Zeng et al. / HEALTH 1 (2009) 8-16 15 SciRes Copyright © 2009 d J. W. Erdman Jr., (2005) The tomato as a 33-138. ] S. Bodovitz and W. L. Klein, (1996) Cholesterol modu- lates alpha-secretase cleavage of amyloid precursor pro- tein, J Biol Chem, 21, 4436-4440. 0] M. Kivipelto, E. L. Helkala, M. P. Laakso, T. Hänninen, M. Hallikainen, K. Alhainen, H. Soininen, J. Tuomilehto, risk factors and uts, C. M. van 977-2983. vailability, tissue distribution, lemic diet fed rats, Clinica Chimica Acta, maceutical 9) Possible mechanisms underlying tson, R. F. Butterwick, M. McConnell, and P. J. re the effects of preg- of the wound healing withchi- H. Zheng, (2004) . Ross, and 03) Alz- heimer’s disease: The cholesterol connection, Nat Neu- rosci, 6, 345-351. [24] M. Burns and K. Duff, (2002) Cholesterol in Alzheimer’s disease and Tauopathy, Ann N Y Acad Sci, 977, 367- 375. 5] K. Yanagisawa, (2002) Cholesterol and pathological HEALTH quire further studies at both cellular and overall levels. Abbreviations LDL: lowdensity lipoprotein; HDL:high density lipo- protein; TC: total cholesterol; TG: triglycerides; PBS: phosphate buffer saline; DAB: diaminobenzidine; AD: Alzheimer disease; APP: amyloid protein precursor; Aβ: β-amyloid Competing Interests The authors declare that they have no competing inter- ests. Authors’ Contributions YZ carried out the experiment of this manuscript and drafted the manuscript and approved the final manu- script; MH and SQ participated in the design of the study and revised the manuscript. LZ participated the experi- ment. REFERENCES S. Agarwal and A. V. Rao, (2000) Tomato ly[1] copene and its role in human health and chronic diseases, CMAJ, 163, 739-744. [2] T. H. Rissanen, S. Voutilainen, K. Nyyssonen, R. Sa- lonen, G. A. Kaplan, and J. T. Salonen, (2003) Serum 12, 1 lycopene concentrations and carotid atherosclerosis: The Kuopio ischaemic heart disease risk factor study, Am JClin Nutr, 77, 133-138. [3] K. Canene-Adams, J. K. Campbell, S. Zaripheh, E. H. Jeffery, an functional food, J Nutr, 135, 1226-1230. [4] A. O. Omoni and R. E. Aluko, (2005) The anti-carcino- genic and anti-atherogenic effects of copene: A review, Trends Food Sci Tech, 16, 344-350. [5] K. Klipstein-Grobushch, L. J. Launer, J. M. Geleijnse, H. Boeing, A. Hofman, and J. C. Witteman, (2000) Serum carotenoids and atherosclerosis, The Rotterdam Study. Atherosclerosis, 148, 49-56. [6] T. Rissanen, S. Voutilainen, K. Nyyssonen, R. Salonen, G. A. Kaplan, and J. T. Salonen, (2003) Serum lycopene concentration and carotid atherosclerosis: The Kuopio ischaemic heart disease risk factor study, Am. J. Clin. Nutr, 77, 1 [7] M. Y. Hu, Y. L. Li, Z. Q. Liu, S. L. Ou, Y. M. Huang, (2007) The protective effect of lycopene on atherogene- sis in rabbits, Acta Nutrimenta Sinica, 29, 498-502. M. Y. Hu, Y. L. Li, C. H. Jiang, Z. Q. Liu, S. L. Qu, Y[8] . M. Huang, (2008) Comparison of lycopene and fluvas- tatin effects on atherosclerosis induced by a high-fat diet in rabbits, Nutrition, 24, 1030-1038. [9 [1 and A. Nissinen, (2001) Midlife vascular Alzheimer’s disease in later life: longitudinal, population based study, BMJ, 322, 1447-1451. [11] K. Sleegers, N. Brouwers, I. Gijselinck, J. Theuns, D. Goossens, J. Wauters, J. Del-Favero, M. Cr Duijn, and C. van Broeckhoven, (2006) APP duplication is sufficient to cause early onset Alzheimer’s dementia with cerebral amyloid angiopathy. Brain, 129, 2 [12] A. V. Rao and L. G. Rao, (2007) Carotenoids and human health, Pharmacological Research, 55, 207-216. [13] C. K. Jain, S. Agarwal, and A. V. Rao, (1999) The effect of dietary lycopene on bioa in vivo antioxidant properties and colonic preneoplasia in rats, Nutrihon Research, 19, 1383-1391. [14] C. J. Foy, A. P. Passmore, M. D. Vahidassr, I. S. Young, and J. T. Lawson, (1999) Plasma chain-breaking antioxi- dants in Alzheimer’s disease, vascular dementia and Parkinson’s disease, Q JM, 92, 39-45. [15] P. R. Deepa and T. P. Varalakshmi, (2004) Atheropro- tective effect of exogenous heparin-derivative treatment on the aortic disturbances and lipoprotein oxidation in hypercholestero 19-130. [16] F. Quang, B. -J. Lee, W. Lee, and H. -K. Han, (2009) Pharmacokinetic drug interaction between fexofenadine and fluvastatin mediated by organic anion-transporting polypeptides in rats, European Journal of Phar Sciences. [17] M. Itagaki, A. Takaguri, S. Kano, S. Kaneta, K. Ichihara, and K. Satoh, (200 statin-induced skeletal muscletoxicity in L6 fibroblasts and in rats, J Pharmacol Sci, 109, 94-101. [18] T. D. Wa Markwell, (1995) Development of methods for analyzing plasma lipoprotein concentrations and associated enzyme activities and their use to measu nancy and lactation in cats, Am J Vet Res, 56, 289-296. [19] W. T. Friedewald, R. I. Levy, and D. S. Fredrickson, (1972) Estimation of the concentration of low-density lipoprotein cholesterol in plasma, without use preparative ultracentrifuge, Clin Chem, 18, 499-502. [20] (2008) Acceleration of diabetic tosan-crosslinked collagen sponge containing recombi- nant human acidic fibroblast growth factor inhealing- impaired STZ diabetic rats, Life Sciences, 82, 190-204. [21] S. H. Peng, H. Deng, D. Y. Feng, and Expression of HSP 70 and caspase 3 and their signifi- cance in hepatocellular carcinoma tissues, World Chinese Journal of Digestology, 12, 782-784. [22] L. J. Launer, L. R. White, H. Petrovitch, G. W J. D. Curb, (2001) Cholesterol and neuropathologic markers of AD: A population2-based autopsy study, Neurology, 57, 1447-1452. [23] L. Puglielli, R. E. Tanzi, and D. M. Kovacs, (20 [2 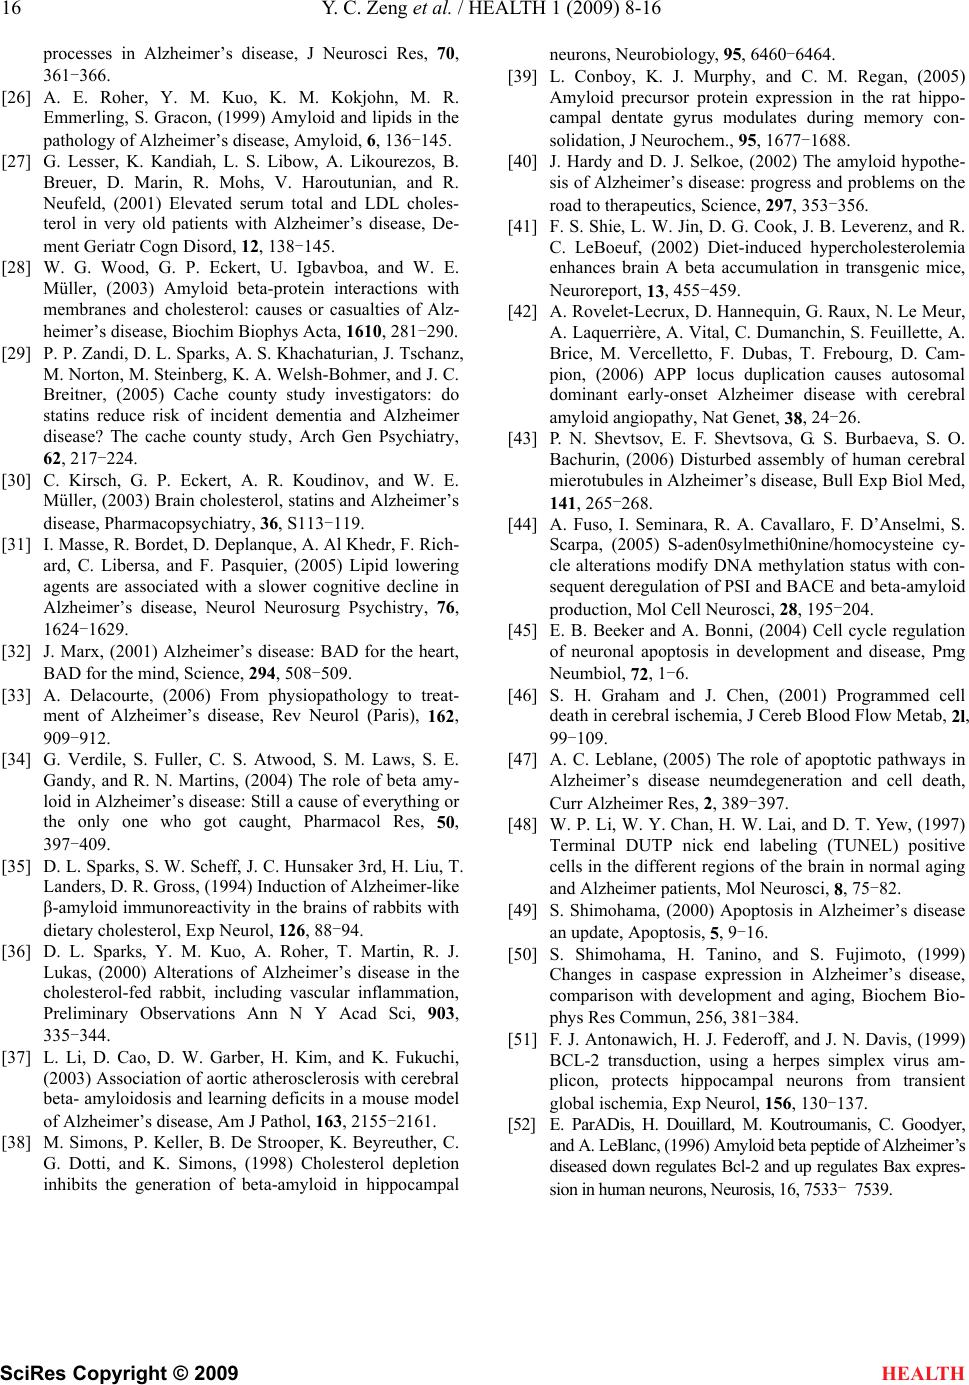 16 Y. C. Zeng et al. / HEALTH 1 (2009) 8-16 SciRes Copyright © 2009 processes in Alzheimer’s disease, J Neurosci Res, 70, 361-366. A. E. Roher, Y. M. Kuo, K. M. Kokjohn, M. R. Emmerling , S. Gracon, (1999) Amyloid and lipids in the pathology of Alzheimer’s disease, Amyloid, 6, 136-145. [27] G. Lesser, K. Kandiah, L. S. Libow, A. Likourezos, B. Breuer, D. Marin, R. Mohs, V. Haroutunian, and R. Neufeld, (2001) Elevated serum total and LDL choles- terol in very old patients with Alzheimer’s disease, De- ment Geriatr Cogn Disord, 12, 138-145. [28] W. G. Wood, G. P. Eckert, U. Igbavboa, and W. E. Müller, (2003) Amyloid beta-protein interactions with membranes and cholesterol: causes or casualties of Alz- heimer’s disease, Biochim Biophys Acta, 1610, 281-290. [29] P. P. Zandi, D. L. Sparks, A. S. Khachaturian, J. Tschanz, M. Norton, M. Steinberg, K. A. Welsh-Bohmer, and J. C. Breitner, (2005) Cache county study investigators: do statins reduce risk of incident dementia and Alzheimer disease? The cache county study, Arch Gen Psychiatry, 62, 217-224. [30] C. Kirsch, G. P. Eckert, A. R. Koudinov, and W. E. Müller, (2003) Brain cholesterol, statins and Alzheimer’s disease, Pharmacopsychiatry, 36, S113-119. [31] I. Masse, R. Bordet, D. Deplanque, A. Al Khedr, F. Rich- ard, C. Libersa, and F. Pasquier, (2005) Lipid lowering agents are associated with a slower cognitive decline in Alzheimer’s disease, Neurol Neurosurg Psychistry, 76, 1624-1629. [32] J. Marx, (2001) Alzheimer’s disease: BAD for the heart, BAD for the mind, Science, 294, 508-509. [33] A. Delacourte, (2006) From physiopathology to treat- ment of Alzheimer’s disease, Rev Neurol (Paris), 162, 909-912. [34] G. Verdile, S. Fuller, C. S. Atwood, S. M. Laws, S. E. Gandy, and R. N. Martins, (2004) The role of beta amy- loid in Alzheimer’s disease: Still a cause of everything or the only one who got caught, Pharmacol Res, 50, 397-409. [35] D. L. Sparks, S. W. Scheff, J. C. Hunsaker 3rd, H. Liu, T. Landers, D. R. Gross, (1994) Induction of Alzheimer-like β-amyloid immunoreactivity in the brains of rabbits with dietary cholesterol, Exp Neurol, 126, 88-94. [36] D. L. Sparks, Y. M. Kuo, A. Roher, T. Martin, R. J. Lukas, (2000) Alterations of Alzheimer’s disease in the cholesterol-fed rabbit, including vascular inflammation, Preliminary Observations Ann N Y Acad Sci, 903, 335-344. [37] L. Li, D. Cao, D. W. Garber, H. Kim, and K. Fukuchi, (2003) Association of aortic atherosclerosis with cerebral beta- amyloidosis and learning deficits in a mouse model of Alzheimer’s disease, Am J Pathol, 163, 2155-2161. [38] M. Simons, P. Keller, B. De Strooper, K. Beyreuther, C. G. Dotti, and K. Simons, (1998) Cholesterol depletion inhibits the generation of beta-amyloid in hippocampal neurons, Neurobiology, 95, 6460-6464. [39] L. Conboy, K. J. Murphy, and C. M. Regan, (2005) Amyloid precursor protein expression in the rat hippo- campal dentate gyrus modulates during memory con- solidation, J Neurochem., 95, 1677-1688. [40] J. Hardy and D. J. Selkoe, (2002) The amyloid hypothe- sis of Alzheimer’s disease: progress and problems on the road to therapeutics, Science, 297, 353-356. [41] F. S. Shie, L. W. Jin, D. G. Cook, J. B. Leverenz, and R. C. LeBoeuf, (2002) Diet-induced hypercholesterolemia enhances brain A beta accumulation in transgenic mice, Neuroreport, 13, 455-459. [42] A. Rovelet-Lecrux, D. Hannequin, G. Raux, N. Le Meur, A. Laquerrière, A. Vital, C. Dumanchin, S. Feuillette, A. Brice, M. Vercelletto, F. Dubas, T. Frebourg, D. Cam- pion, (2006) APP locus duplication causes autosomal dominant early-onset Alzheimer disease with cerebral amyloid angiopathy, Nat Genet, 38, 24-26. [43] P. N. Shevtsov, E. F. Shevtsova, G. S. Burbaeva, S. O. Bachurin, (2006) Disturbed assembly of human cerebral mierotubules in Alzheimer’s disease, Bull Exp Biol Med, 141, 265-268. [44] A. Fuso, I. Seminara, R. A. Cavallaro, F. D’Anselmi, S. Scarpa, (2005) S-aden0sylmethi0nine/homocysteine cy- cle alterations modify DNA methylation status with con- sequent deregulation of PSI and BACE and beta-amyloid production, Mol Cell Neurosci, 28, 195-204. [45] E. B. Beeker and A. Bonni, (2004) Cell cycle regulation of neuronal apoptosis in development and disease, Pmg Neumbiol, 72, 1-6. [46] S. H. Graham and J. Chen, (2001) Programmed cell death in cerebral ischemia, J Cereb Blood Flow Metab, 2l, 99-109. [47] A. C. Leblane, (2005) The role of apoptotic pathways in Alzheimer’s disease neumdegeneration and cell death, Curr Alzheimer Res, 2, 389-397. [48] W. P. Li, W. Y. Chan, H. W. Lai, and D. T. Yew, (1997) Terminal DUTP nick end labeling (TUNEL) positive cells in the different regions of the brain in normal aging and Alzheimer patients, Mol Neurosci, 8, 75-82. [49] S. Shimohama, (2000) Apoptosis in Alzheimer’s disease an update, Apoptosis, 5, 9-16. [50] S. Shimohama, H. Tanino, and S. Fujimoto, (1999) Changes in caspase expression in Alzheimer’s disease, comparison with development and aging, Biochem Bio- phys Res Commun, 256, 381-384. [51] F. J. Antonawich, H. J. Federoff, and J. N. Davis, (1999) BCL-2 transduction, using a herpes simplex virus am- plicon, protects hippocampal neurons from transient global ischemia, Exp Neurol, 156, 130-137. [52] E. ParADis, H. Douillard, M. Koutroumanis, C. Goodyer, and A. LeBlanc, (1996) Amyloid beta peptide of Alzheimer’s diseased down regulates Bcl-2 and up regulates Bax expres- sion in human neurons, Neurosis, 16, 7533- 7539. HEALTH [26]
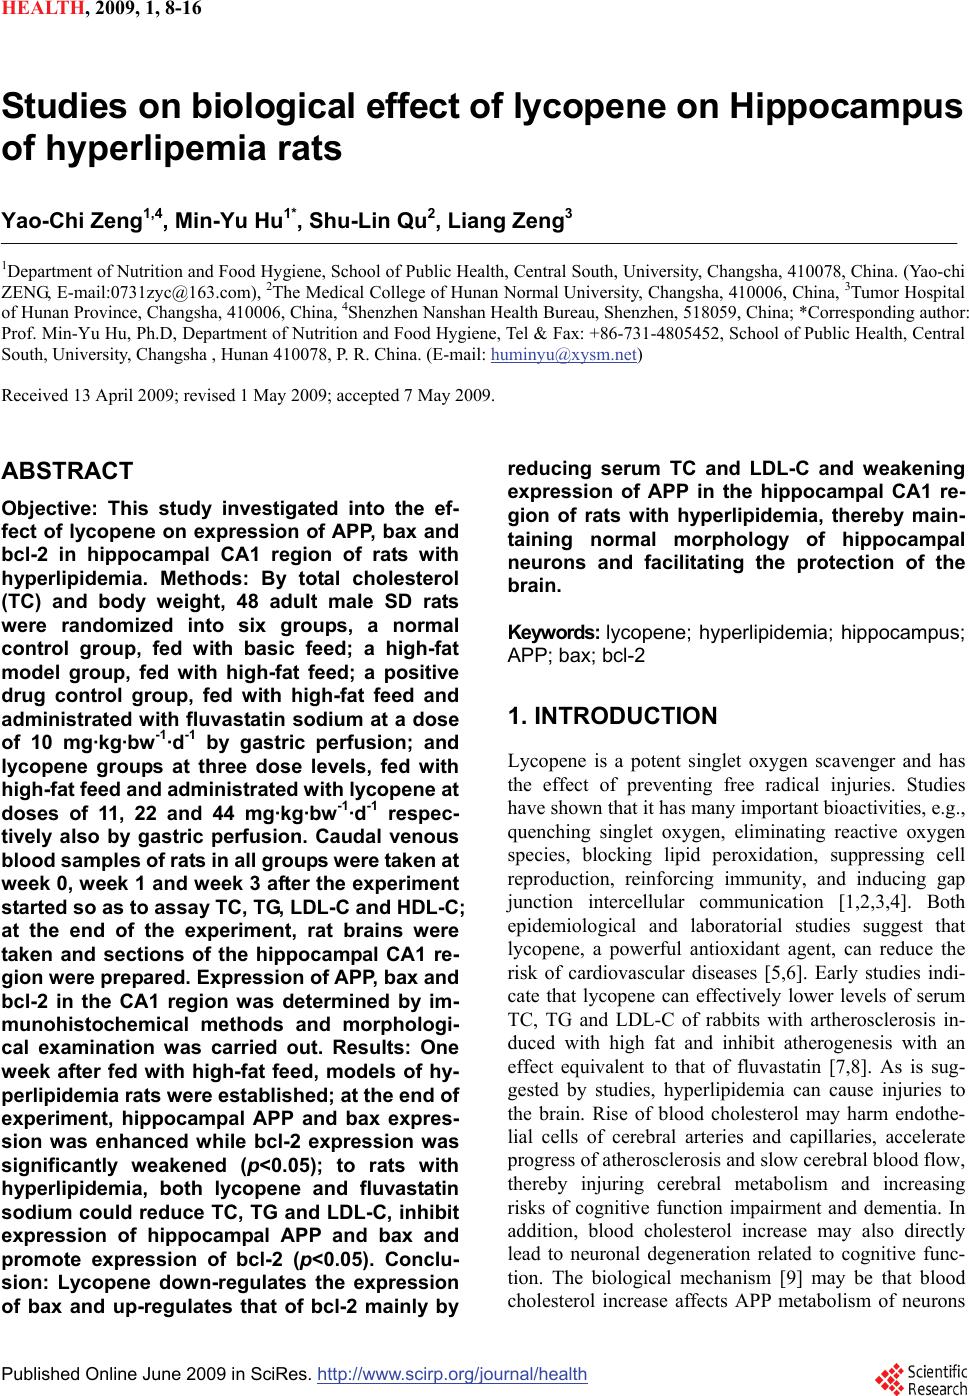
|