J. Buchta et al.
• Mistakes in machinery operation;
• Insufficient care to keep installation in appropr ia te technical cond ition .
The first three groups of mentioned above reasons g ener ally reveal during the early lifetime of power machi-
nery and are removed au courant during the warranty repairs. Reasons belonging to the fourth rev ealed after a
longer period of oper atio n. However, particular attention should be paid to the last three groups of reasons which
depend directly on skills of operational staff worki ng in power p lant.
2. Mathematical Bas is of the Reliability Estimation of Power Units by the Method
of a Histogram
Power units are complicated thermal and mechanical installations consisting of several components with a dif-
ferent level of redundancy. Basic po wer unit components (boiler, turbine, generator) are singular. However, an
auxiliary devices (ID fans, FD fans, co al mills, feed pumps, condensate pumps, cooling water pumps, ash han-
dling etc.), in order to increase reliability of operation, have overt or latent reserve (structur al r edund ancy).
The characteristic feature of power unit reliability, directly resulting from the redundancy of an auxiliary sys-
tem is the possibility to appear failures of different kind, i.e. power unit continues operation with its rates, power
unit operates with power limitation or power unit must be shut-down. This means that power unit is a mul-
ti-stage object in sense of its reliability, on the contrary to the two-stage installations staying in ability or inabil-
ity to operate, which refers to many power tr ansmission and distribution devices. A multi-stage feature causes
that reliability analysis of power unit uses Markov or more complex semi-Mark ov processes, which form an
adequate probabilistic model.
An operational reliability analysis of complex installation is performed using a reliability diagram which
layout usually differs from the functional structure of an installation. Reliability diagram maps the impact of any
item on the reliability of the entir e system. The layout of reliability diagram of power plant is of a mixed type
with dominance of serial connections of elements.
Analytical methods for the assessment of power unit reliability based on Markov processes, in which reliabil-
ity measures for the entire unit are determined from reliability indices of single components, have one important
drawback—the lack of a sufficiently large populatio n of analyzed events for most components under considera-
tion.
Since the first of dozen 370 MW units was commissioned in the Bełchatów Power P lan t in 1982, a systematic
research on power units reliability was initiated by the Institute of Electrical Power Engineering at Lodz Univer-
sity of Technology. The principal target of analyses prepared yearly has been estimatio n of actual reliability
measures of main generating devices of pow e r u n its. Statistical data files of the successive years of the power
plant operation have been systematically complemented and v er ified. The v erificatio n of statistical da ta consist
in elimination of events which are not of random origin (i.e. actively influenced by operation and maintenance
staff) and these, which were not qualified as break-downs only because there was enough ready-reserve power
during failur e.
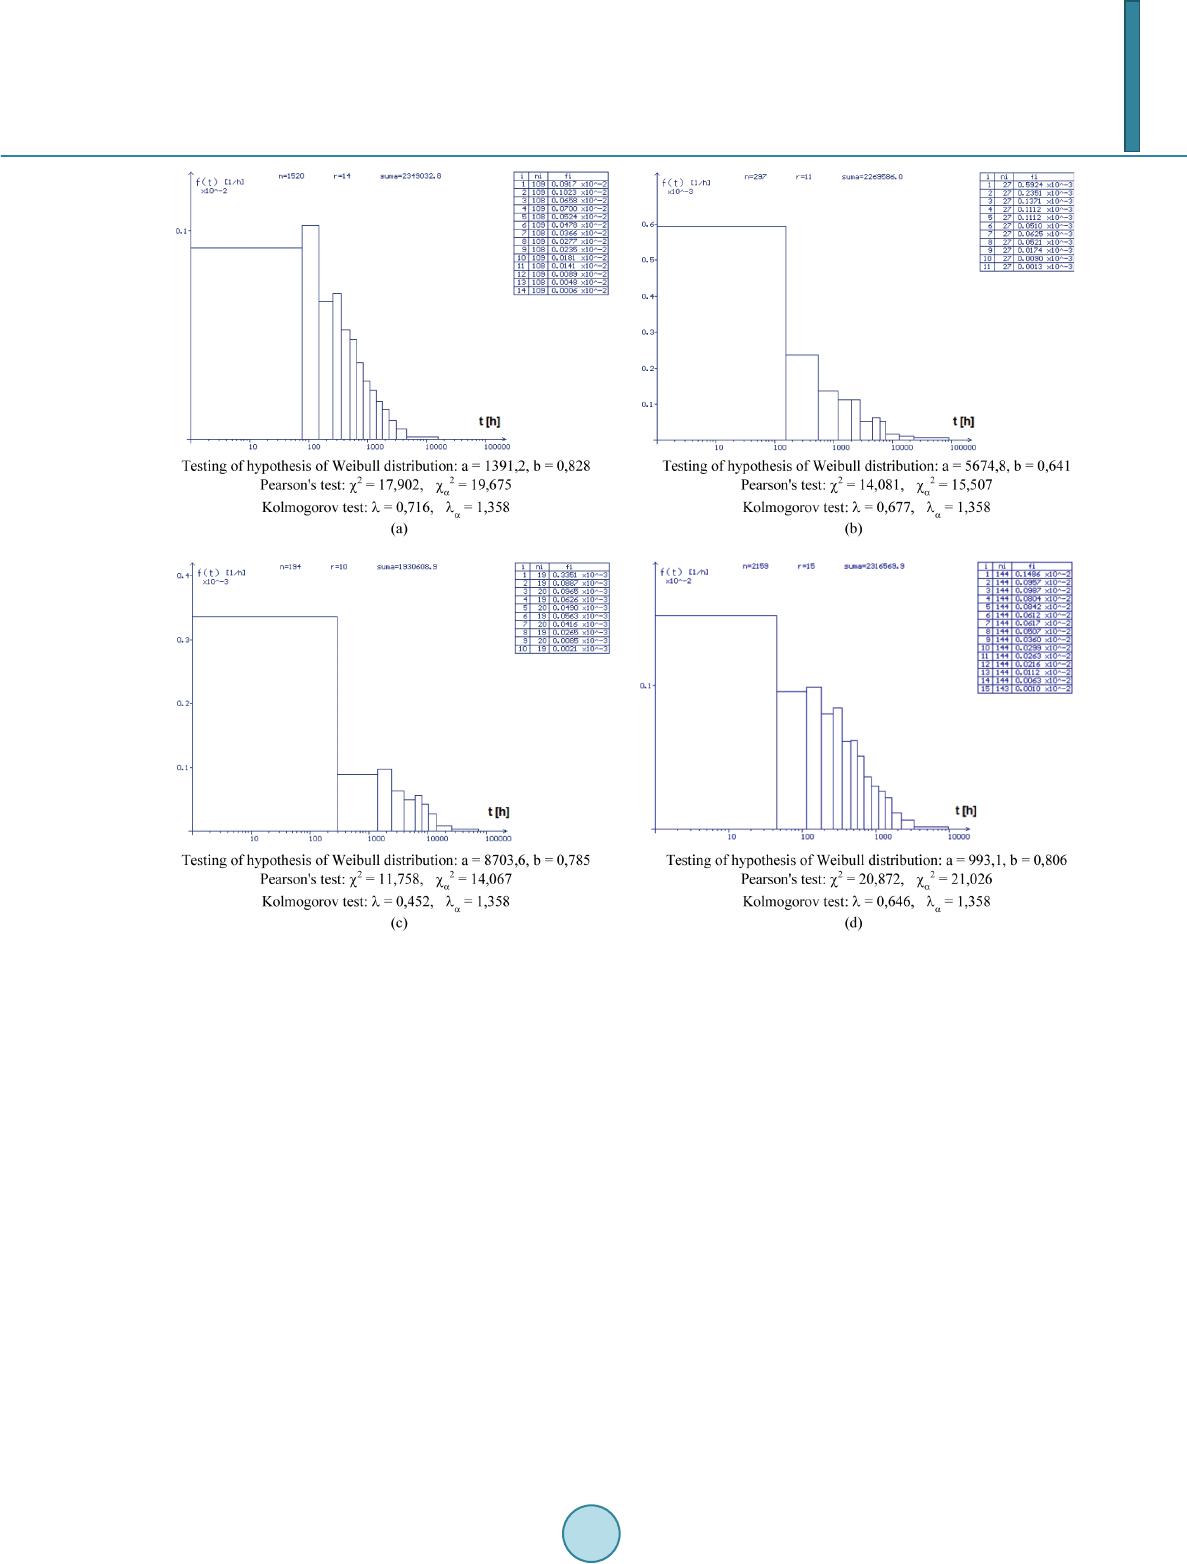
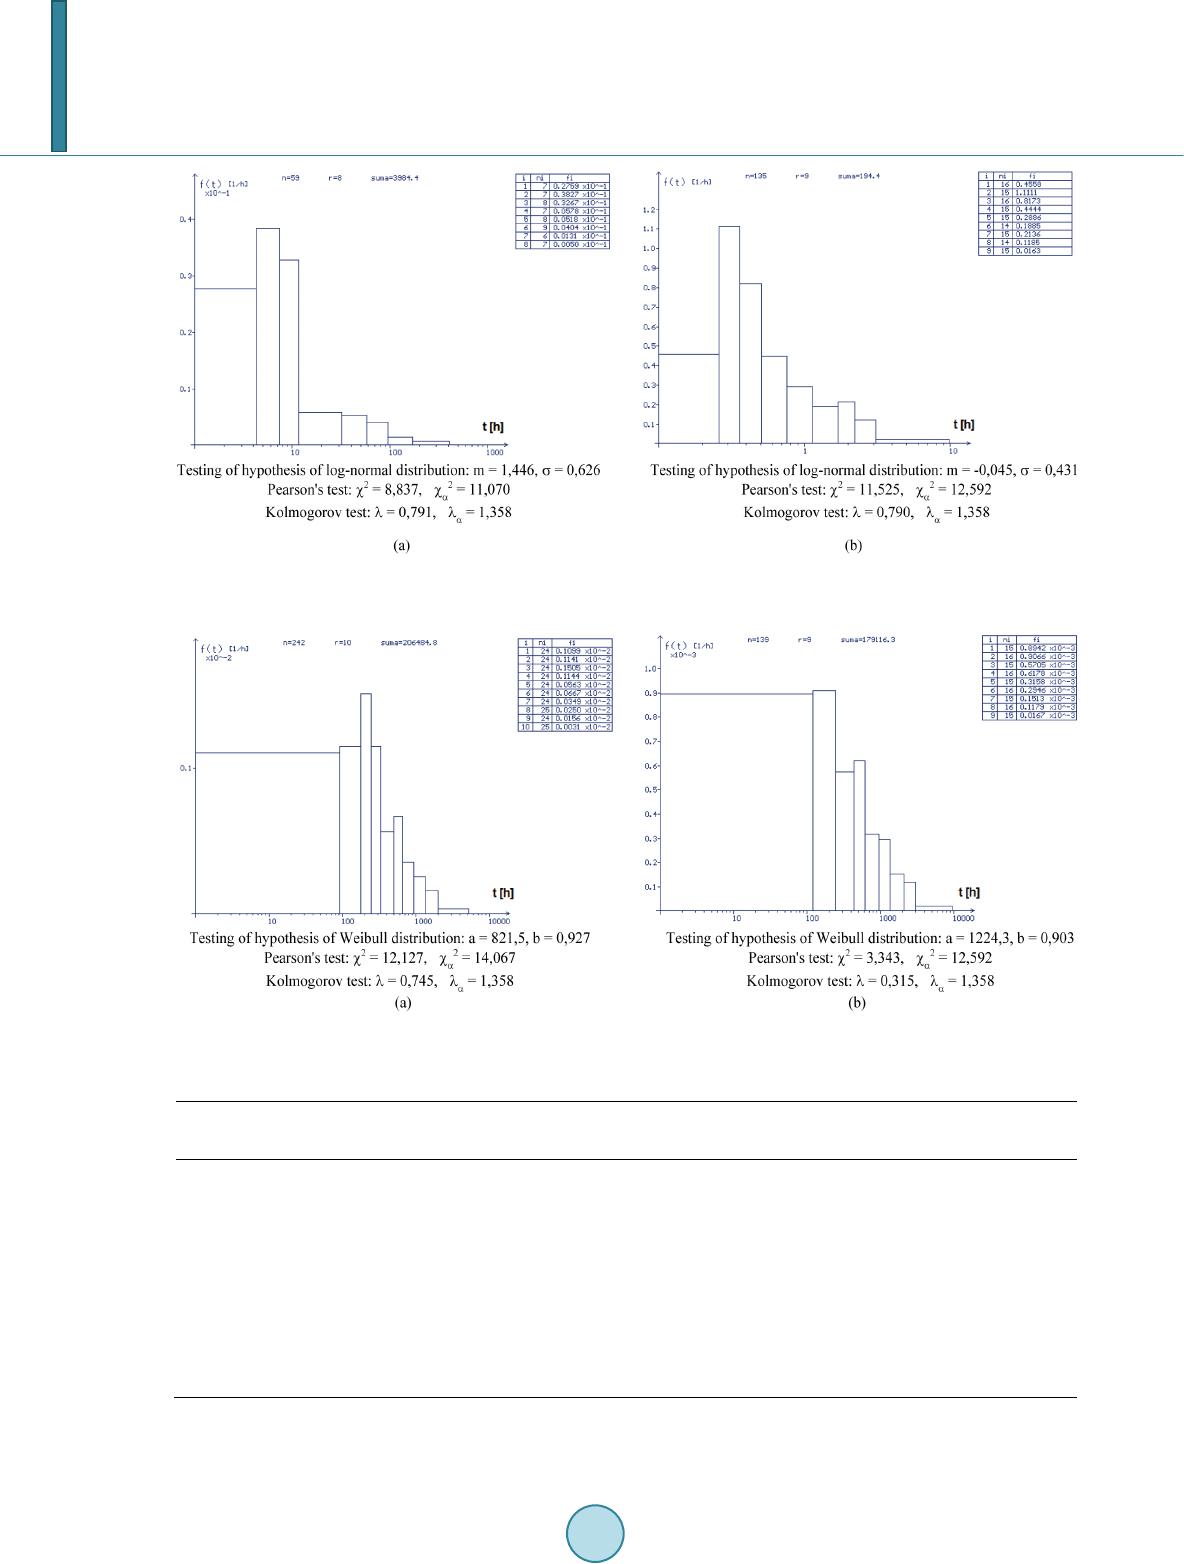
Using reliability model and computer database worked out for the 370 MW power unit, the most defective
elements of the boiler, turbine, generator and auxiliary systems have been identified [3,4]. For selected elements,
empirical probability density functions of operation times, repa ir times have been determined with use of the
histogram with a set number of observations in each class.
The h istog ram is often used in statistical data analysis to illustrate the major features of the distribution of the
data in a convenient form. It divides up the range of possible valu es in a data set into classes. In a classical his-
togram, each data class spans the interval of the same width. The height of a rectangle drawn above each class is
proportional to the number of observations in the class. The shape of the histogram sometime s is particularly
sensitive to the number of classes. If th e classes are too wid e, important information might get omitted. On the
other hand, if the classes are too narrow, the meaningful information fades due to random variations and small
number of data in each class. The histogr am with a constant width of class interval dispossesses a random sam-
ple of its statistical attributes. The classical histogram is generally used when dealing with large d ata sets (more
then 100 observations). It’s difficult to get such a large data set in a reliability analysis of an engineered system.
The method of a histogram with a set number of observations in each class was applied in a presented study in-
stead a class ical histogra m. On the contrary to a classical histogram, the histogram with a set number of obser-
vations in each class preserves all statistical features of data set. This histogram is prepared according to the fol-