J. J. Ma et al. / Natural Science 3 (2011) 193-198
Copyright © 2011 SciRes. OPEN ACCESS
195195
retrieved in Subsection 2.1.
2.3. Process of the Retrieval
The method based on the LUT to retrieve the ground
surface reflectance is feasible when the ocean surface
reflectance is known and the aerosol model over the
ocean is same as that on the coast. When both conditions
are satisfied, we can retrieve the ground surface reflec-
tance. The steps are
1) Supposing there are nine kinds of particle models,
including four fine particle models and five coarse parti-
cle models.
2) Using the Cox’s model to calculate the ocean sur-
face reflectance.
3) Based on conditions 1) and 2), the LUT (A) for re-
trieval of the aerosol optical character can be calculated
by using the AHMAD’s radiative transfer code.
4) Using the Formulas (1) and (2) and the clear ocean
pixel of MODIS, the best of aerosol model and the opti-
cal thickness can be retrieved.
5) Using the best aerosol model and the 6S model, we
can get the LUT (B) for retrieval of the ground surface
reflectance.
6) Based on the LUT (B) and the step 4) retrieval
aerosol optical thickness, and the geometrical conditions
and the clear ocean of pixels that were given from
MODIS image, the ground surface reflectance can be
retrieved from the line of interpolation method.
2.4. Estimation of the Error in Retrieval of
Result
In order to verify the influence of the variation of
validate the aerosol optical thickness on the ground sur-
face reflectance, we have performed the analog compu-
tation. In the simulation calculation, we chose the zenith
angle of sun and the azimuth angle to be 19 and 95, the
zenith angle of view of sun and azimuth angle to be 280
and 900, the aerosol optical thickness to be 0.28 at 0.55
nm. The simulation is based on the LUT (B) and these
conditions. Table 2 shows the influence of increasing
5%-10% or decreasing 5%-10% of the aerosol optical
thickness on the retrieval of the result.
From Table 2, we see that the error is increasing with
the increase of relative of aerosol optical thickness in
visible band from retrieval of the ground surface reflec-
tance. While in infrared band its influence relatively
smaller. When the variation of the retrieved of aerosol
optical thickness is about ten percent, the error is less
than five percent for all band retrieved from the ground
surface reflectance. Therefore, after adding the line of
interpolation of error, the total error in the retrieved the
ground surface reflectance is less than ten percent.
Usually, the aerosol optical thickness on the land is
thicker than that over the ocean. Chlorophyll of water,
speed and direction of wind are sources of error in re-
trieval of the aerosol optical thickness. They deviates the
retrieved optical thickness from the actual value. In
some areas, the assumption that the atmospheric condi-
tion over the ocean is the same as that on the land may
make the retrieved optical thickness be less than the true
value. This is the major source error of the retrieved
ground surface reflectance.
3. APPLICATION OF THE MODIS IMAGE
AND ANALYSIS OF THE RETRIEVED
RESULT
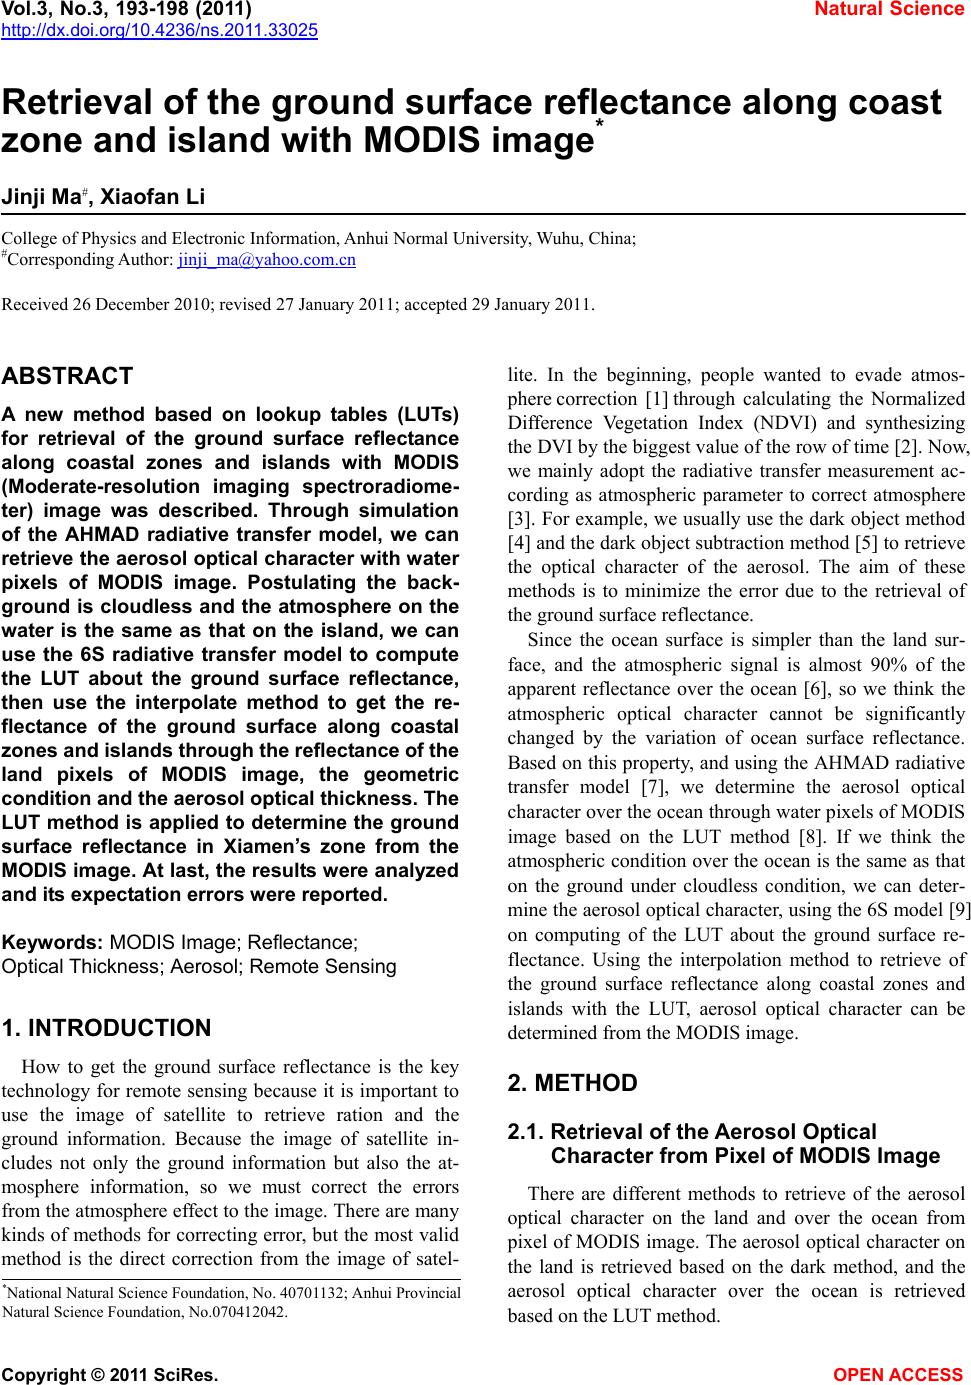
We choose the MODIS image in south ocean of China
on May 282 003 as our research area. This research area
is 30 × 30 pixels cloudless. (Figure 1(a) shows the re-
search area.) The long-lat coordinates of the four top
points are (24.682, 118.199), (24.637, 118.563), (24.414,
118.142), (24.369, 118.505). With the dark aim’s method,
all the water pixels in Figure 1(b) are picked-up. With
these water pixels, the aerosol thickness and the aerosol
model are retrieved. The best result of the retrieval is
that the aerosol model is Multimodal Log Normal dis-
tribution, with three fine and one coarse particle in ratio
of four to one.
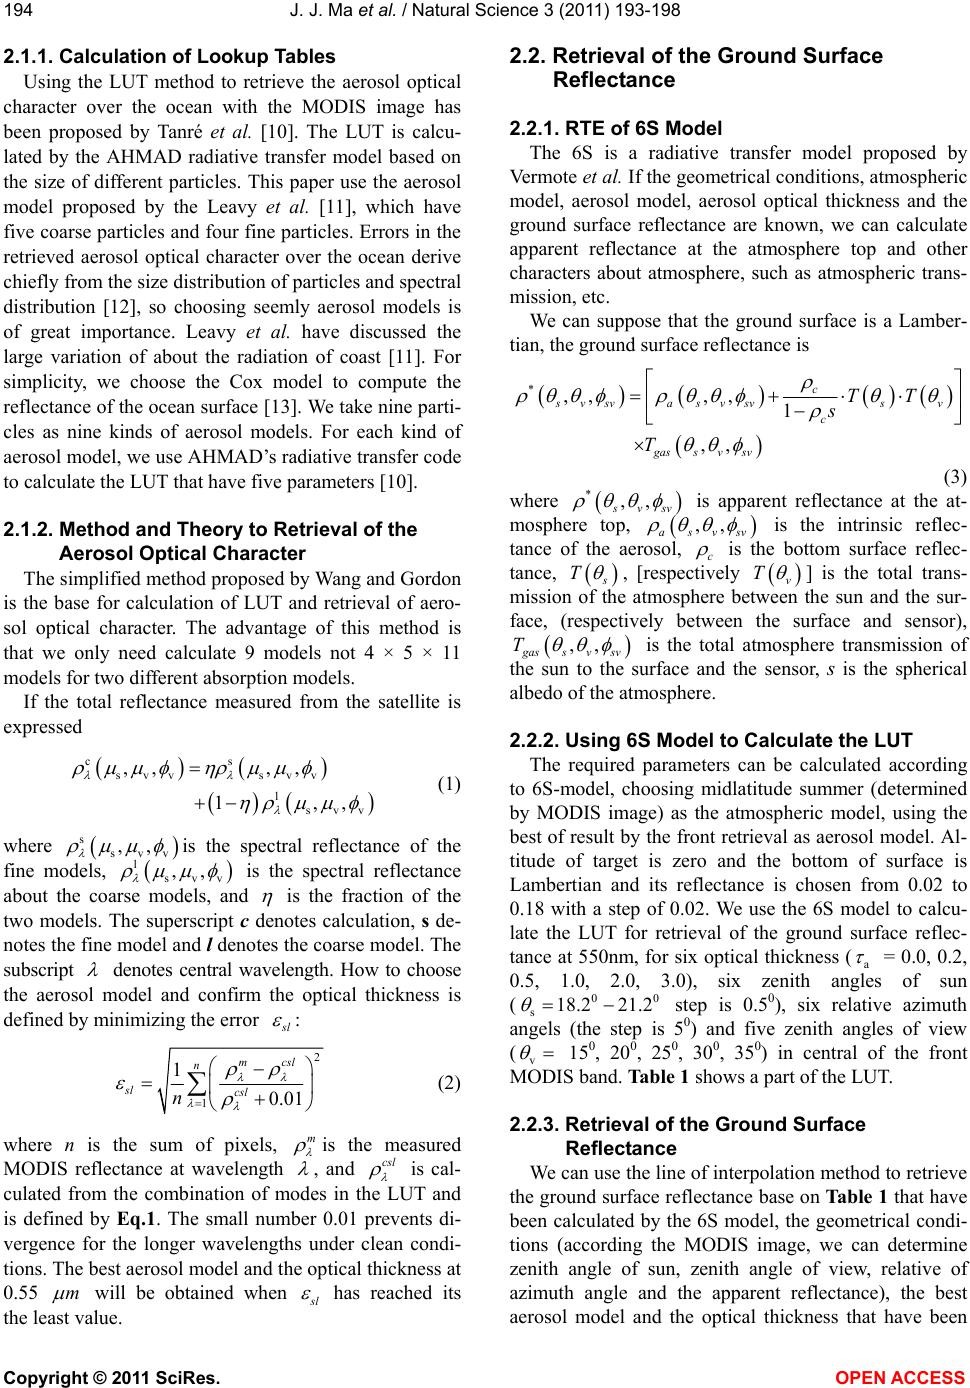
Figure 2(a) shows the average value of the retrieved
aerosol optical thickness. We use the retrieved average
value to retrieve the ground surface reflectance, if an
island separates the row, we choose two average values
in the row. Figure 2(b) shows the relative error in the
average of the aerosol optical thickness, the standard
value (
a550 nm0.264
) comes from the ground
measurement at the same time. Figure 2 shows that the
aerosol varies little on the space and the atmosphere is
uniform in the research of area.
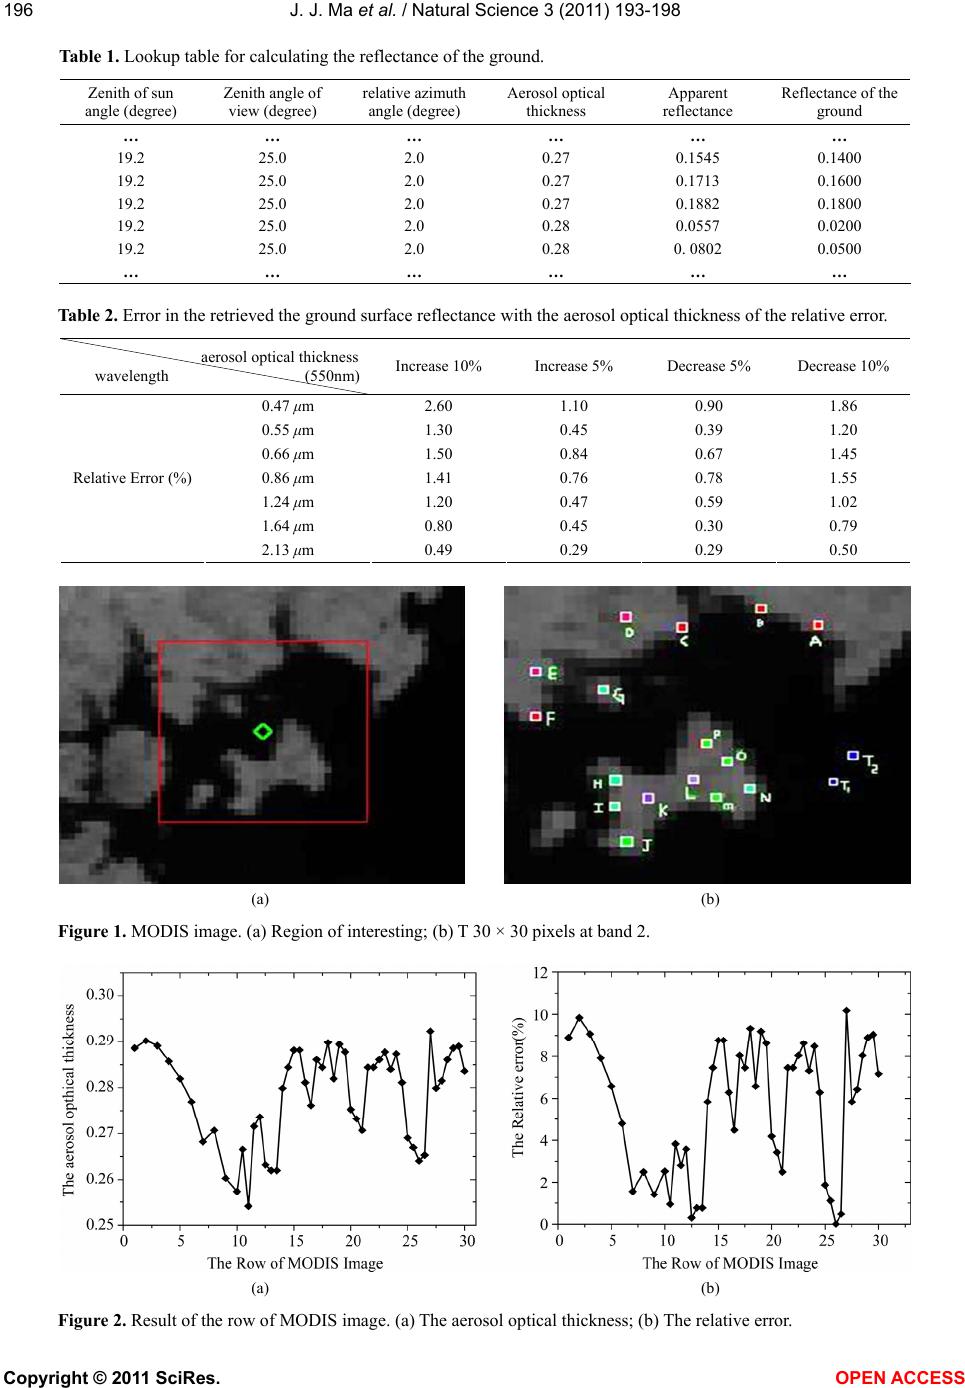
Figure 3 and Figure 4 show the reflectance curve of
every pixels marked in the Figure 1(b). Figure 3 show
the ocean water reflectance curve, its value is almost
zero from 870 nm to 2100 nm. In the Figure 3, curves T,
T1 and T2 are the ocean pixel reflectance, among there
curves T1 and T2 are the retrieval results with the same
method of land, and curve of T is the calculation result
using the Cox’s model [13]. In the model, the wind
speed is 6 m/s, the chlorophyll of concentration is 0.5
mg/ m3 and the salt concentration is 35 ppt. From these
curves in the Figure 3, we find that the retrieval results
tally with the calculation result.
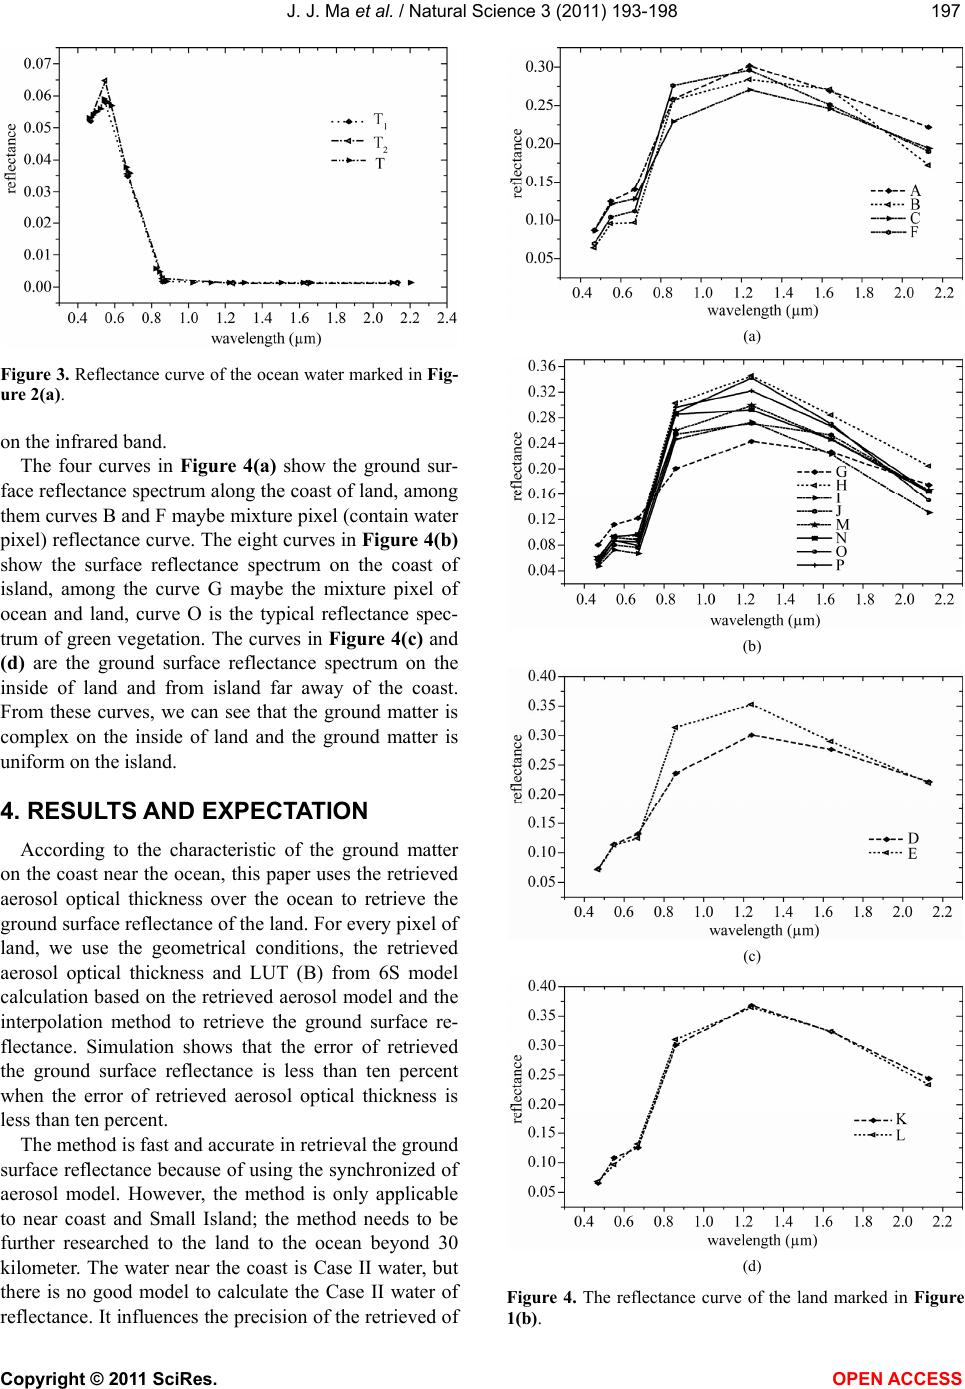
Figure 4 shows the ground surface reflectance curves
on the coast and the island. These curves tally with the
type spectrum of vegetation that the reflectance on the
visible band is very small and the reflectance quickly
increases from 670 nm to 1240 nm with little variation