 Journal of Power and Energy Engineering, 2014, 2, 26-35 Published Online April 2014 in SciRes. http://www.scirp.org/journal/jpee http://dx.doi.org/10.4236/jpee.2014.24005 How to cite this paper: Swarna, K.S.V., Shafiullah, G.M., Oo, A.M.T. and Stojce vs k i , A. (2014) Prospects of Renewable Energy in Semi-Arid Region. Journal of Power and Energy Engineering, 2, 26-35. http://dx.doi.org/10.4236/jpee.2014.24005 Prospects of Renewable Energy in Semi-Arid Region K. S. V. Swarna, G. M. Shafiullah, Amanullah M. T. Oo, Alex Stojcevski School of Engineering, Faculty of Science, Engineering and Built Environment, Deakin University, Geelong Waurn Ponds Campus, Australia Email: ssrungar@deakin.edu.au Received January 2014 Abstract Continuous usage of fossil fuels and other conventional resources to meet the growing demand has resulted in increased energy crisis and greenhouse gas emissions. Hence, it is essential to use renewable energy sources for more reliable, effective, sustainable and pollution free transmission and distribution networks. Therefore, to facilitate large-scale integration of renewable energy in particular wind and solar photovoltaic (PV) energy, this paper presents the feasibility analysis for semi-arid climate and finds the most suitable places in North East region of Victoria for renewable energy generation. For economic and environmental analysis, Hybrid Optimization Model for Electric Renewables (HOMER) was used to investigate the prospects of wind and solar energy con- sidering the Net Present Cost (NPC), Cost of Energy (COE) and Renewable fraction (RF). Six loca- tions are selected from North East region of Victoria and simulations are performed. From the fea- sibility analysis, it can be concluded that Mount Hotham is one of the most suitable locations for wind energy generation while Wangaratta is the most suitable location for solar energy genera- tion. Mount Hotham is also the best suitable locations in North East region for hybrid power sys- tems i.e., combination of both wind and solar energy generation. Keywords Renewable Energy; HOMER; Semi-Arid; Feasibility; Optimization; Sensitivity 1. Introduction Most of the electrical energy generated in Victoria is by burning coal and from other fossil fuels as it has sub- stantial reserves of conventional resources. As a result, environmental issues have become major concern due to the continuous emission of carbon dioxide in to the atmosphere causing global warming. Renewable generation is more efficient as it is obtained from sources that are reliable and inexhaustible and does not release any greenhouse gas (GHG) or toxic gases when producing electricity [1-4]. Hence, renewable energy technology is an optimum solution that has a much lower environmental impact than other conventional energy technologies [5,6]. In 2007, Australian government ensured that by 2020 the share of renewable energy in total electricity generation should be of 20%. Hence, integration of Renewable energy sources is required forming a hybrid energy system with better efficiency and cost of energy. Victoria’s total renewable generation for 2012 was 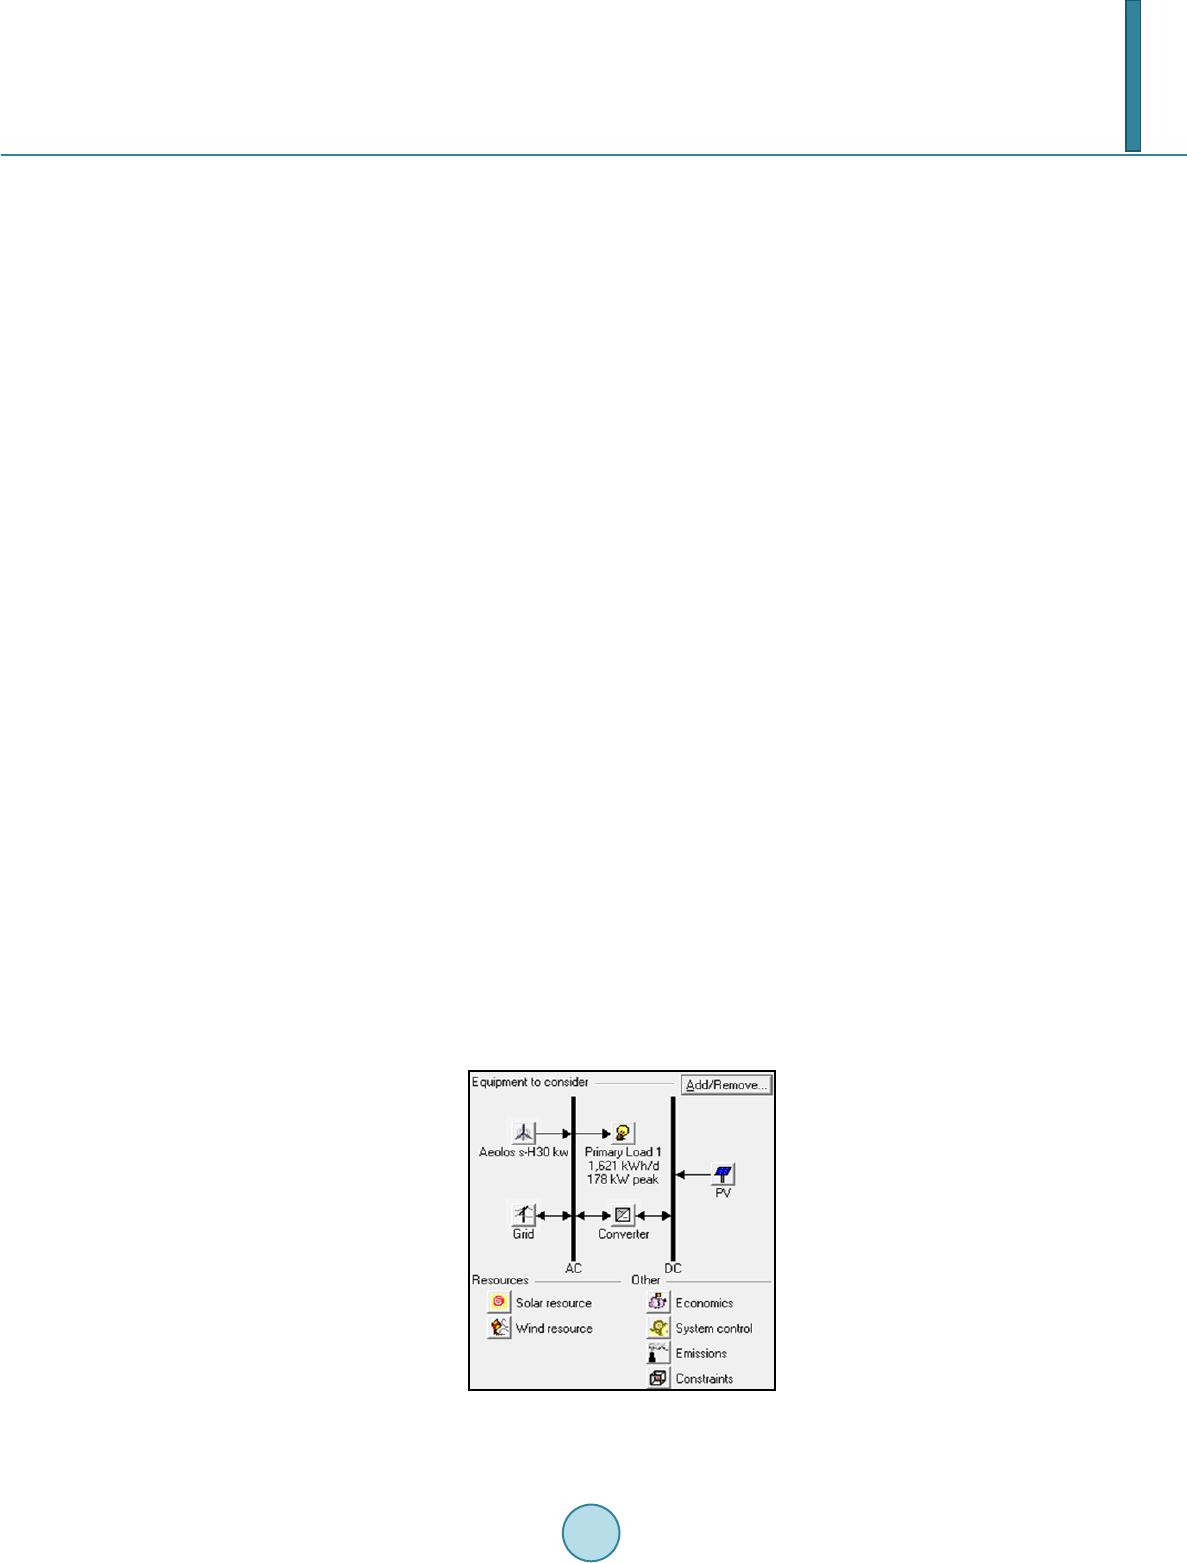 K. S. V. Swarna et al. around 3825 Giga-watt hours which is nearly 30% more than the generation in 2011 [7,8]. Wind generation is one of the fastest growing pollution free technology and cost effective among different renewable energy gener- ations [9,10]. Solar PV has also experienced rapid growth driven largely by house hold systems [5]. This paper investigates the prospects of renewable energy (RE) sources and identifies the most suitable places of semi-arid region in particular North East region in Victoria for wind and solar considering economical per- formance metrics COE and NPC [11,12]. This paper also focuses on emission analysis by considering the per- formance metrics RF and GHG emission [13]. Details of these performances metrics are available in [14,15]. This study developed hybrid models with HOMER and conducted sensitivity analysis with different probabili- ties to know the suitable options considering different meteorological conditions. This paper is organized in the following manner: Section II describes the Hybrid Renewable Energy Model, Section III gives the complete op- timization and sensitivity analysis and finally section IV concludes the paper with future analysis. 2. Hybrid Renewable Energy System Hybrid power systems combine two or more energy conversion mechanisms, or two or more fuels for the same mechanism, that when integrated, overcome limitations inherent in either. Hybrid systems provide a high level of energy security and reliability through the integrated mix of complementary generation methods, and often will incorporate a storage system (battery, fuel cell) or fossil-fueled power generation to ensure consistent supply [16,17]. This section concentrates on system modeling, energy resources used, electric load, standard grid and the converter. In this analysis a hybrid energy system is designed with an integration of solar and wind power generation system. Figure 1 shows the Hybrid energy system modeling in HOMER with solar and wind resources. In this model, a separate storage device is not used for ease of operation as the grid itself acts as a storage device. The following sections gives the additional information for load, renewable energy resources and the other components used in the hybrid power systems. 2.1. Elecric Load The average load profile considered in this analysis is on the Victorian monthly load demand. Scaled annual av- erage load for the current system is 1621 kWh/day and the annual peak load is 178 kWh. Figure 2 shows the average load profile and it is observed that the highest load demand is seen in the month of November. 2.2. Renewable Energy Resources Data have been collected from Bureau of Meteorology (BOM) [18] for North East region and based on the maximum annual solar irradiance three best locations are chosen for PV generation and based on maximum an- nual wind speeds other three locations are selected for wind generation. Therefore, in total six locations are identified from North East region and simulations are performed with HOMER. Table 1 shows the annual av- erage wind speed and solar irradiance of six locations considered in the study. Figure 1. Hybrid renewable energy system with HOMER. 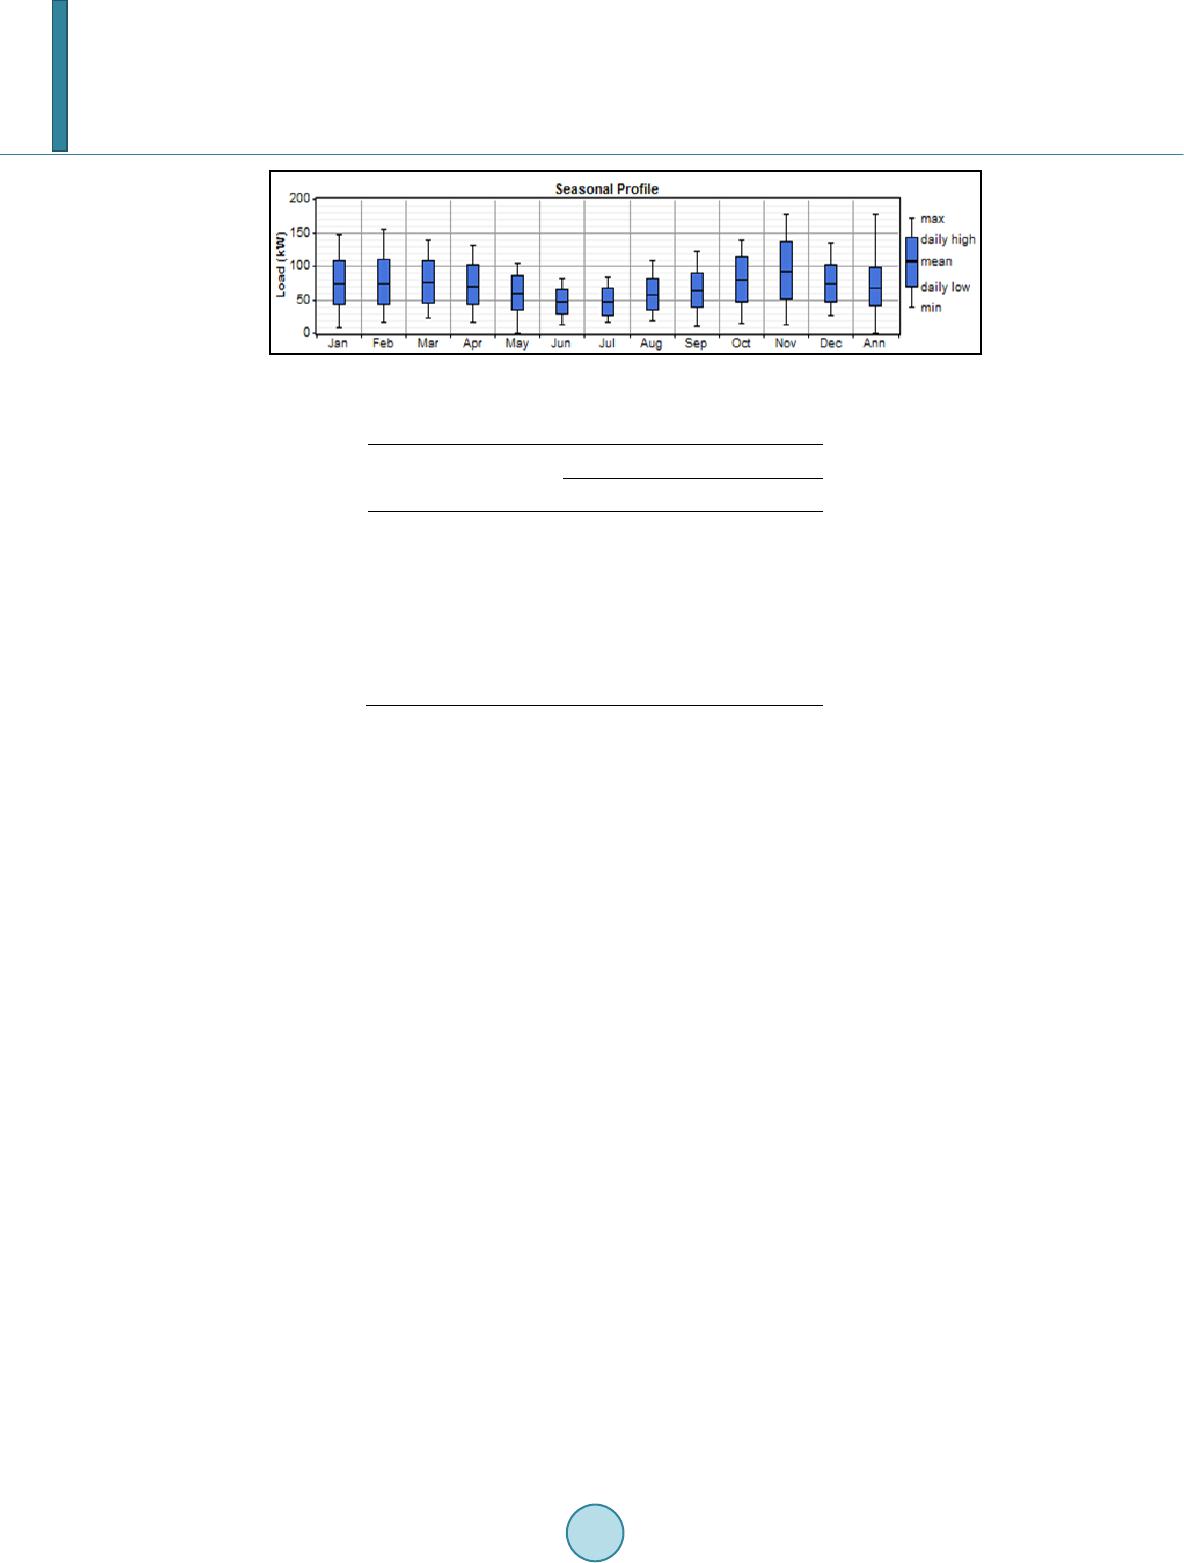 K. S. V. Swarna et al. Figure 2. Average load profile for a year. Table 1. Annual average of wind and solar in six regions. Location Annual average Wind (m/sec) Solar (kWh/m2/) Mount Hotham 6.9 4.3 Falls creek 6.3 4.3 Mount Buller 5.6 4.3 Wangaratta 1.7 4.8 Edi upper 2.7 4.7 Benalla 2.2 4.3 2.2.1. Wind Energy Resource From the Table 1 it is clear that the wind speed is maximum for the Mount Hotham area which is around 6.9 m/sec followed by Falls Creek and Mount Buller. Figure 3 demonstrates the monthly wind speed variations of Mount Hotham with maximum annual average and it is observed that the wind energy is maximum in summer from the month of September to March. 2.2.2. Solar Energy Resource HOMER uses the daily solar resource inputs to calculate the PV array power for each hour of the year. From the Table 1, it can be observed that Wangaratta location has maximum annual solar irradiance of 4.8 kWh/m2/day. Figure 4 shows the clearness index and its value is varied from 0.46 to 0.64 and the maximum solar radiation observed is in the month of December. 2.3. Component Details The essential components for this model are Photovoltaic modules, wind turbine, converter and standard grid. 2.3.1. Photovoltaic The capital cost for a 1.0 kW photovoltaic array considered in this analysis is $2100 with a replacement cost of $2000. For optimum solution, the O&M cost is practically considered to be zero. Sizes of photo voltaic cells to be considered are from 0 to 250 2.3.2. Wind Turbine For simulation Aeolos s-H30, 30 kW wind turbine is considered with a capital cost of $66,000 [19] and with ze- ro O&M. The sizes to consider during this analysis are 10, 12 and 14. Figure 5 shows the power curve for the assumed wind turbine. 2.3.3. Power Converter Converter serves the purpose of both rectifier and inverter. The DC energy from the photovoltaic is converted into AC using an inverter. For 1 kW of energy, the installation cost is considered to be $800 and the replacement cost is assumed to be $750. The life time is assumed to be 20 years considering an efficiency of 90%. 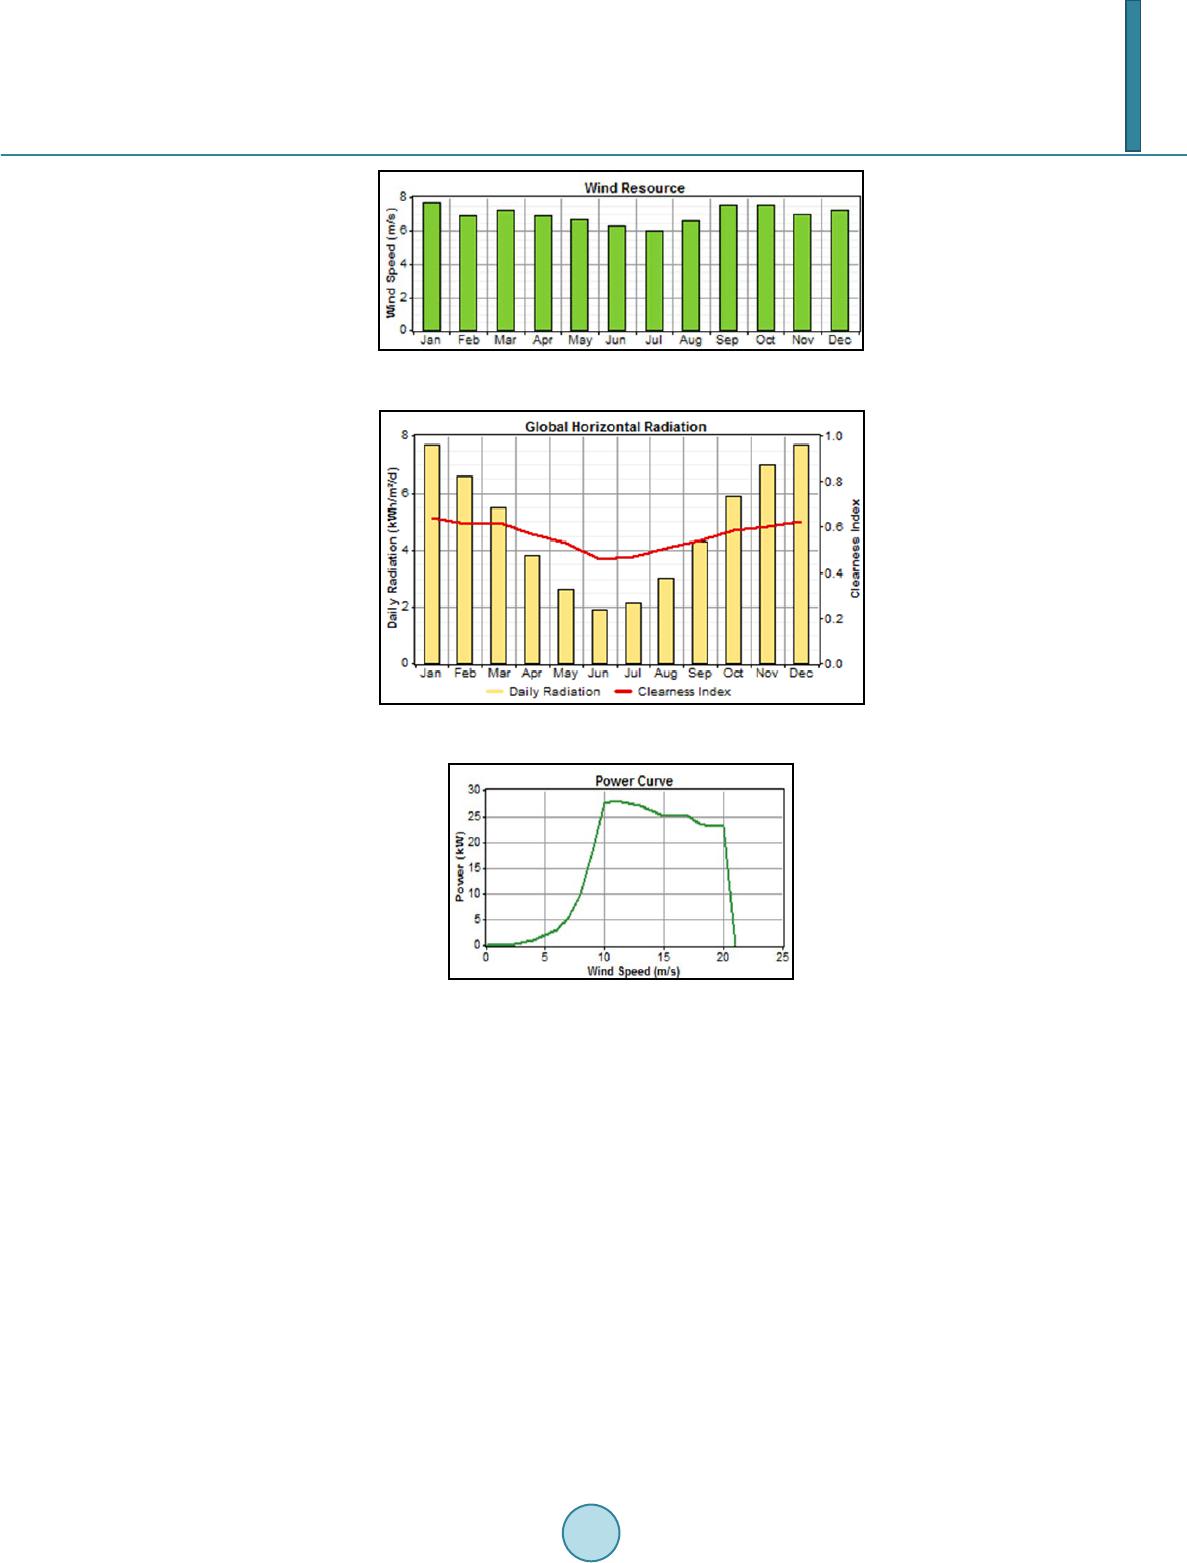 K. S. V. Swarna et al. Figure 3. Wind variations for Mount Hotham region. Figure 4. Average solar irradiance for Wangaratta. Figure 5. Power curve for Aeolos s-H30 wind turbine. 2.3.4. Grid Grid acts as backup component supplying energy to meet the demand load during surplus energies. Hence in this model separate battery is not used for storage and the grid itself is acting as a storage device [20]. A standard grid price of 0.4 $/kWh is maintained throughout the study. 3. Result Analysis This study provides the results in terms of optimization and sensitivity analysis using HOMER simulation tools. Optimization results are important as this provides the economic feasibility and environmental friendly informa- tion under specific meteorological conditions. Whereas, sensitivity analysis is a measure that checks the sensi- tivity of a model while changing the value of the parameters of the model which helps in decision making. This model has been simulated and analyzed based on the sensitivity variables wind speed, solar irradiation, and grid electricity price. 3.1. Optimization Results The data collected from BOM is given as inputs to HOMER model and is used for calculating the NPC, COE 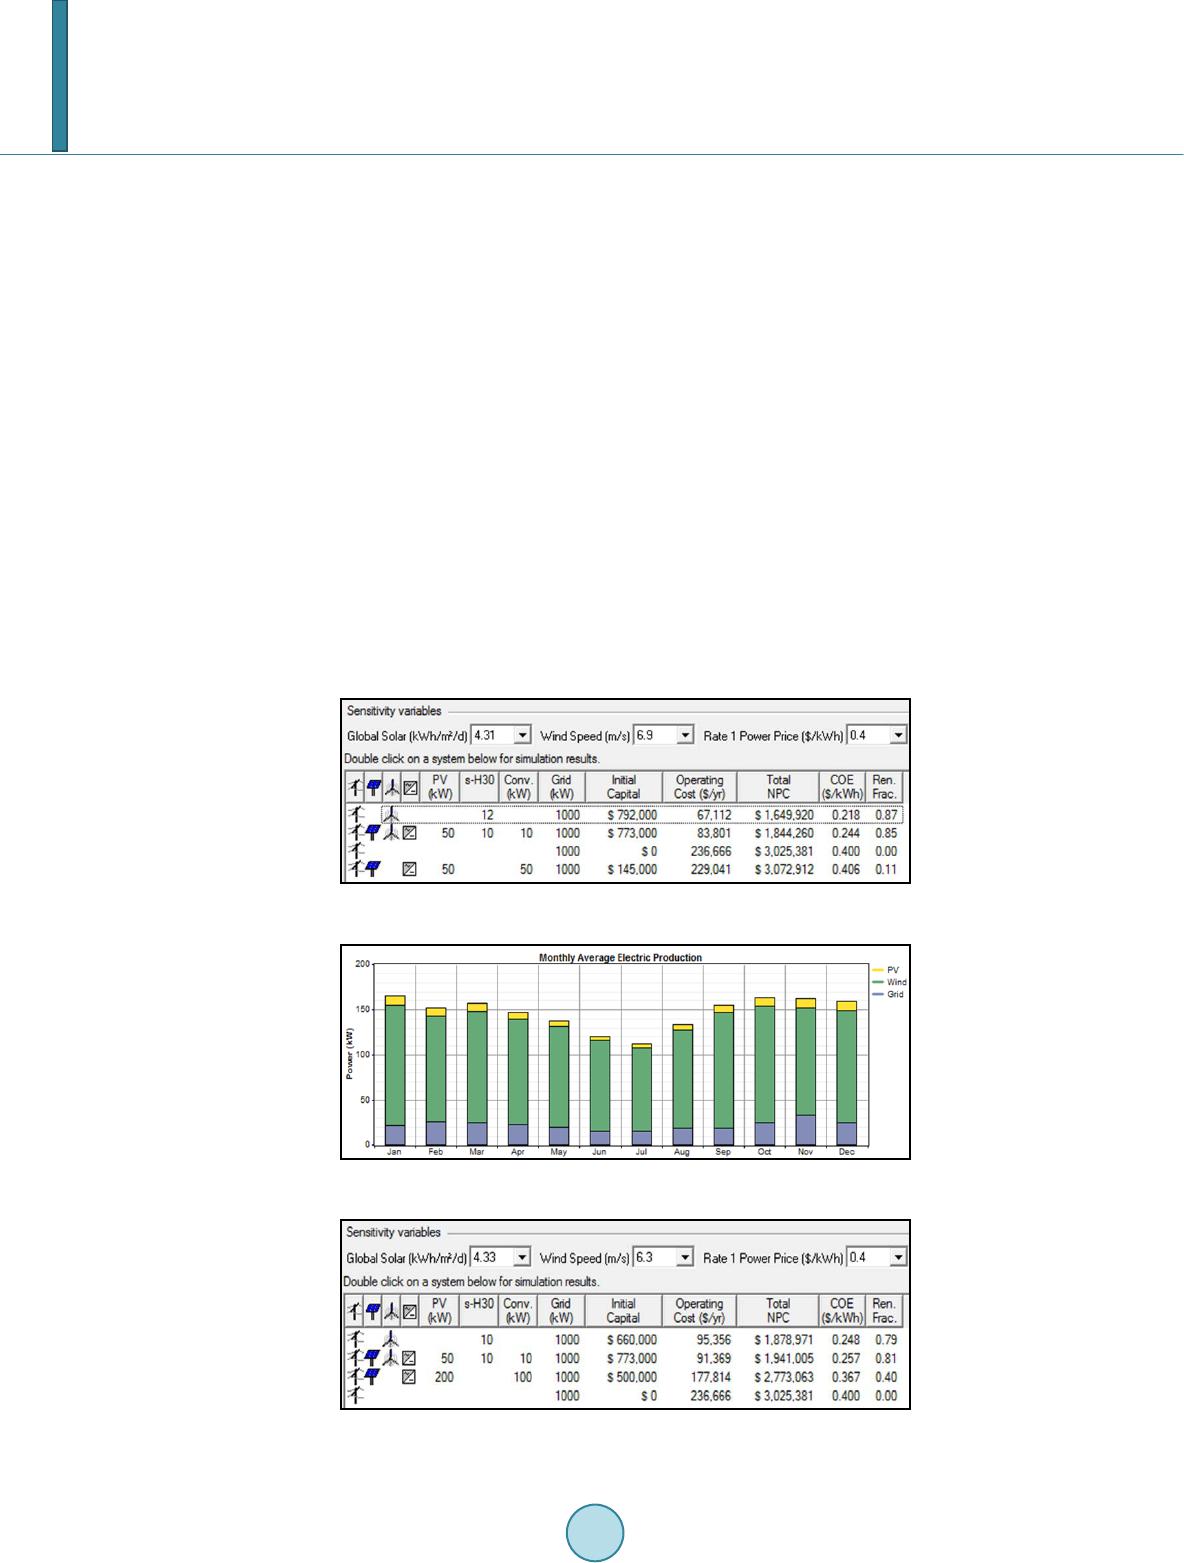 K. S. V. Swarna et al. and RF. Simulation results are calculated for the six locations as stated in Table 1. From Figure 6, it is observed that NPC and COE for Mount Hotham are reduced to 55% with the integration of wind energy into the grid in place of only grid connected systems.NPC, COE and RF of wind/grid connected system are $1,649,920, 0.218 $/kWh and 87% while in the wind/PV/grid connected system are $1,844,260, 0.224 $/kWh and 85% respec- tively. From Figure 7 it has been evident that from a wind/PV/Grid connected systems average electricity pro- duction from wind, PV and grid are 80%, 5% and 15% respectively. Therefore, it can be concluded that both wind/grid and wind/PV/grid connected systems are feasible in the Mount Hotham both economically and envi- ronmentally though the wind has more contribution than the solar energy as wind is available 24 hours a day while solar is available only 7 to 8 hours a day. Similarly, optimization results for Falls Creek and Mount Buller are analyzed and their performance metrics are compared. Figure 8 shows the optimization results for Falls Creek and it has been seen that for COE and NPC of wind/grid system are 0.248 $/kWh and $1,878,971 respectively. These values are compared with wind/ PV/grid system’s performance metrics and it is observed that the system is giving an optimum solution meaning that this location is also suitable for both wind/grid and wind/PV/grid systems. Optimization results for Mount Buller location with an average wind speed of 5.6 m/sec and with a solar irra- diance of 4.33 kWh/m2 are shown in Figure 9. It can be seen that the renewable fraction of 0.71 is observed with a total NPC of $2,208,884 for wind/grid system where as for a wind/PV/grid system observed NPC are $2,254,134 with a RF of 0.74. For PV/grid connected system RF is only 40% with a COE of $0.367. Therefore, from these analyses it can be clearly evident that Mount Hotham is the best suitable location in North East re- gion of Victoria for wind energy generation. On the other hand, Wangaratta, Edi upper and Benalla are identified as the most suitable places for solar Figure 6. Optimum results for Mount Hotham location. Figure 7. Average electricity production for Mount Hotham. Figure 8. Optimum results for Falls Creek location.  K. S. V. Swarna et al. energy generation. From Figure 10, it can be seen that the performance metrics for PV/grid module for Wanga- ratta are much better than the only grid based system. The NPC and COE of PV/grid connected system are $2,479,722 and 0.343 $/kWh while in only grid connected system are $2,891,005 and 0.400 respectively. Wind energy generation in this location is not promising at all due to unavailability of wind resources. Figure 11 and Figure 12 show the simulation results for Edi upper and Benalla locations. In Edi Upper, COE and NPC are 0.356 $/kWh and $2,694,28 while in Benalla, COE and NPC are 0.360 $/kWh and $2,722,924 for a PV/grid connected system respectively. Considering measured performance metrics, PV/grid connected sys- tem is more promising compare to PV/wind/grid connected, wind/grid connected and only grid connected sys- tem due to high availability of solar resources and poor availability of wind sources in these locations. However, Edi Upper has better prospects of wind energy compare to Wangaratta and Benalla. Finally, Table 2 detailed the performance measures of the four studied system. It can be stated that, consider- ing measured performance metrics Mount Hotham is the best location for wind energy generation while Falls Creek and Mount Buller is the second and third suitable location respectively. On the other hand, Wangaratta is Figure 9. Optimum results for Mount Buller location. Figure 10. Optimum results for Wangaratta location. Figure 11. Optimum results for Edi upper location. Figure 12. Best Optimum results for Benalla location.  K. S. V. Swarna et al. Table 2. Performance metrics comparisons for six locations with all possible combinations. Location Wind/grid PV/grid Wind/PV/grid Grid only NPC COE RF NPC COE RF NPC COE RF NPC COE RF Mount Hotham 1,649,920 0.218 0.87 3,072,912 0.406 0.15 1,844,260 0.244 0.88 3,025,381 0.400 0.00 Falls Creek 1,878,971 0.248 0.79 2,772,063 0.400 0.40 1,941,005 0.257 0.81 3,025,381 0.400 0.00 Mount Buller 2,208,844 0.292 0.71 2,775,386 0.367 0.40 2,254,134 0.298 0.74 3,025,381 0.400 0.00 Wangaratta 3,819,903 0.529 0.03 2,479,722 0.343 0.45 3,433,394 0.475 0.48 2,891,005 0.400 0.00 Edi Upper 3,617,464 0.478 0.15 2,694,285 0.356 0.43 3,408,398 0.451 0.50 3,025,381 0.400 0.00 Benalla 3,829,446 0.506 0.07 2,722,924 0.360 0.42 3,580,495 0.473 0.47 3,025,381 0.400 0.00 the best place for solar energy generation while Edi Upper and Benalla are the second and third suitable places respectively. Considering combination of both wind and PV generation Mount Hotham is the best place in the North East region of Victoria. However, wind energy has more contribution compare to solar PV in the hybrid power system due to their continuous availability. 3.2. Sensitivity Results Sensitivity analysis shows the impact of variation in the solar irradiation and the wind speed on the performance of the hybrid system. Based on the scaled annual average value the suitable variables are selected and the simu- lations are verified for each case. The sensitivity variables considered for solar irradiation are 5.0, 5.5, 6.0, 6.5, 7.0 and for wind speed are 6.9, 7.0, 7.5, 8.0. Figure 13 shows the line graph between the wind speed and the carbon dioxide emission for Mount Hotham location and from the graph it is clear that the with the increase in the wind speed there is a gradual decrease in the carbon dioxide emission and increase in renewable fraction re- ducing the GHG emissions in the atmosphere. From Figure 14 it has seen that with the increase of solar radiation, total operating cost of energy gener ation is decreasing as well as CO2 emissions is decreasing as energy generation from solar is increasing. Figure 15 shows the sensitivity results of Mount Hotham location in which it has seen that a wind/PV/grid connected system is only suitable when the solar radiation is above 4.8 kWh/m2/d otherwise wind/grid con- nected system is preferable. This figure also represents the total operating cost with different meteorological conditions and it has observed that the cost of energy generation is decreasing with the increased integration of wind and solar energy into the grid. Figure 16 shows the surface plot for Wangaratta location in which Grid energy cost and Total Net Present Cost are measured with a fixed wind speed of 1.7m/sec by setting global solar and electricity price as variables. Different possible combinations are verified and it is found that the system would be optimum at certain sensi- tivity variable resulting in a feasible solution. 4. Conclusions and Future scope This paper analyses the prospects of Renewable energy in Semi-arid region. A Hybrid model was developed for the North East region of Victoria and identified the best locations for renewable energy generation. A compari- son is made among the six locations in terms of NPC, COE, and RF. It is observed that a location which is suit- able for wind energy generation also feasible for wind/PV/grid system due to the maximum wind probability. It was also found that Mount Hotham is the most suitable place for wind generation followed by Falls Creek and Mount Buller in the North East region of Victoria. These locations are also suitable for wind/PV/grid systems. On the other hand, solar is feasible in Wangaratta, Edi Upper and Benalla locations in which Wangaratta is the best suitable location. From the optimization and sensitivity results, it is clearly evident that integration of re- newable energy, in particular, wind and solar energy into the grid not only reduces the energy crisis worldwide but also reduces the energy costs and GHG emissions. Therefore, renewable energy plays a significant role in developing a climate-friendly sustainable society for the future both nationally and internationally. This funda- mental study can be used by the utilities to facilitate large-scale renewable energy integration into the grid. This  K. S. V. Swarna et al. Figure 13. Comparison of wind speed and CO2 emissions. Figure 14. Comparison of solar irradiation and CO2 emissions. Figure 15. Sensitivity analysis for Mount Hotham location.  K. S. V. Swarna et al. Figure 16. Sensitivity analysis for Wangaratta location. study is still in its preliminary phase, and further investigations are required in the following areas: • Details analysis with a larger volume of data considering transmission and other socio-environmental fac- tors; • Integration of a storage system into the model and compare the revised performance metrics. References [1] Abbasi, T. and Sa, A. (2010) Renewable Energy Sources: Their Impact on Global Warming and Pollution. PHI Learn- ing Pvt. Ltd., New Delhi. [2] Akella, A., Saini, R. and Sharma, M. (2009) Social, Economical and Environmental Impacts of Renewable Energy Sys te m s. Renewable Energy, 34, 390-396. http://dx.doi.org/10.1016/j.renene.2008.05.002 [3] Gol, O. (2008) Renewable Energy—Panacea for Climate Change? Proceedings of ICREPQ, 8, 28. [4] Shafiullah, G., Amanullah, M., Ali, A.S., Ja rvis, D. and Wolfs, P. (2010) Economic Analysis of Hybrid Renewable Model for Subtropical Climate. International Journal of Thermal & Environmental Engineering, 1, 57-65. http://dx.doi.org/10.5383/ijtee.01.02.001 [5] Foster, R., Ghassemi, M. and Cota, A. (2009) Solar Energy: Renewable Energy and the Environment. CRC Press, Bo- ca Raton. http://dx.doi.org/10.1201/9781420075670 [6] Shafiullah, G., Amanullah, M., Shawkat Ali, A., Jarvis, D. and Wolfs, P. (2012) Prospects of Renewable Energy—A Feasibility Study in the Australian Context. Renewable Energy, 39, 183-197. http://dx.doi.org/10.1016/j.renene.2011.08.016 [7] Authority, A.C.C. (2013) Government Response to Climate Change Authority 2012—Review of RET. http://www.climatechange.gov.au/reducing-carbon/news-article/government-response-climate-change-authoritys-2012- review-ret-sch eme [8] A.G.D.O. Environment (2001) C.C.D.O. Environment, Renewable Energy Target. [9] Nelson, V. (2009) Wind Energy: Renewable Energy and the Environment. http://deakin.eblib.com.au/patron/FullRecord.aspx?p=427069 [10] Ackermann, T. (2005) Wind Power in Power Systems Vol. 140. Wiley Online Library. http://dx.doi.org/10.1002/0470012684 [11] Dekker, J., Nthontho, M., Chowdhury, S. and Chowdhury, S. (2012) Economic Analysis of PV/Diesel Hybrid Power Systems in Different Climatic Zones of South Africa. International Journal of Electrical Power & Energy Systems, 40, 104-112. http://dx.doi.org/10.1016/j.ijepes.2012.02.010 [12] Dalton, G., Lockington, D. and Baldock, T. (2009) Case Study Feasibility Analysis of Renewable Energy Supply Op- tions for Small to Medium-Sized Tourist Accommodations. Renewable Energy, 34, 1134-1144. http://dx.doi.org/10.1016/j.renene.2008.06.018  K. S. V. Swarna et al. [13] Beccali, S.B.M., Cellura, M. and Franzitta, V. (2008) Energy, Economic and Environmental Analysis on Ret-Hydrogen Systems in Residential Buildings. Renewable Energy, 33, 366-382. [14] Liu, G., Rasul , M., Amanullah, M. and Khan, M.M.K. (2011) Feasibility Study of Sta nd-Alone PV-Wind-Biomass Hybrid Energy System in Australia. Power and Energy Engineering Conference (APPEEC), 1-6. [15] Liu, M.G.R.G. and Amanullah, M.T.O. (2010) Economic and Environmental Modeling of a Photovoltaic-Wind-Grid Hybrid Power System in Hot Arid Australia. [16] HOMER (2010) HOMER Energy. http://www.homerenergy.com/ [17] Khan, M. and Iqbal M., (2005) Pre-Feasibility Study of St and-Alone Hybrid Energy Systems for Applications in New- foundland. Renewable energy, 30, 835-854. http://dx.doi.org/10.1016/j.renene.2004.09.001 [18] Bureau Australia (2013) Bureau of Metrology. http://www.bom.gov.au/ [19] AEOLOS (2013) AEOLOS Wind Turbine. http://www.windturbinestar.com/ [20] van Alphen, K., van Sark, W.G. and Hekkert, M.P. (2007) Renewable Energy Technologies in the Maldives-Deter- mining the Potential. Renewable and Sustainable Energy Reviews, 11, 1650-1674. http://dx.doi.org/10.1016/j.rser.2006.02.001
|