 Journal of Computer and Communications, 2014, 2, 108-116 Published Online March 2014 in SciRes. http://www.scirp.org/journal/jcc http://dx.doi.org/10.4236/jcc.2014.24015 How to cite this paper: Kiran, M.S. and Babalik, A. (2014) Improved Artificial Bee Colony Algorithm for Continuous Optimi- zation Problems. Journal of Computer and Communications, 2, 108-116. http://dx.doi.org/10.4236/jcc.2014.24015 Improved Artificial Bee Colony Algorithm for Continuous Optimization Problems Mustafa Servet Kiran, Ahmet Babalik Computer Engineering Department, Selçuk University, Konya, Turkey Email: mskiran@selcuk .edu.tr, ababalik@selcuk. edu.tr Received Novemb er 2013 Abstract The artificial bee colony (ABC) algorithm is a swarm-based metaheuristic optimization technique, developed by inspiring foraging and dance behaviors of honey bee colonies. ABC consists of four phases named as initialization, employed bee, onlooker bee and scout bee. The employed bees try to improve their solution in employed bees phase. If an employed bee cannot improve self-solu- tion in a certain time, it becomes a scout bee. This alteration is done in the scout bee phase. The onlooker bee phase is placed where information sharing is done. Although a candidate solution improved by onlookers is chosen among the employed bee population according to fitness values of the employed bees, neighbor of candidate solution is randomly selected. In this paper, we pro- pose a selection mechanism for neighborhood of the candidate solutions in the onlooker bee phase. The proposed selection mechanism was based on information shared by the employed bees. Average fitness value obtained by the employed bees is calculated and those better than the aver- age fitness value are written to memory board. Therefore, the onlooker bees select a neighbor from the memory board. In this paper, the proposed ABC-based method called as iABC were ap- plied to both five numerical benchmark functions and an estimation of energy demand problem. Obtained results for the problems show that iABC is better than the basic ABC in terms of solution quality. Keywords Artificial Bee Colony; Selection Mechanism; Memory Board; Numerical Optimization; Energy Estimation 1. Introduction In recent years, many swarm intelligence-based optimization methods such as ant colony optimization (ACO), particle swarm optimization (PSO) and artificial bee colony algorithm (ABC) have b een investigated by re- searchers. ACO simulates behaviors of real ants between nest and food sources [1], PSO simulates social beha- viors of bird flocking or fish schooling [2] and ABC is developed by Karaboga, inspiring by intelligent beha- viors of foraging and dance of honey bee colonies [3]. The performance and accuracy of ABC were examined on the numeric problems with multi-dimensional and compared with the PSO, differential evolution (DE), evo- lutionary algorithm (EA) and genetic algorithm (GA) [4-6].  M. S. Kiran, A. Babalik Since invention of ABC 2005, studies on ABC in the literature have increased significantly. The ABC was used for designing of digital IRR filters by Karaboga [7], Singh used it for leaf-constrained minimum spanning tree problem [8], Rao et al. proposed ABC for optimization of distribution network configuration for loss reduc- tion [9]. The ABC was implemented to solve quadratic minimum spanning tree problem by Sundar and Singh [10]. A modified ABC for real parameter optimization was proposed by Akay and Karaboga [11]. Karaboga and Akay modified ABC for solving constrained optimization problems by using Deb’s rules [12]. Pan et al. devel- oped a discrete model of ABC for lot-streaming flow shop scheduling problem [13]. The ABC was also used for solving reliability redundancy allocation problems [14], neural networks training [15], software test suite opti- mization [16]. In addition, Gbest-guided ABC for numerical function optimization was proposed by Zhu and Kwong [17] and Alatas proposed a chaotic artificial bee colony algorithm for avoiding to get stuck on local so- lutions [18]. According to above applications and modifications of ABC, the algorithm is highly successful for optimiza- tion problems. But when ABC algorithm analyzed, it is seen that neighbor selection is done completely at ran- dom. In brief, information moved to hive by employed bees is not used for neighbor selection by onlooker bees. In this paper, a selection mechanism which grows up information sharing was proposed for onlooker bees. The rest of paper is organized as follows; ABC algorithm is explained in Section 2, improved ABC (iABC) is presented in Section 3, five numerical benchmark functions, energy estimation problem and experimental results are given in Section 4. Results and discussions are presented in Section 5 and finally, Section 6 presents conclu- sion and future works. 2. Artificial Bee Colony (ABC) Optimization Algorithm ABC is a population based optimization algorithm and tries to achieve global minimum or maximum iteratively. The termination conditions for ABC should be maximum cycle number or acceptable error value. The popula- tion in ABC hive consists of three kinds of bees; employed bees, onlooker bees and scout bee. The employed bees and onlooker bees exploit nectar sources found around the hive and the scout bee explores the solution space. In ABC algorithm, number of nectar sources around the hive equals to number of employed bees. Addi- tionally, number of employed bees equals to number of onlooker bees. In a cycle, number of scout bee in ABC algorithm can be one. The ABC algorithm have four phases sequentially realized; initialization, employed bee, onlooker bee and scout bee phases. 2.1. Initialization ABC algorithm begins to work by randomly producing solutions. The initial solutions are produced for em- ployed bees by using Equation (1). minmax min , (), 1,1 ij jjj xx xxiNjD λ =+−= = (1) where, is jth dimension of ith employed bee, and is lower and upper bounds of jth parame- ters, respectively, is a random number in range of [0,1], N is the number of employed bee and D is the di- mensionality of the optimization problem. In addition, the abandonment counter (AC) of each employed bee is reset in this phase. 2.2. Employed Bee Phase First, in this phase, new candidate solutions are produced for each employed bees. First, the solution of em- ployed bee is copied to new candidate solution ( ). Then, only one parameter of solution is updated by us- ing Equation (2). ,, ,, (),{1, 2,,},{1, 2,,}and ijijij kj vxxxikNjDik φ =+− ∈∈≠ (2) where, jth dimension of ith candidate solution, is jth dimension of ith employed bee, is jth di- mension of kth employed bee, is a random number in range of [−1,+1], N is the number of employed bee and D is the dimensionality of the optimization problem. Also, the neighbor of candidate solution (k) and di-  M. S. Kiran, A. Babalik mension of the problem (j) are randomly selected among the employed bee population and between dimensio- nality of the problem. After the new candidate solutions were produced and calculated the objective function values specific for the problem, fitness values of candidate solutions and solutions of employed bees are calculated as follows: 1if( 0) 1 1( )otherwise i i i i f f fit abs f ≥ + = + (3) where, is the fitness value of ith employed bee, is the objective function value of ith the employed bee. If the fitness value of candidate solution is better than fitness value of employed bee, the employed bee is re- placed with candidate solution ( ) and the abandonment counter of the employed bee is reset, otherwise abandonment counter is increased by 1 ( ). 2.3. Onlooker Bees Phase In ABC algorithm, each onlooker bee chooses an employed bee in order to improve its solution. This selection is done according to fitness values of employed bees by roulette wheel given in Equation (4). (4) where, pi is probability of being selected ith employed bee. The onlooker bees try to improve solution of the se- lected employed bee by using Equation (2). If the fitness value of the new solution found by the onlooker bee is better than fitness value of the solution of the employed bee, the onlooker bee is changed with the employed bee and the abandonment counter of the employed bee is reset, otherwise the abandonment counter is increased by 1 ( ). Briefly, onlooker and employed bees uses same equation for exploitation food sources. Although onlooker bees watch the dance of employed bees in dance area of the hive, neighborhood selection is fully random (xi Equation (2)). 2.4. Scout Bee Phase The abandonment counters of all employed bees are tested with a number which is decided by designer (limit). The employed bee, which cannot improve self-solution until the abandonment counter reaches to the limit, be- comes scout bee. Hereafter, a solution is produced for the scout bee by using Equation (1) and the abandonment counter is reset. The scout bee, which a solution was produced for itself, becomes the employed bee. Therefore, scout bees in ABC algorithm prevent stagnation of employed bee population. After the above explanations, flowchart of ABC algorithm is given Figure 1. 3. Proposed Selection Mechanism for the Onlooker Bees The employed bees of ABC algorithm exploit nectar sources and move position information about the nectar sources to the hive and share the position information with onlooker bees by dancing in the dance area of the hive. The onlooker bees choose solutions of employed bees by roulette wheel selection based on fitness values of employed bees and try to improve the solutions. Although onlooker bees watch the dance, neighbor selection of onlooker bees is fully random (xk in Equation (2)). Briefly, the onlooker bees have not considered information shared for own neighbor selection. We proposed a board to be used neighborhood selection by inspiring bee colony optimization model [19]. After employed bee phase, average fitness values obtained from employed bees is calculated as follows: (5) where, is average fitness values of employed bees population at iteration t and N is number of 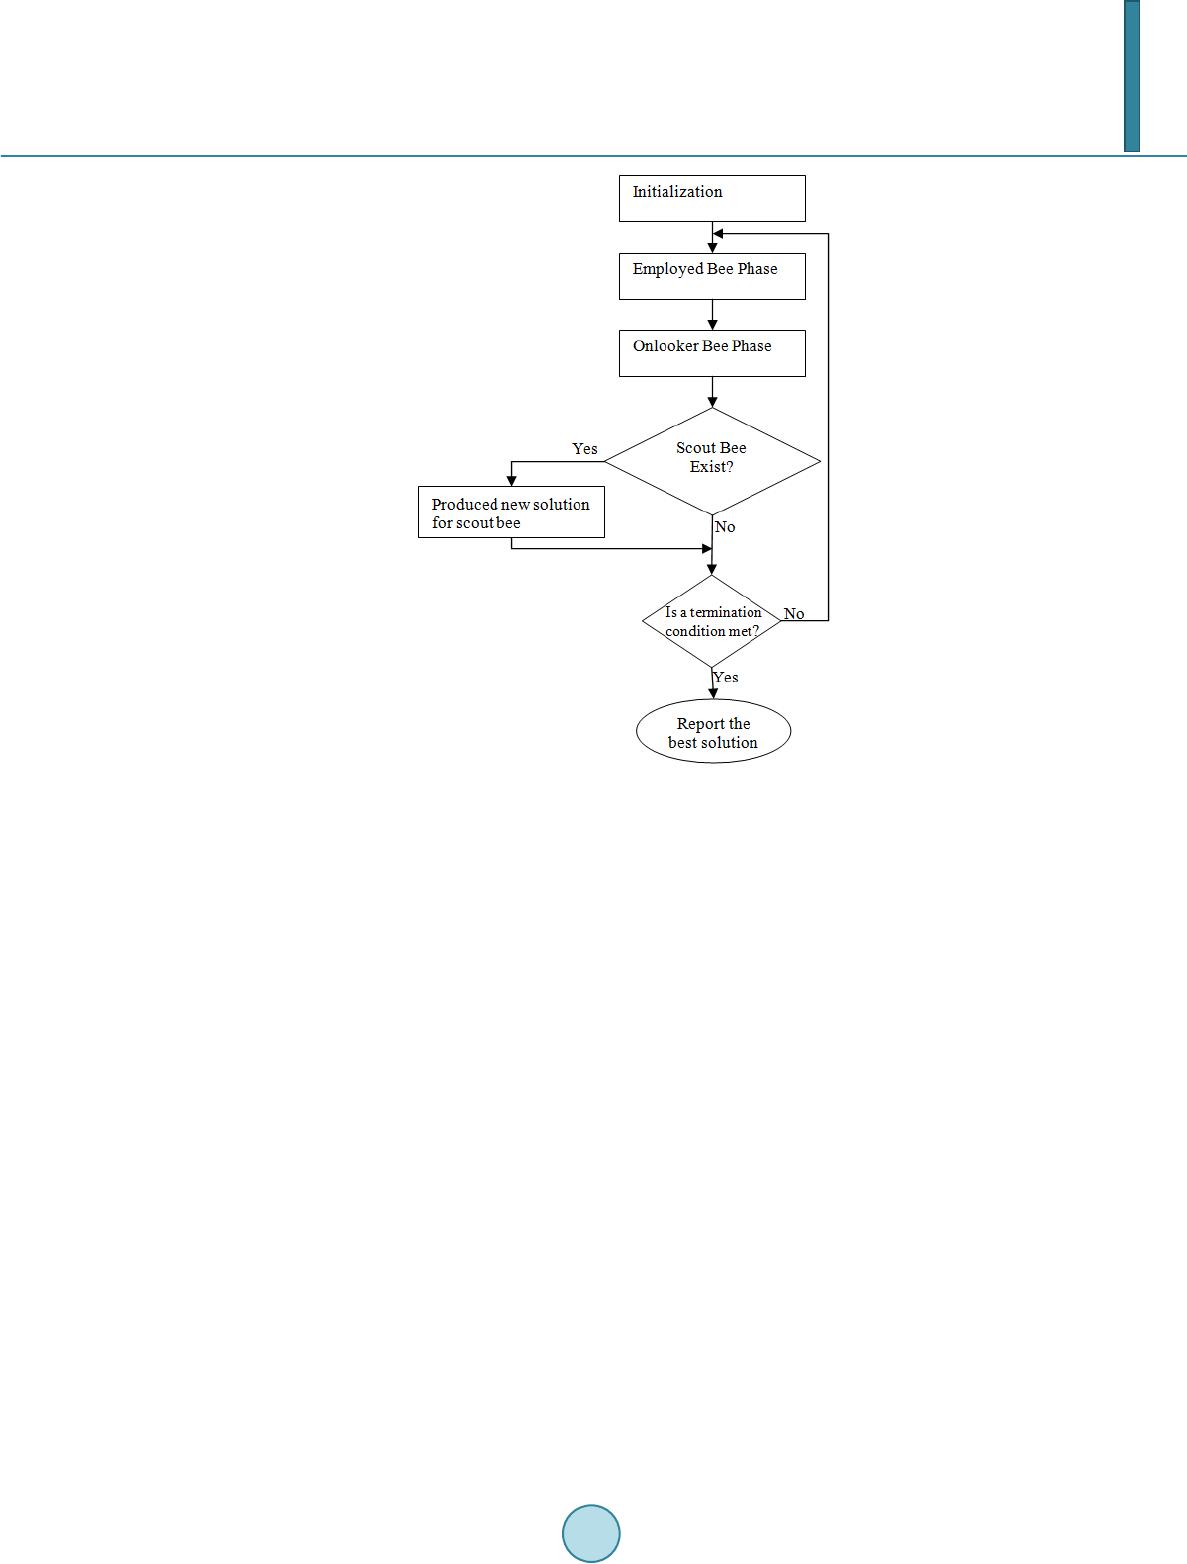 M. S. Kiran, A. Babalik Figure 1. The flowchart of ABC. employed bees. The fitness values of employed bees are tested with and the solutions of employed bees, which are better than , are written to the board. Duration on the board of solutions is calculated by Equation (6). (6) where, is a positive constant number, is fitness value of ith employed bees and Di is waiting time on the board of the solution and waiting time of the solutions is proportional to fitness values of employed bees. As a result, neighbors for onlooker bees (xk in Equation (2)) are no longer selected from the board. 4. Experiments In order to test performance and accuracy of ABC and iABC, two different experiments were designed. In first experiment, performance and accuracy of the iABC were examined on well-known five benchmark functions taken from [5,6,17] and compared with the basic ABC. The accuracy of the proposed algorithm was also tested on the energy demand estimation problem. For all experiments, the population size is 50, limit which controls scout bee occurrence is set 500 for ABC and iABC. 4.1. Experiment 1 In order to minimize the benchmark functions given in Table 1, iABC and the basic ABC algorithm were ap- plied. “Dim ” and “Range” columns in the table are dimensionality of functions and upper and lower bounds of the dimensions, respectively. In these ranges, the global minimum values of all benchmark functions are 0. The maximum cycle number used for termination of the algorithms is 5000 and the algorithms were repeated 30 times with random seeds for each function and reported the mean results and standard deviations. K constant number used for adjusting waiting time of solutions on the board in iABC, was searched in range of [20, 210] and obtained results were given in Table 2.  M. S. Kiran, A. Babalik Table 1. Benchmark functions used in experiment. Function D Range Formulation (Sphere) 40 [−100,100] (Rastrigin) 40 [−5.12,5.12] 2 1 ( )[10cos(2)10] D ii i fx xx π = =−+ ∑ (Griewank) 40 [−600,600] 2 11 1 ( )cos1 4000 D Di i ii x fx xi == =−+ ∑∏ (Ackley) 40 [−32,32] 2 11 11 ( )20exp0.2expcos(2)20 DD ii ii fxxx e DD π = = =− −−++ ∑∑ (Rosenbrock) 40 [−30,30] ( ) ( ) 122 2 1 1 ( )1001 D ii i i fxx xx − + = =− +− ∑ Table 2. The mean results of 30 runs obtained by iABC with different K constant numbers. K = 20 6.9016E−16 0 1.0325E−15 5.2047E−14 0.2506 K = 21 7.3844E−16 0 1.6653E−16 5.0981E−14 0.0345 K = 22 6.9706E−16 0 5.5511E−17 5.4534E−14 0.0809 K = 23 7.2452E−16 0 7.7716E−17 5.5600E−14 0.0686 K = 24 7.2199E−16 0 1.4433E−16 4.9205E−14 0.1473 K = 25 6.9318E−16 0 1.9873E−15 5.3468E−14 0.1924 K = 26 6.9763E−16 0 1.5543E−16 5.3113E−14 0.2957 K = 27 7.2555E−16 0 2.8866E−16 5.1692E−14 0.0256 K = 28 7.4280E−16 0 2.4425E−16 4.9205E−14 0.0608 K = 29 7.2791E−16 0 1.8874E−16 5.1692E−14 0.0228 K = 210 6.9279E−16 0 3.7748E−16 4.9916E−14 0.0361 According to Table 2, K constant number should be chosen 1, 4, 16, 256 and 512 for , , , , and in order to obtain best quality results. The best results obtained by iABC and given in Table 2 were com- pared with the basic ABC in Table 3. As it is seen from the Table 3, proposed iABC algorithm is superior than the basic ABC algorithm because the onlooker bees of iABC consider the position information shared by the employed bees and this have in- creased the exploitation ability of the iABC. 4.2. Experiment 2 Proposed algorithm is tested on energy estimation problem in this experiment. In order to solve an energy esti- mation problem, we consider the energy consumption and indicators which affects the energy consumption of Turkey. The energy consumption and related data between 1979 and 2005 was taken from Turkish Statistical Institute [20] and The Ministry of Energy and Natural Resources [21]. iABCE estimation application was developed based on linear model given in Equation (7) by using four indi- cators (Gross Domestic Products-GDP, Population, Import and Export). These indicators are commonly used in the literature [22-25] and believed that energy demand of a country is mostly affected by them. Table 4 shows four indicators and energy demand of Turkey between 1979 and 2005. It is clear that there is a linear relationship between four indicators and energy demand (Table 4). For exam- ple, while GDP, population, import and export of Turkey increased 3.4; 0.63; 22 and 31.5 times respectively,  M. S. Kiran, A. Babalik Table 3. The mean results of 30 runs obtained by the basic ABC and iABC. No Function ABC iABC Mean Standard Dev. Mean Standard Dev. 1 7.5276e−016 1.3629e−016 6.9016E−16 1.0940e−016 2 7.5791e−015 1.9653e−014 0 0 3 2.5165e−016 4.5068e−016 5.5511E−17 6.4962e−017 4 5.2995e−014 5.7007e−015 4.9205E−14 3.2536e−015 5 0.1377 0.2410 0.0228 0.0934 Table 4. Energy demand, GDP, population, ımport, export data of Turkey. Year Energy Demand (MTOE) GDP ($109) Population (106) Import ($109) Export ($109) 1979 30.71 82.00 43.53 5.07 2.26 1980 31.97 68.00 44.44 7.91 2.91 1981 32.05 72.00 45.54 8.93 4.70 1982 34.39 64.00 46.69 8.84 5.75 1983 35.70 60.00 47.86 9.24 5.73 1984 37.43 59.00 49.07 10.76 7.13 1985 39.40 67.00 50.31 11.34 7.95 1986 42.47 75.00 51.43 11.10 7.46 1987 46.88 86.00 52.56 14.16 10.19 1988 47.91 90.00 53.72 14.34 11.66 1989 50.71 108.00 54.89 15.79 11.62 1990 52.98 151.00 56.10 22.30 12.96 1991 54.27 150.00 57.19 21.05 13.59 1992 56.68 158.00 58.25 22.87 14.72 1993 60.26 179.00 59.32 29.43 15.35 1994 59.12 132.00 60.42 23.27 18.11 1995 63.68 170.00 61.53 35.71 21.64 1996 69.86 184.00 62.67 43.63 23.22 1997 73.78 192.00 63.82 48.56 26.26 1998 74.71 207.00 65.00 45.92 26.97 1999 76.77 187.00 66.43 40.67 26.59 2000 80.50 200.00 67.42 54.50 27.78 2001 75.40 146.00 68.37 41.40 31.33 2002 78.33 181.00 69.30 51.55 36.06 2003 83.84 239.00 70.23 69.34 47.25 2004 87.82 299.00 71.15 97.54 63.17 2005 91.58 361.00 72.97 116.77 73.48  M. S. Kiran, A. Babalik energy consumption of Turkey has increased 1.98 times between 1979 and 2005 years. In this experiment, the estimation of energy demand based on socio-economic indicators was modeled by using linear forms and it can be expressed as: linear 112233445 EwX wXwXwXw=⋅+⋅ +⋅+⋅ + (7) iABCE estimation model tries to optimize coefficients ( ) of design parameters ( , is GDP, is population, is import and is export). In energy demand estimation, we aim to find the fittest model to the data. The objective function of the model is given as follows: observedpredicted 2 1 min( )() R kk k fv EE = = − ∑ (8) and are the actual and predicted energy demand, respectively and k is the observations. For finding optimum set of wand setting Elinear equation, the basic ABC and iABC were applied. Population size of the methods is set as 50, maximum cycle number which used for termination condition is set as 2000 and the limit is 500. K constant number for iABC is chosen as 210. In order to increase exploitation ability of the al- gorithms, all the solutions’ parameters were updated in the onlooker bee phase at the each iteration. The methods were repeated 10 times with random seeds. The best objective function value ( ) was obtained by iABCE algorithm and the linear equation with obtained the best coefficients and the objective function value was given as follows: linear1 2 34 0.00371849 1.91274150 0.37370888 0.4837147655.91513898 E XX XX =⋅+ ⋅ +⋅−⋅− (8) The best objective function ( ) value was obtained by the basic ABC algorithm in the energy demand estimation model and the linear equation with the best coefficients and the objective function value was given as follows: linear1 2 34 0.08162763 2.03918449 0.66091803 0.6262847657.35195408 E XX XX =− ⋅+⋅ + ⋅− ⋅− (9) where, X1 is GDP, X2 is population, X3 is import, X4 is export and f(v) is sum of the squared errors. In addition, the accuracy of the models was validated by using coefficients mentioned above on the 1996- 2005 data. Table 5 shows relative errors between estimated and observed data. According to Table 5, iABC have lower relative error rates than the basic ABC algorithm and sum of absolute errors of iABC and the basic ABC are 10.59 and 17.8, respectively. Future projections of energy demand are drawn under the different scenarios belongs to future. These scena- rios were not given in this paper because Kıran et al. (2012) discussed the energy demand estimation of Turkey in detail. 5. Results and Discussion Experimental results show that, more effective usage of the information in the hive improves the quality of the solutions. While onlooker bees focus on the information that was shared by employed bees, randomization should be kept in balance. If all bees concentrate on only one employed bee or global best, the population has showed stagnation behavior and get stuck a local minimum. In order to increase exploitation ability of the basic ABC algorithm, the neighbor selection based on memory board method was added to basic ABC and the more quality solution was herewith obtained. The waiting time, which solutions will stay on the memory board, is fairly important for iABC algorithm and should be tuned considering the characteristics of optimization prob- lems.  M. S. Kiran, A. Babalik Table 5. Validation of the models. Year Observed Energy Demand (MTOE) Basic ABC iABC Estimation Energy Demand (MTOE) Relative Error (%) Estimation Energy Demand (MTOE) Relative Error (%) 1996 69.86 69.72 −0.2 69.71 −0.21 1997 73.78 72.76 −1.38 72.31 −1.99 1998 74.71 71.76 −3.95 73.3 −1.89 1999 76.77 73.07 −4.82 74.18 −3.37 2000 80.50 82.43 2.4 80.72 0.27 2001 75.40 77.89 3.3 75.72 0.42 2002 78.33 80.68 3 79.13 1.02 2003 83.84 82.59 −1.49 82.36 −1.77 2004 87.82 88.23 0.47 87.18 −0.73 2005 91.58 93.14 1.7 93.09 1.65 6. Conclusion and Future Works This paper presents an improved artificial bee colony (iABC) algorithm. iABC is based on neighbor selection mechanism for onlooker bees. As employed bees share position information with onlooker bees. The selection is only used in onlooker bee phase. It is mentioned that the control parameter of iABC (K constant) should be ad- justed depending on the structure of optimization problem. Therefore, the method proposed produced results better than ABC. In addition, future works include implementation of iABC for different continuous optimiza- tion problems. Acknowledgements The authors wish to thank “Scientific Research Projects of Selcuk University” for the institutional support. References [1] Dorigo, M. and Stützle, T. (2004) Ant Colony Optimization. MIT Press, Cambridge. [2] Eberhart, R.C. and Kennedy, J. (1995) A New Optimizer Using Particle Swarm Theory. Proceedings of the Sixth In- ternational Symposium on Micro Machine and Human Science, Nagoya, 39-43. http://dx.doi.org/10.1109/MHS.1995.494215 [3] Karaboga, D. (2005) An Idea Based on Honey Bee Swarm for Numerical Optimization. Technical Report-TR06, De- partment of Computer Engineering, Engineering Faculty, Erciyes University. [4] Karaboga, D. and Basturk, B. (2008) On the Performance of Artificial Bee Colony (ABC) Algorithm. Applied Soft Computing, 8, 687-697. http://dx.doi.org/10.1016/j.asoc.2007.05.007 [5] Karaboga, D. and Akay, B. (2009) A Comparative Study of Artificial Bee Colony Algorithm. Applied Mathematics and Computation, 214, 208-132. http://dx.doi.org/10.1016/j.amc.2009.03.090 [6] Akay, B. (2009) Performance Analysis of Artificial Bee Colony Algorithm on Numerical Optimization Problems. Ph.D. Thesis, Erciyes University, Graduate School of Natural and Applied Sciences, Kayseri. [7] Karaboga, N. (2009) A New Design Method Based on Artificial Bee Colony Algorithm for Digital IIR Fil ters. Journal of the Franklin Institute, 346, 328-348. http://dx.doi.org/10.1016/j.jfranklin.2008.11.003 [8] Singh, A. (2009) An Artificial Bee Colony Algorithm for the Leaf-Constrained Minimum Spanning Tree Problem. Ap- plied Soft Computing, 9, 625-631. http://dx.doi.org/10.1016/j.asoc.2008.09.001 [9] Rao, R.S., Narasimham, S. and Ramalingaraju, M. (2008) Optimization of Distribution Network Configuration for Loss Reduction Using Artificial Bee Colony Algorithm. International Journal of Electrical Power and Energy Systems Engineering, 1, 116-122.  M. S. Kiran, A. Babalik [10] Sundar, S. and Singh, A. (2010) A Swarm Intelligence Approach to the Quadratic Minimum Spanning Tree Problem. Information Sciences, 180, 3182-3191. [11] Akay, B. and Karaboga, D. (2012 ) A Modified Artificial Bee Colony Algorithm for Real-Parameter Optimization. In- formation Science, 192, 120-142. http://dx.doi.org/10.1016/j.ins.2010.07.015 [12] Karaboga, D. and Akay, B. (2011) A Modified Artificial Bee Colony (ABC) Algorithm for Constrained Optimization Problems. Applied Soft Computing, 11, 3021-3031. http://dx.doi.org/10.1016/j.asoc.2010.12.001 [13] Pan, Q.-K. , Tasgetiren, M.F., Suganthan, P.N. and Chua, T.J. (2011) A Discrete Artificial Bee Colony Algorithm for the Lot-Streaming Flow Shop Scheduling Problem. Information Sciences, 181, 2455-2468. http://dx.doi.org/10.1016/j.ins.2009.12.025 [14] Yeh, W.C. and Hsi eh, T.J. (2011) Solving Reliability Redundancy Allocation Problems Using an Artificial Bee Colony Algorithm. Computers & Operations Research, 38, 1465-1473. http://dx.doi.org/10.1016/j.cor.2010.10.028 [15] Karaboga, D. and Ozturk, C. (2009) Neural Networks Training by Artificial Bee Colony Algorithm on Pattern Classi- fication. Neural Network World, 19, 279-292. [16] Jeya Mala, D. and Mohan, V. (2009) ABC Tester—Artificial Bee Colony Based Software Test Suite Optimization Ap- proach. International Journal of Software Engineering, 15-43. [17] Zhu, G. and Kwong, S. (2010) Gbest -Guided Artificial Bee Colony Algorithm for Numerical Function Optimization. Applied Mathematics and Computation, 217, 3166-3173. http://dx.doi.org/10.1016/j.amc.2010.08.049 [18] Alatas, B. (2010) Chaotic Bee Colony Algorithms for Global Numerical Optimization. Expert Systems with Applica- tions, 37, 5682-5687. http://dx.doi.org/10.1016/j.eswa.2010.02.042 [19] Wong, L.P., Loq, M.Y.H. and Chong, C.S. (2008) A Bee Colony Optimization Algorithm for Travelling Salesman Problem. Second Asia International Conference on Modelling & Simulation, Kuala, Lumpur, 13-15 May 2008, 818- 823. [20] TSI (2012) Turkish Statistical Institute. http://www.die.gov.tr [21] MENR (2012) The Ministry of Energy and Natural Resources. http://www.enerji.gov.tr [22] Kıran, M.S., Özceylan, E., Gündüz, M. and P aksoy , T. (2012) A Novel Hybrid Approach Based on Particle Swarm Optimization and Ant Colony Algorithm to Forecast Energy Demand of Turkey. Energy Conversion and Management, 53, 75-83. http://dx.doi.org/10.1016/j.enconman.2011.08.004 [23] Ünler, A. (2008) Improvement of Energy Demand Forecasts Using Swarm Intelligence: The Case of Turkey with Pro- jections to 2025. Energy Policy, 36, 1937-1944. http://dx.doi.org/10.1016/j.enpol.2008.02.018 [24] Toksarı, M.D. (2007) Ant Colony Optimization Approach to Estimate Energy Demand of Turkey. Energy Policy, 35, 3984-3990. http://dx.doi.org/10.1016/j.enpol.2007.01.028 [25] Assareh, E., Behrang, M.A., Assari, M.R. and Ghanbarzadeh, A. (2010) Application of PSO and GA Techniques on Demand Estimation of Oil in Iran. Energy, 35, 5223-5229. http://dx.doi.org/10.1016/j.energy.2010.07.043
|