Paper Menu >>
Journal Menu >>
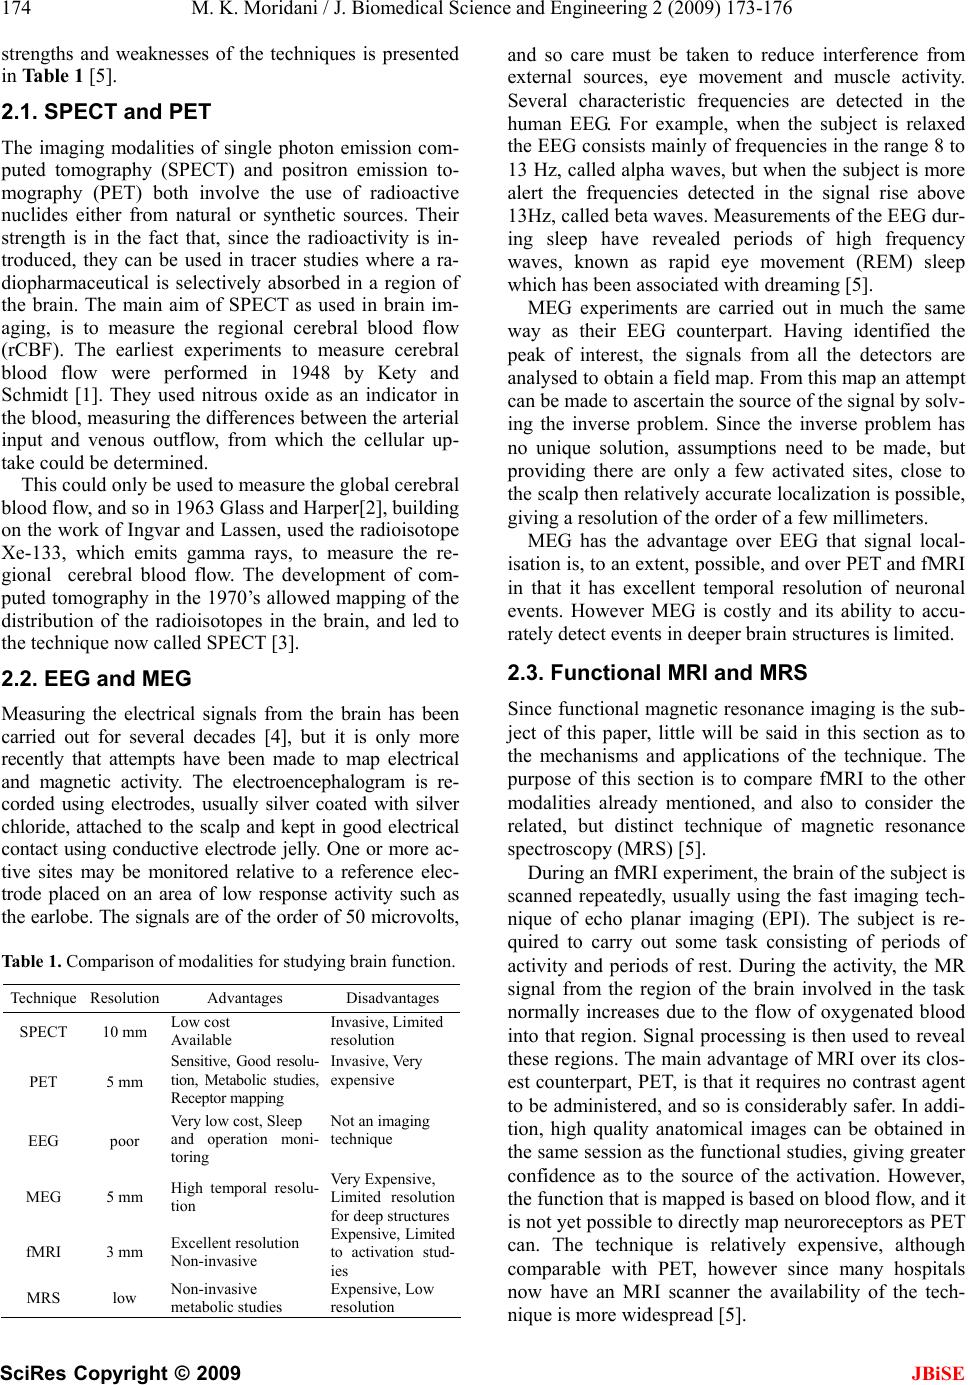
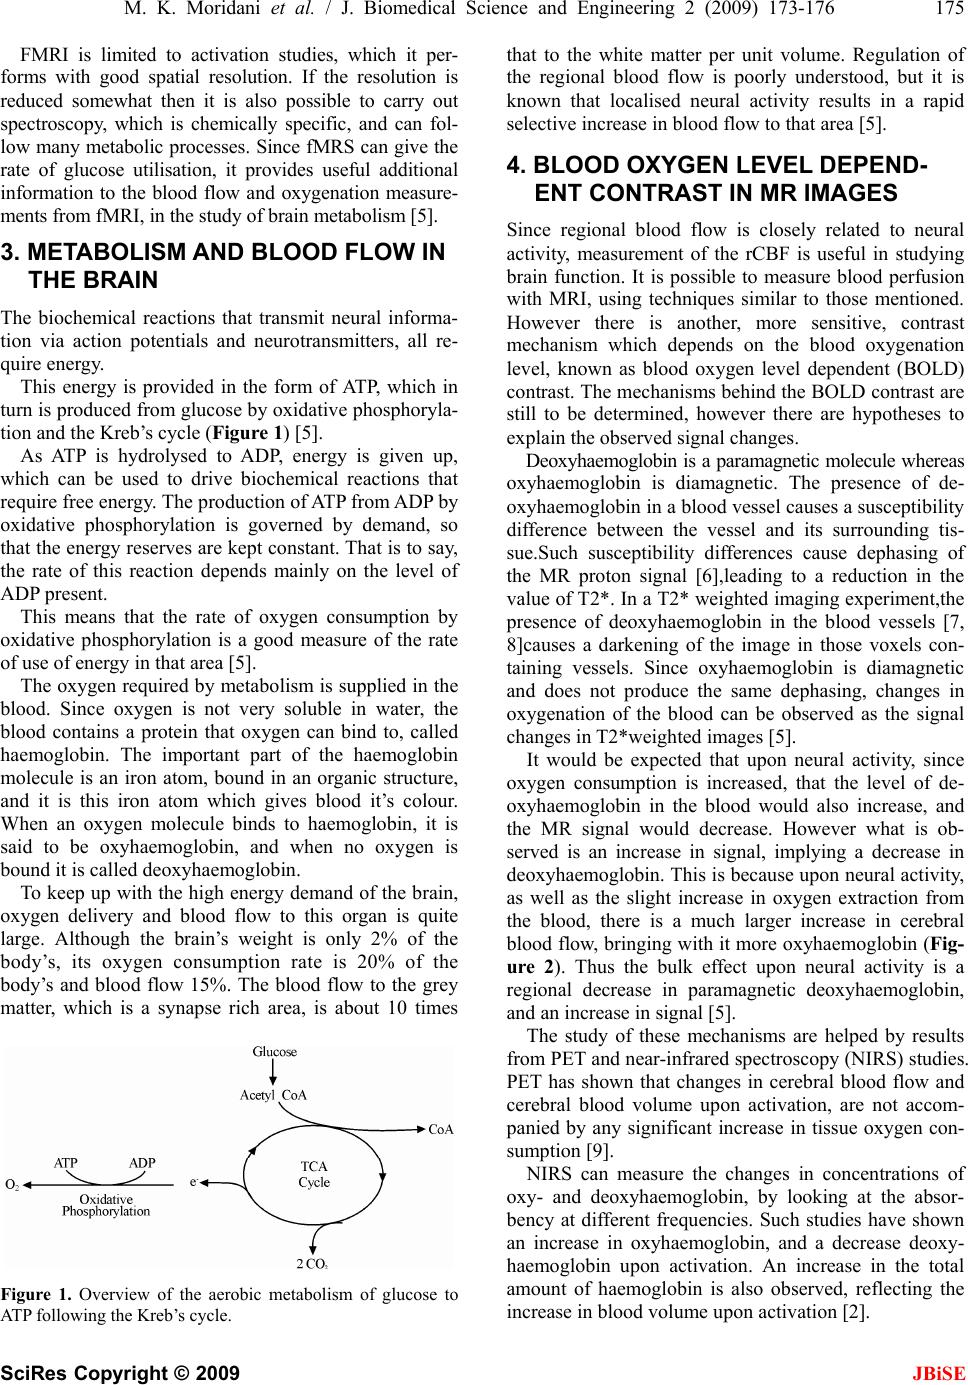
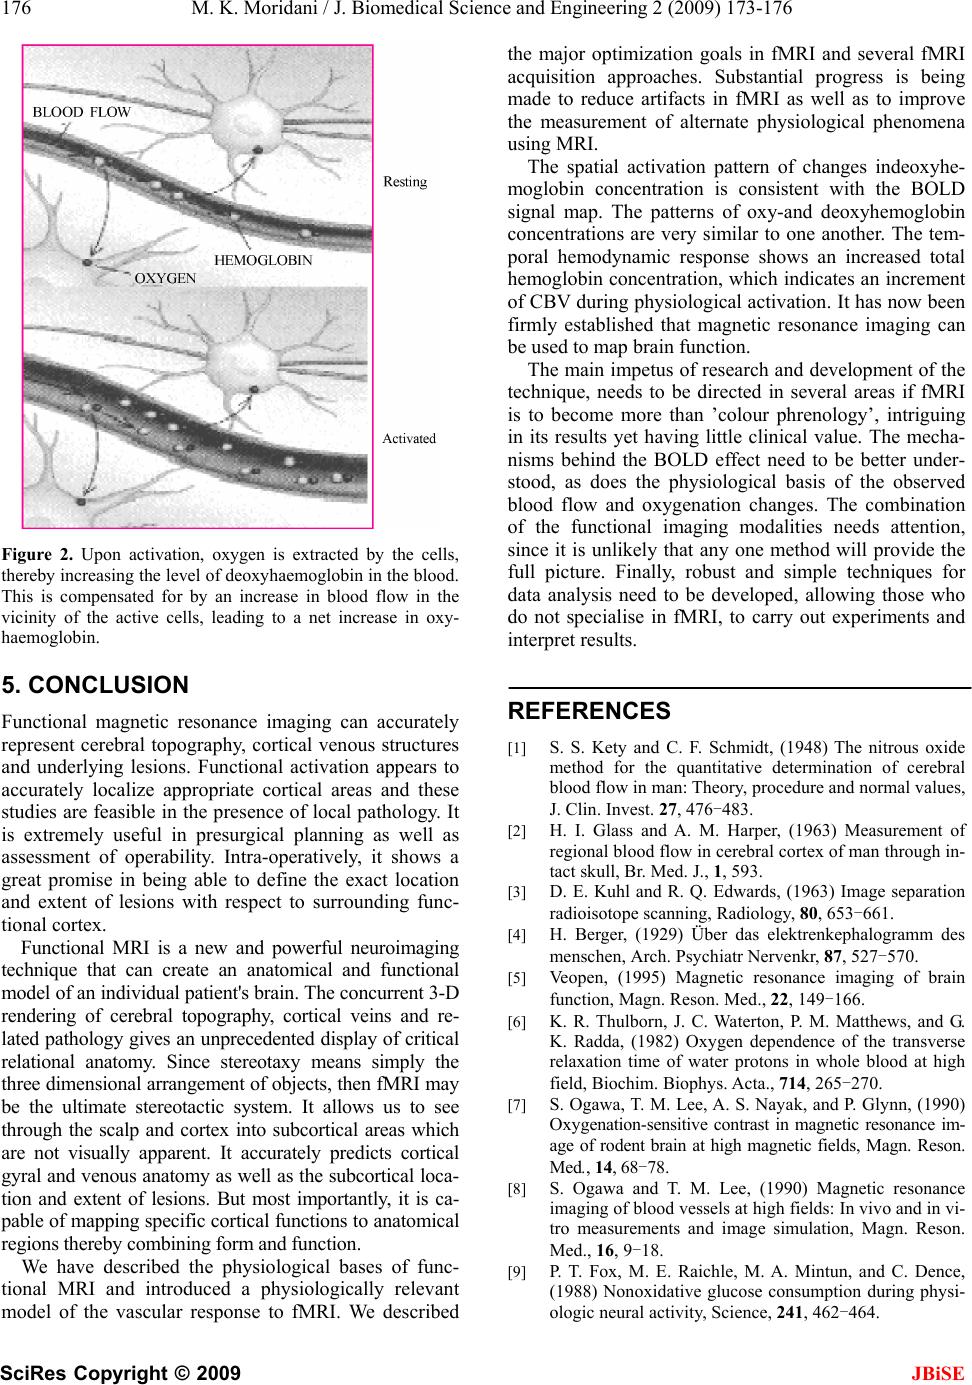
 J. Biomedical Science and Engineering, 2009, 2, 173-176 Published Online June 2009 in SciRes. http://www.scirp.org/journal/jbise JBiSE Functional brain imaging with use of a new and powerful neuroimaging technique Mohammad Karimi Moridani1 1Biomedical Engineering Department, Science and Research Branch, Islamic Azad University, Tehran, Iran. Email: Karimi.m@srbiau.ac.ir Received 19 November 2008; revised 21 March 2009; accepted 16 April 2009. ABSTRACT Most of the information available on the human brain came from subjects who had sustained major head wounds, or who suffered from various mental disorders. By determining the extent of brain damage, and the nature of the loss of function, it was possible to infer which regions of the brain were responsible for which function. With the development of the imaging techniques of computerised tomography (CT) and magnetic resonance imaging it was possi- ble to be more specific as to the location of damage in brain injured patients. The meas- urement of the electrical signals on the scalp, arising from the synchronous firing of the neu- rons in response to a stimulus, known as elec- troencephalography (EEG), opened up new possibilities in studying brain function in nor- mal subjects. However it was the advent of the functional imaging modalities of positron emis- sion tomography (PET), single photon emission computed tomography (SPECT), functional magnetic resonance imaging (fMRI), and mag- netoencephalography (MEG) that led to a new era in the study of brain function. In this paper the mechanisms of the techniques mentioned above are outlined, together with an assess- ment of their strengths and weaknesses. Then an introduction to the Metabolism and Blood Flow in the Brain is given. This is followed by a more detailed explanation of functional MRI and how such experiments are perfo rmed. Keywords: Functional Magnetic Resonance Imaging; Brain Function; EEG 1. INTRODUCTION Functional brain imaging using MRI (functional MRI or fMRI) has become a valuable tool for studying function/ structure relationships in the human brain in both normal and clinical populations. This paper describes the physiological changes associated brain with activity, including changes in blood flow, volume, and oxygena- tion. The latter of these, known as Blood Oxygenation Level Depended (BOLD) contrast, is the most common approach for functional MRI, but it is related to brain activity via a variety of complex mechanisms. Blood oxygenation level dependent functional MRI and near infrared optical tomography have been widely used to investigate hemodynamic responses to functional stimu- lation in the human brain. The temporal hemodynamic response shows an increased total hemoglobin concen- tration, which indicates an increased cerebral blood volume (CBV) during physiological activation. Blood Oxygenation Level Dependent signal indirect measure of neural activity. The signal variations induced by respira- tion and cardiac motion decrease the statistical signifi- cance in functional MRI data analysis. Physiological noise can be estimated and removed adaptively using signal projecting technique with the actual functional signal preserved. We estimate and remove the physio- logical noise from the magnitude images. This method is a fully data-driven method, which can efficiently and effectively reduce the overall signal fluctuation of func- tional MRI data. Assumes that the MRI data recorded on each trial are composed of a signal added with noise Signal (random) is present on every trial, so it remains constant through averaging and Noise randomly varies across trials, so it decreases with averaging Thus, Sig- nal-to-Noise Ratio (SNR) increases with averaging. 2. COMPARISON OF THE FUNCTIONAL BRAIN IMAGING MODALITIES The brain imaging techniques that had been presented in this paper all measure slightly different properties of the brain as it carries out cognitive tasks. Because of th is the techniques should be seen as complementary rather than competitive. All of them have the potential to reveal much about the function of the brain and they will no doubt develop in clinical usefulness as more about the underlying mechanisms of each are understood, and the hardware becomes more available. A summary of the  174 M. K. Moridani / J. Biomedical Science and Engineering 2 (2009) 173-176 SciRes Copyright © 2009 JBiSE strengths and weaknesses of the techniques is presented in Table 1 [5]. 2.1. SPECT and PET The imaging modalities of single photon emission com- puted tomography (SPECT) and positron emission to- mography (PET) both involve the use of radioactive nuclides either from natural or synthetic sources. Their strength is in the fact that, since the radioactivity is in- troduced, they can be used in tracer studies where a ra- diopharmaceutical is selectively absorbed in a region of the brain. The main aim of SPECT as used in brain im- aging, is to measure the regional cerebral blood flow (rCBF). The earliest experiments to measure cerebral blood flow were performed in 1948 by Kety and Schmidt [1]. They used nitrous oxide as an indicator in the blood, measuring the differences between the arterial input and venous outflow, from which the cellular up- take could be determined. This could only be used to m easure t he gl oba l cerebral blood flow, and so in 1963 G l as s and Harper[2], building on the work of Ingvar and Lassen, used the radioisotope Xe-133, which emits gamma rays, to measure the re- gional cerebral blood flow. The development of com- puted tomography in the 1970’s allowed mapping of the distribution of the radioisotopes in the brain, and led to the technique now called SPECT [3]. 2.2. EEG and MEG Measuring the electrical signals from the brain has been carried out for several decades [4], but it is only more recently that attempts have been made to map electrical and magnetic activity. The electroencephalogram is re- corded using electrodes, usually silver coated with silver chloride, attached to the scalp and kept in good electrical contact using conductive electrode jelly. One or more ac- tive sites may be monitored relative to a reference elec- trode placed on an area of low response activity such as the earlobe. The signals are of the order of 50 microvolts, Table 1. Comparison of modalities for studying brain function. Technique Resolution Advantages Disadvantages SPECT 10 mm Low cost Available Invasive, Limited resolution PET 5 mm Sensitive, Good resolu- tion, Metabolic studies, Receptor mapping Invasive, Ve ry expensive EEG poor Very low cost, Sleep and operation moni- toring Not an imaging technique MEG 5 mm High temporal resolu- tion Very Expensive, Limited resolution for deep structures fMRI 3 mm Excellent resolution Non-invasive Expensive, Limited to activation stud- ies MRS low Non-invasive metabolic studies Expensive, Low resolution and so care must be taken to reduce interference from external sources, eye movement and muscle activity. Several characteristic frequencies are detected in the human EEG. For example, when the subject is relaxed the EEG consists mainly of frequen cies in the range 8 to 13 Hz, called alpha waves, but when the subject is more alert the frequencies detected in the signal rise above 13Hz, called beta waves. Measurements of the EEG dur- ing sleep have revealed periods of high frequency waves, known as rapid eye movement (REM) sleep which has been associated with dreaming [5]. MEG experiments are carried out in much the same way as their EEG counterpart. Having identified the peak of interest, the signals from all the detectors are analysed to obtain a field map. From this map an attempt can be made to ascertain the source of the si gna l by s ol v- ing the inverse problem. Since the inverse problem has no unique solution, assumptions need to be made, but providing there are only a few activated sites, close to the scalp then relatively accurate localization is possible, giving a resolution of the order of a few millimeters. MEG has the advantage over EEG that signal local- isation is, to an extent, po ssible, and over PET and fMRI in that it has excellent temporal resolution of neuronal events. However MEG is costly and its ability to accu- rately detect events in deeper brain structures is li mited. 2.3. Functional MRI and MRS Since functional magnetic resonance imaging is the sub- ject of this paper, little will be said in this section as to the mechanisms and applications of the technique. The purpose of this section is to compare fMRI to the other modalities already mentioned, and also to consider the related, but distinct technique of magnetic resonance spectroscopy (MRS) [5]. During an fMRI experiment, the brain of the subject is scanned repeatedly, usually using the fast imaging tech- nique of echo planar imaging (EPI). The subject is re- quired to carry out some task consisting of periods of activity and periods of rest. During the activity, the MR signal from the region of the brain involved in the task normally increases due to the flow of oxygenated blood into that region. Signal processing is then used to reveal these regions. The main advantage of MRI over its clos- est counterpart, PET, is that it requires no contrast agent to be administered, and so is considerably safer. In addi- tion, high quality anatomical images can be obtained in the same session as the functional studies, giving greater confidence as to the source of the activation. However, the function that is mapped is ba sed on bl o od f l ow, and i t is not yet possible to directly map neuroreceptors as PET can. The technique is relatively expensive, although comparable with PET, however since many hospitals now have an MRI scanner the availability of the tech- nique is more widespread [5].  M. K. Moridani et al. / J. Biomedical Science and Engineering 2 (2009) 173-176 175 SciRes Copyright © 2009 JBiSE FMRI is limited to activation studies, which it per- forms with good spatial resolution. If the resolution is reduced somewhat then it is also possible to carry out spectroscopy, which is chemically specific, and can fol- low many metabolic processes. Since fMRS can give the rate of glucose utilisation, it provides useful additional information to the blood flow and oxygenation measure- ments from fMRI, in the st udy of brai n metabolis m [5]. 3. METABOLISM AND BLOOD FLOW IN THE BRAIN The biochemical reactions that transmit neural informa- tion via action potentials and neurotransmitters, all re- quire energy. This energy is provided in the form of ATP, which in turn is produced from glucose by oxidative phosphoryla- tion and the Kreb’s cycle (Figure 1) [5]. As ATP is hydrolysed to ADP, energy is given up, which can be used to drive biochemical reactions that require free energy. The production of ATP from ADP by oxidative phosphorylation is governed by demand, so that the energy reserves are kept constant. That is to say, the rate of this reaction depends mainly on the level of ADP present. This means that the rate of oxygen consumption by oxidative phosphorylation is a good measure of the rate of use of energy in that area [5]. The oxygen required by metab olism is supplied in the blood. Since oxygen is not very soluble in water, the blood contains a protein that oxygen can bind to, called haemoglobin. The important part of the haemoglobin molecule is an iron atom, bound in an organic structure, and it is this iron atom which gives blood it’s colour. When an oxygen molecule binds to haemoglobin, it is said to be oxyhaemoglobin, and when no oxygen is bound it is called deoxyhaemoglobin. To keep up with the high energy demand of the brain, oxygen delivery and blood flow to this organ is quite large. Although the brain’s weight is only 2% of the body’s, its oxygen consumption rate is 20% of the body’s and blood flow 15%. The blood flow to the grey matter, which is a synapse rich area, is about 10 times Figure 1. Overview of the aerobic metabolism of glucose to ATP following the Kreb’s cycle. that to the white matter per unit volume. Regulation of the regional blood flow is poorly understood, but it is known that localised neural activity results in a rapid selective increase in blood flow to that area [5]. 4. BLOOD OXYGEN LEVEL DEPEND- ENT CONTRAST IN MR IMAGES Since regional blood flow is closely related to neural activity, measurement of the rCBF is useful in studying brain function. It is possible to measure blood perfusion with MRI, using techniques similar to those mentioned. However there is another, more sensitive, contrast mechanism which depends on the blood oxygenation level, known as blood oxygen level dependent (BOLD) contrast. The mechanisms behind the BOLD contrast are still to be determined, however there are hypotheses to explain the observed signal changes. Deoxyhaemoglobin is a paramagnetic molecule whereas oxyhaemoglobin is diamagnetic. The presence of de- oxyhaemoglobin in a blood vessel causes a suscep tibility difference between the vessel and its surrounding tis- sue.Such susceptibility differences cause dephasing of the MR proton signal [6],leading to a reduction in the value of T2*. In a T2* weighted imaging experiment,the presence of deoxyhaemoglobin in the blood vessels [7, 8]causes a darkening of the image in those voxels con- taining vessels. Since oxyhaemoglobin is diamagnetic and does not produce the same dephasing, changes in oxygenation of the blood can be observed as the signal changes in T2*weighted images [5]. It would be expected that upon neural activity, since oxygen consumption is increased, that the level of de- oxyhaemoglobin in the blood would also increase, and the MR signal would decrease. However what is ob- served is an increase in signal, implying a decrease in deoxyhaemoglobin. This is because upon neural activity, as well as the slight increase in oxygen extraction from the blood, there is a much larger increase in cerebral blood flow, bringing with it more oxyhaemoglobin (Fig- ure 2). Thus the bulk effect upon neural activity is a regional decrease in paramagnetic deoxyhaemoglobin, and an increase in signal [5]. The study of these mechanisms are helped by results from PET and near-infrared spectroscopy (NIRS) studies. PET has shown that changes in cerebral blood flow and cerebral blood volume upon activation, are not accom- panied by any significant increase in tissue oxygen con- sumption [9]. NIRS can measure the changes in concentrations of oxy- and deoxyhaemoglobin, by looking at the absor- bency at different frequencies. Such studies have shown an increase in oxyhaemoglobin, and a decrease deoxy- haemoglobin upon activation. An increase in the total amount of haemoglobin is also observed, reflecting the increase in blood volume upon activation [2].  176 M. K. Moridani / J. Biomedical Science and Engineering 2 (2009) 173-176 SciRes Copyright © 2009 JBiSE Figure 2. Upon activation, oxygen is extracted by the cells, thereby increasing the level of deoxyhaemoglobin in the blood. This is compensated for by an increase in blood flow in the vicinity of the active cells, leading to a net increase in oxy- haemoglobin. 5. CONCLUSION Functional magnetic resonance imaging can accurately represent cerebral topography, cortical venous structures and underlying lesions. Functional activation appears to accurately localize appropriate cortical areas and these studies are feasible in the presence of local pathology. It is extremely useful in presurgical planning as well as assessment of operability. Intra-operatively, it shows a great promise in being able to define the exact location and extent of lesions with respect to surrounding func- tional cortex. Functional MRI is a new and powerful neuroimaging technique that can create an anatomical and functional model of an individual patient's brain. The concurrent 3-D rendering of cerebral topography, cortical veins and re- lated pathology gives an unprecedented display of critical relational anatomy. Since stereotaxy means simply the three dimensional arrangement of objects, then fMRI may be the ultimate stereotactic system. It allows us to see through the scalp and cortex into subcortical areas which are not visually apparent. It accurately predicts cortical gyral and venous anatomy as well as the subcortical loca- tion and extent of lesions. But most importantly, it is ca- pable of mapping specific cortical functions to anatomical regions thereby combining form and function. We have described the physiological bases of func- tional MRI and introduced a physiologically relevant model of the vascular response to fMRI. We described the major optimization goals in fMRI and several fMRI acquisition approaches. Substantial progress is being made to reduce artifacts in fMRI as well as to improve the measurement of alternate physiological phenomena using MRI. The spatial activation pattern of changes indeoxyhe- moglobin concentration is consistent with the BOLD signal map. The patterns of oxy-and deoxyhemoglobin concentrations are very similar to one another. The tem- poral hemodynamic response shows an increased total hemoglobin concentration, which indicates an increment of CBV during physiological activation. It has now been firmly established that magnetic resonance imaging can be used to map brain function. The main impetus of research and development of the technique, needs to be directed in several areas if fMRI is to become more than ’colour phrenology’, intriguing in its results yet having little clinical value. The mecha- nisms behind the BOLD effect need to be better under- stood, as does the physiological basis of the observed blood flow and oxygenation changes. The combination of the functional imaging modalities needs attention, since it is unlikely that any one method will provide the full picture. Finally, robust and simple techniques for data analysis need to be developed, allowing those who do not specialise in fMRI, to carry out experiments and interpret results. REFERENCES [1] S. S. Kety and C. F. Schmidt, (1948) The nitrous oxide method for the quantitative determination of cerebral blood flow in man: Theory, procedure and normal values, J. Clin. Invest. 27, 476-483. [2] H. I. Glass and A. M. Harper, (1963) Measurement of regional blood flow in cerebral cortex of man through in- tact skull, Br. Med. J., 1, 593. [3] D. E. Kuhl and R. Q. Edwards, (1963) Image separation radioisotope scanning, Radiology, 80, 653-661. [4] H. Berger, (1929) Über das elektrenkephalogramm des menschen, Arch. Psychiatr Nervenkr, 87, 527-570. [5] Veopen, (1995) Magnetic resonance imaging of brain function, Magn. Reson. Med., 22, 149-166. [6] K. R. Thulborn, J. C. Waterton, P. M. Matthews, and G. K. Radda, (1982) Oxygen dependence of the transverse relaxation time of water protons in whole blood at high field, Biochim. Biophys. Acta., 714, 265-270. [7] S. Ogawa, T. M. Lee, A. S. Nay ak, and P. Glynn, (1990) Oxygenation-sensitive contrast in magnetic resonance im- age of rodent brain at high magnetic fields, Magn. Reson. Med., 14, 68-78. [8] S. Ogawa and T. M. Lee, (1990) Magnetic resonance imaging of blood vessels at high fields: In vivo and in vi- tro measurements and image simulation, Magn. Reson. Med., 16, 9-18. [9] P. T. Fox, M. E. Raichle, M. A. Mintun, and C. Dence, (1988) Nonoxidative glucose consumption during physi- ologic neural activity, Science, 241, 462-464. |

