Effect of Scandium Doping on the Corrosion Resistance and Mechanical Behavior of 245
Al-3Mg Alloy in Neutral Chloride Solutions
2. Experimental
2.1. Fabrication of Alloys
Five Al-Mg (2.87 - 2.96 Mg) alloys were doped with
scandium (0.15 - 0.9 wt%) scandium and 0.14 wt% zir-
connium. They were made by induction melting in a re-
crystalized aluminum crucible under an argon atmos-
phere. The scandium powder was prevented by air con-
tact by covering with an aluminum foil before dipping in
the melt covered by argon. The alloy was chill cast in
copper mold. Strips of 2 mm were obtained by extrusion.
The alloy was fabricated by Light Aluminum Metalle,
Germany in consultation with the principle author. The
chemical composition of the alloy is given in Table 1.
2.2. Experimental Technique
2.2.1. Specimen Preparation
Specimens in the form of 16 mm circular discs were used
for electrochemical investigations. For recirculation loop
test, specimens measuring 70 × 100 mm, 58 × 100 mm,
48 × 100 mm and 40 × 100 mm were prepared. All
specimens were polished with 400 and 600 μm SiC paper
using de-ionized water as lubricant. Final polishing was
done with 0.05 micron aluminum powder. The specimens
were rinsed with acetone and washed with de-mineralized
water prior to commencement of experiment. Samples in
triplicates were used for experiments.
2.2.2. Weight Loss Studies
These studies were conducted in accordance with ASTM
G5-72 [13]. The samples were exposed for 1360 hours
before being re-weighed. The solution was smoothly
stirred by a magnetic stirrer. The solution was exposed to
open air.
2.3.3. Electrochemical Studies
Potentiodynamic polarization, polarization resistance and
cyclic polarization studies were conducted to determine
the corrosion behavior of the experimental alloys.
1) Potentiodynamic studies were conducted in accor-
dance with ASTM standard G5-87. A software Softcorr
III was used to obtain the polarization plots, electro-
chemical parameters and the corrosion rates [14].
2) The Polarization resistance plots were obtained by
applying a controlled potential over a small range of po-
tential ( 25 mV vs SCE) with respect to corrosion po-
tential (Ecorr). The experiments were conducted in accor-
dance with ASTM standards G 59-91 [15].
3) Cyclic polarization measurements were made in ac-
cordance with ASTM practice G61-78 [16]. The speci-
men were polarized for 2 hours at –1200 mV vs SCE.
Polarization was commenced at a scan rate of 100
mV/min and continued in a noble direction until a sharp
rise in the current occurred (Ep). At this point the scan
was reversed until the current reached a very small value
(Epp). The protection potential was determined by the
intersection of reverse anodic with forward anodic po-
larization curve.
2.2.4. Recirculating Loop Studies
A high velocity PVC loop was constructed to study the
effect of velocity. It was comprised of a centrifugal pump
(20 m3/hour), entry and exit valves, manometer, mag-
netic flow meters and different sizes of specimen holders
to create different velocities. A maximum velocity of 3.8
ms–1 was achieved in the loop.
2.3. Microstructure Examination
The surface morphology was investigated by low vacuum
scanning electron microscope (LVSEM) with and EDS
system. A Philips Tecnai F 20 S Twin TEM was used to
conduct surface texture studies. It was fitted with an
EDAX energy dispersive X-ray detector with a S-UTW
window with 30 mm2 active area. The samples were cut
by FIB. The lamella were positioned on a carbon film
and TEM examination was made.
3. Results and Discussion
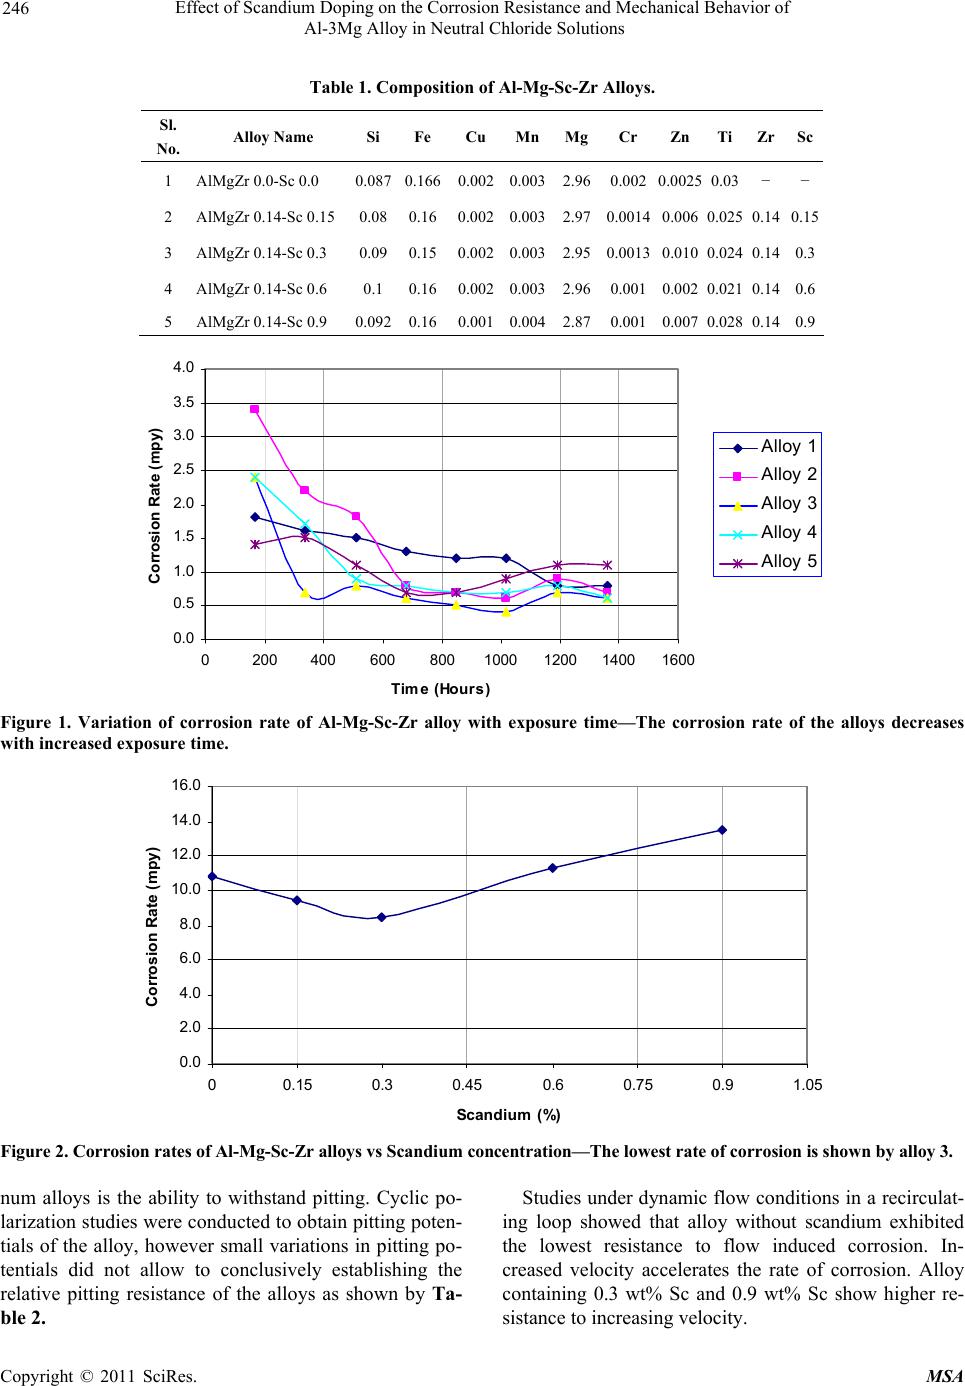
As shown by the weight loss studies (Figure 1), all ex-
perimental alloys exhibited low rates of corrosion. In
particular, alloys 3 and 4 containing (0.3 and 0.6 wt% Sc)
showed the lower corrosion rates of (0.65 mpy and 0.69
mpy) respectively at the end of 1360 hours of exposure.
The rate of corrosion tends to stabilize after 600 hours of
exposure after rapid initial fluctuations because of break-
down and repair of oxide film of Al2O3, Sc2O3. After 850
hours, a maximum rate of corrosion (0.529 mpy) was
shown by alloy 1 (0% Sc) whereas alloy containing 0.15
and 0.3 wt% Sc showed relatively low rates of corrosion
( 0.45 mpy and 0.4 mpy respectively). The corrosion
rate of alloys rises during initial exposure, but decreases
with increased period of exposure. Alloy 3 and 4 showed
lower corrosion rate.
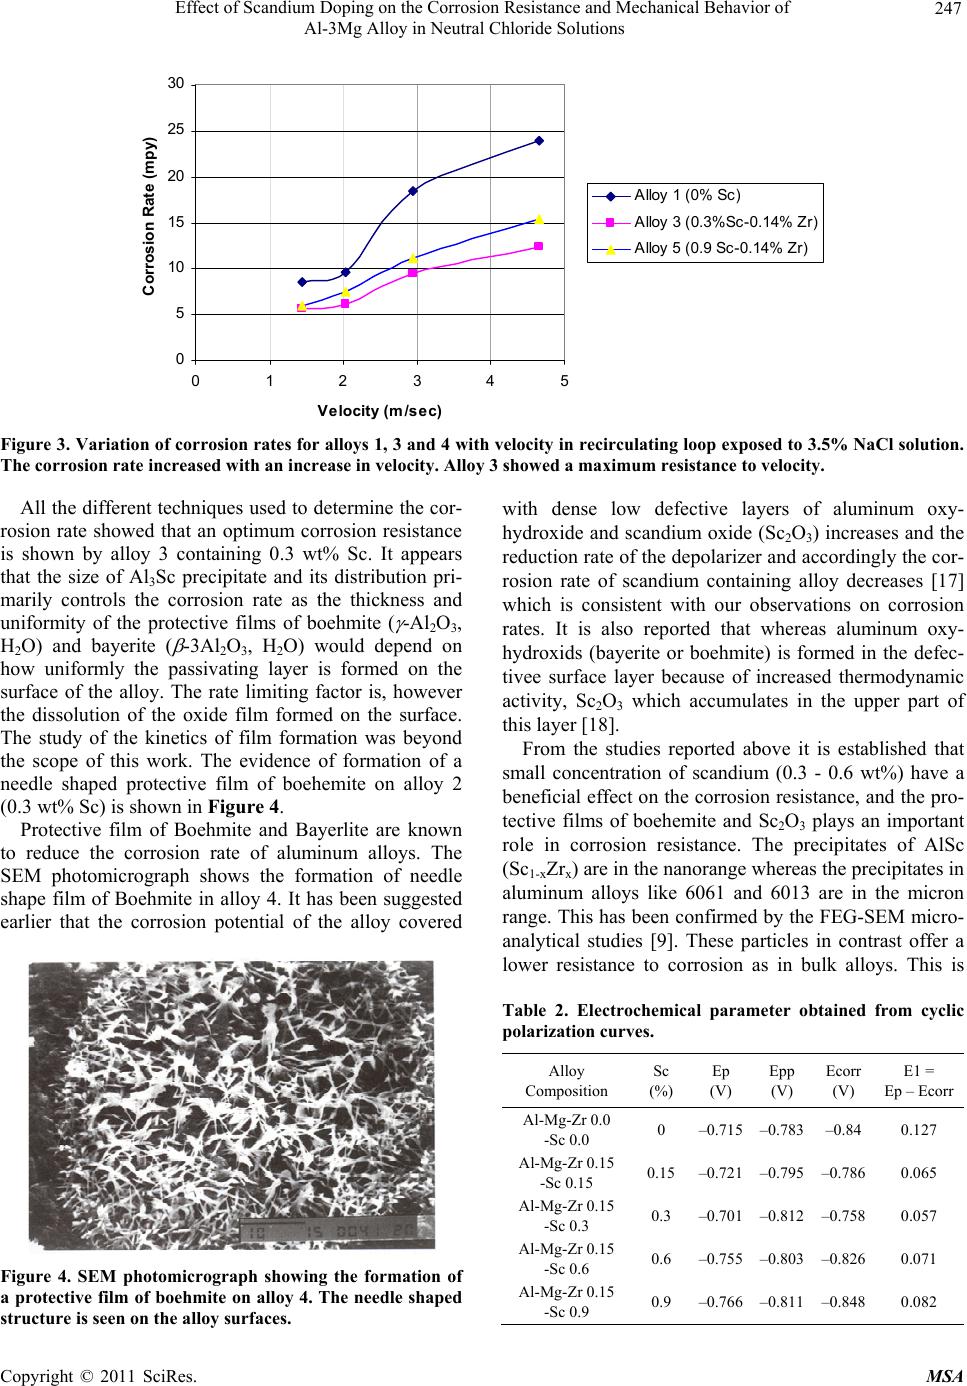
Figure 2 shows a plot of the effect of Sc concentration
on the corrosion rates of alloys in 3.5% NaCl. Corrosion
rates were determined by Polarization resistance tech-
niques. Alloy 3 containing 0.3 wt% Sc showed the mini-
mum rate of corrosion.
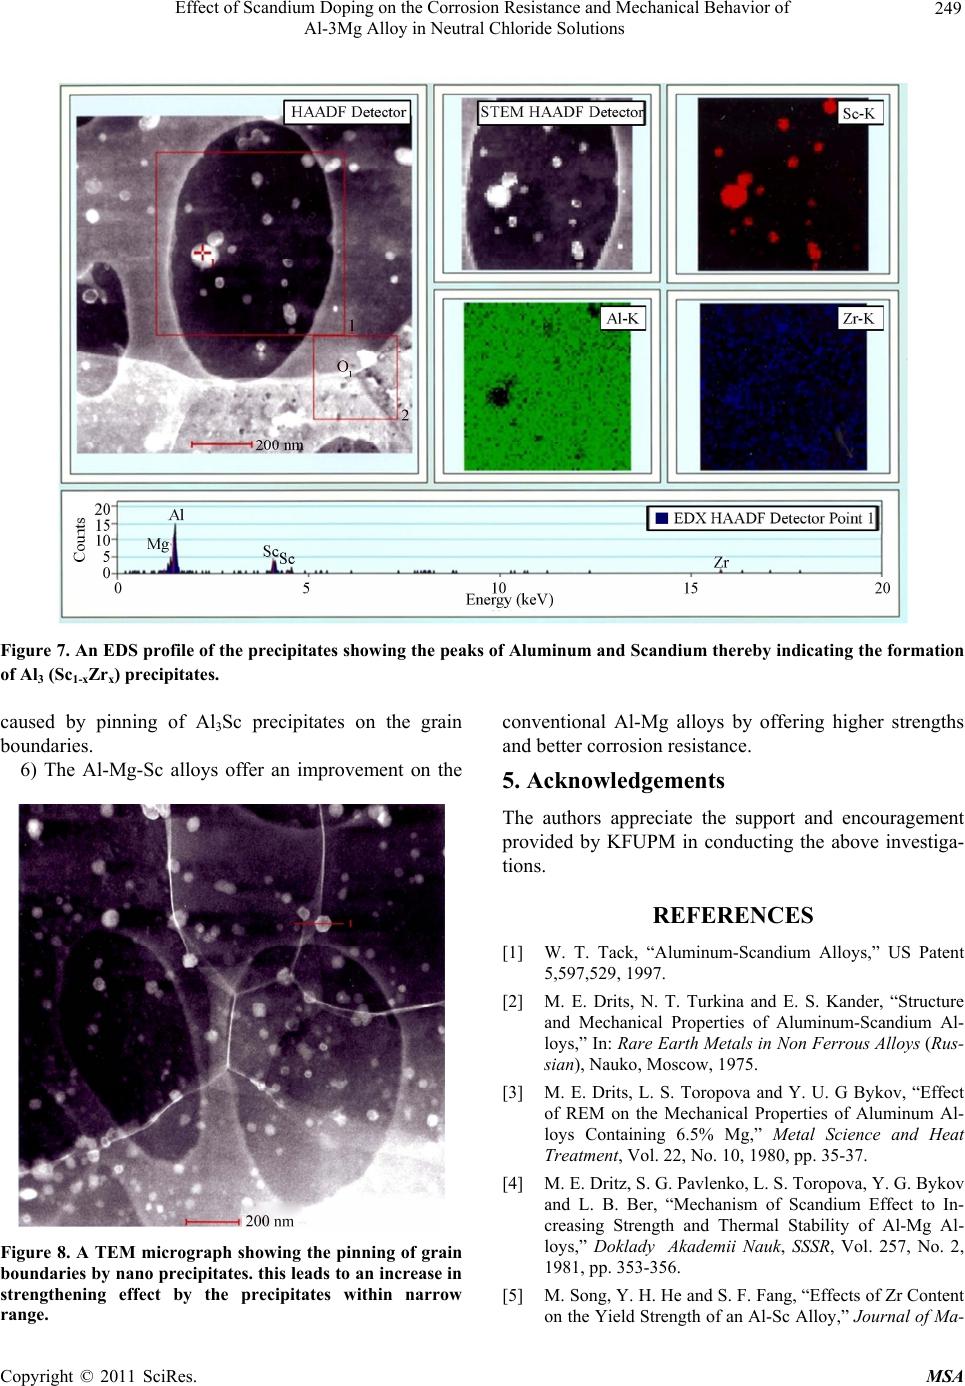
The results obtained were principally from weight loss
studies are in agreements with the potentiodynamic po-
larization resistance studies. From the studies of weight
loss studies conducted it may be concluded that alloying
addition of 0.3 and 0.6 wt% Sc exercises a beneficial
influence on the corrosion rate. As shown by Figure 3
optimum lowering of corrosion rates is shown by alloy 3
(0.3 wt% Sc), increase in addition of Sc tend to increase
the corrosion rate. One of the major concerns of alumi
C
opyright © 2011 SciRes. MSA