Paper Menu >>
Journal Menu >>
 Journal of Environmental Protection, 2011, 2, 154-161 doi:10.4236/jep.2011.22017 Published Online April 2011 (http://www.SciRP.org/journal/jep) Copyright © 2011 SciRes. JEP Puff Models for Simulation of Fugitive Hazardous Emissions in Atmosphere Ledina Lentz Pereira1, Camila Pinto da Costa2, Marco Tullio Vilhena3, Tiziano Tirabassi4 1University of the South End of Santa Catarina ( UNESC), Criciúma, Brasil; 2Federal University of Pelotas (UFPel), Pelotas, Brazil; 3Federal University of Rio Grande do Sul (UFRGS), Porto Alegre, Brazil; 4Institute of Atmospheric Sciences and Climate (ISAC), National Research Council (CNR), Bologna, Italy. Email:t.tirabassi@isac.cnr.it Received November 10th, 2010; revised December 20th, 2010; accepted February 6th, 2011. ABSTRACT A puff model for the dispersion of material from fugitive hazardous emissions is presented. For vertical diffusion the model is based on general techniques for solving time dependent advection-diffusion equation: the ADMM (Advection Diffusion Multilayer Method) and GILTT (Generalized Integral Laplace Transform Technique) techniques. Both ap- proaches accept wind and eddy diffusion coefficients with any restriction in their height functions. Comparisons be- tween values predicted by the models against experimental ground-level concentrations (from Copenhagen data set) are shown. The preliminary results confirm the applicability of the approaches proposed and are promising for future work. Keywords: Hazardous Emissions, Advection-Diffusion Equation, Analytical Solutions, Air Pollution Modeling, Puff Models 1. Introduction The study on hazardous material dispersion shows that the diffusion in the atmosphere depends strongly on the meteorological scenario and boundary layer evolution. Traditionally, the advection-diffusion equation has been largely applied in operational atmospheric dispersion models to predict the mean concentration of contami- nants in the Atmospheric Boundary Layer (ABL). In principle, from this equation it is possible to obtain a theoretical model of dispersion from a point source given appropriate boundary and initial conditions plus knowl- edge of the mean wind velocity and turbulent fluxes. Much of the turbulent researches are related to the specification of turbulent fluxes in order to allow the solution of the averaged advection-diffusion equation: this procedure, sometimes, is called as the closure of the turbulent diffusion problem. The main scheme for clos- ing the equation has to take into account the relationship between concentration turbulent fluxes and the gradients of the mean concentration by exchange coefficients. A broad class of numerical solutions to the advec- tion-diffusion equation can be encountered in the litera- ture. Nevertheless, the search of analytical solutions for this equation has several advantages. Indeed, in the ana- lytical solution all the influencing parameters are explic- itly expressed in a mathematical closed form and cones- quently sensitivity analysis over model parameters may be easily performed and, more important in order to manage alarms for fugitive hazardous emissions, air pol- lution model based on analytical formula run fast. In fact, in order to model fugitive emissions, fast evaluation and relative decisions are necessary. So, fast codes are preferred and is better if they run in personal computer and can evaluate air pollution concentrations although some meteorological measures are present. Moreover, in the case of fugitive hazardous emissions, time dependent models are necessary. Puff models are a practical approach to describe the dispersion from a time-dependent emission point source in an inhomogeneous and non-stationary ABL. Most of the operative puff models are based on the Gaussian ap- proach (the shape of the puffs is Gaussian). Gaussian models are theoretically based upon an exact, but not realistic solution of the equation of transport and diffu- sion in the atmosphere, in cases where both wind and turbulent diffusion coefficients are constant with height. The solution is forced to represent real situations by means of empirical parameters, referred to as “sigma”. The input parameters of the Gaussian plume model are  Puff Models for Simulation of Fugitive Hazardous Emissions in Atmosphere155 often related to simple turbulence typing schemes or sta- bility classes. The problem with such stability classes is that each covers a broad range of stability conditions; they are also very site specific and based towards neutral stability when unstable or convective conditions actually exist. Moreover, the shapes of puffs are not symmetric in vertical, while the Gaussian distribution is symmetric. In fact, a distorting effect of the variation with height of the mean wind, both in speed and direction, is often evident in the development of puffs or plumes smoke. The effect is most evident in stably stratified conditions. In fact wind shear creates variance in the direction of the wind, vertical diffusion destroys this variance and tries to re-establish a non skewed distribution. The interaction between vertical mixing and velocity shear is continu- ously effective. Conversely, Gaussian models are fast, simple, do not require complex meteorological input. For these reasons they are still widely employed for regulatory applications by environmental agencies all over the world. Nonethe- less, because of their well known intrinsic limits, the re- liability of a Gaussian model strongly depends on the way the dispersion parameters are determined on the basis of the turbulence structure of the ABL and the model’s ability to reproduce experimental diffusion data. However, non-Gaussian puffs have been proposed in the literature [1-4]. In this paper we present two puff models where hori- zontal dispersion is Gaussian, but the vertical puff shape is non-Gaussian and it is evaluated by two different tech- niques that allow to obtain an analytical solution of the one-dimensional advection-diffusion equation: the GILTT (Generalized Integral Laplace Transform Technique) [5,6] and ADMM (Advection Diffusion Multilayer Method) [7,8] techniques. The first one is a well-known hybrid method that had solved a wide class of direct and inverse problems main- ly in the area of Heat Transfer and Fluid Mechanics and the solution is given in series form. The second one is an analytical solution based on a discretization of the Atmospheric Boundary Layer (ABL) in sub-layers where the advection-diffusion equation is solved by the Laplace transform technique. The solution is given in integral form. The models accept general profiles for eddy diffusivity coefficients, as well as the theoretical profiles proposed in the scientific literature, such as the vertical profiles of eddy diffusion coefficients predicted by the Similarity Theory. 2. Puff Models Puff models were introduced to simulate the behaviour of pollutants in inhomogeneous and non-stationary mete- orological and emission conditions [9,10]. The emission is discretized in a temporal succession of puffs, each of which shifts into the area of calculus thanks to wind field. Puff models assume that each emission of pollutants in a time interval t releases into the atmosphere a mass of pollutants M Qt, where Q is the emission rate, which is variable in time. Each puff contains the mass M and its centre of mass is transported by the wind, which may vary in space and time. Continuously emit- ting sources can be represented by the superposition of a series of the above clouds. The puffs considered here are emitted in time intervals 1 t and the calculation of the concentration of pollutants of each one is made in a time intervals 2. Each puff is carried in accordance with the trajectory from its centre, which is determined for velocity vector of the local wind, while it is enlarged in the time by means of the disper- sion coefficients. In particular, in our model, the vertical diffusion of the material carried in accordance with the trajectory of puff is non-Gaussian and it is described by general solutions of the following equation: t ,,czt czt K z tz z S (1) for 0 zh and the time , subject to the bound- ary condition 0t 0 for 0; z c K z z h 0 (2) and the initial condition: . Here, 0cz, Cz,t denotes the average crosswind integrated concentration, h the ABL height, z K the eddy diffusivity coefficient, the instantaneous point source expressed like: S 0 s SQtt zH (3) In addition, represents the delta function, z is the vertical variable, t0 initial time, s H the source height. In the sequel we solve problem (1) by the GILTT and ADMM approach. The main idea of the GILTT approach consist in the expansion of the pollutant concentration in a truncated series of eigenfunctions. Replacing this expansion in the advection diffusion equation and taking moments, we come out with a first order linear matrix equation, which is then solved by the Laplace Transform technique. This procedure leads to a solution expressed in series formula- tion for more details see the work [6]. The main idea of the ADMM approach relies on the discretization of the PBL in a multilayer system, where in each layer the eddy diffusivity and wind profile as- sume averaged values. The resulting advection-diffusion equation in each layer is then solved by the Laplace Copyright © 2011 SciRes. JEP  Puff Models for Simulation of Fugitive Hazardous Emissions in Atmosphere 156 Transform technique. For more details about this meth- odology see the work [11]. To construct a three-dimensional solution, we assume the Gaussian model in x and y directions for the pollutant concentration, therefore Gaussian solution reads like: 2 0 2 0 ,, 11 exp 22 1 exp 2 puff yx x y xyt xx yy (4) where 0 x ut, 0 and 0 yvt x , 0 are the cen- troid coordinates (u and v are the components of hori- zontal velocity of the average wind) and x , y the lateral dispersion parameters [12] defined as: y a utf tT (5) where means x and y, f is the non-dimensional function of the travel time tT : 1 12 ftT (6) where T is the Lagrangean scale of time for the hori- zontal (x and y) dispersion and u is the standard de- viation of the longitudinal and lateral components of the wind speed defined as: 23 2035 2 a S u* s H u. hH kL , (7) where * is friction velocity, k is the Von Kárman con- stant (k = 0.4), h is the height of the ABL and L is the Monin-Obukhov length. u 2.1. The Solution of the One-Dimensional Transient Problem by the GILTT Method In order to solve the Equation (1), we rewritten like: 2 0 2 S ccc K 'zKzQt tzH tz z (8) According the works [6] the solution of problem (1) is written like: 12 0 ii / ii A tZ z cz,t N (9) where cos ii Z zz and π iih are respect- tively the eigenfunctions and eigenvalues, and i A t is the solution of the transformed problem, and is i N expressed by . d2 ii v NZzv Replacing the Equation (9) in Equation (8) and taking moments. Thus, after we get the following first order linear matrix equation 0 EY'tBYtQttF (10) For t > 0, with E, Y, B and F defined as: 0 with d a ij ijij 12 12 ij ZzZz Ee ez, (11) NN j YtAt, (12) where , 12 is ij i i ZH Ff f N (13) and the B matrix is expressed by: , with ij Bb 12 12 2 00 1 dd ij ij aa ' ijjij bNN k'zZ zZzzkzZ zZzz (14) For the initial condition, the procedure is analogous and after the substitutions due and integrations we have: 00 j A (15) In this work the transformed problem represented by Equation (10) is solved by the Laplace Transform tech- nique and diagonalization [13]. Thus, the final solution is given by aD YtTGt (16) where is the integration constant vector, D Gt 0 tT is the diagonal matrix witch elements are , a is the eigenfunction matrix and are the eigenvalues of the matrix B. i dt e i d The state-of-art the GILTT method can be found in [14]. 2.2. The Solution of the One-Dimensional Problem Transient by the ADMM Method To solve the advection-diffusion Equation (1), for inho- mogeneous turbulence by the ADMM method, we must take into account the dependence on the eddy diffusivi- ties, on the height variable (variable z). To reach this goal we discretize the height h of the ABL into N sub-inter- vals in such manner that inside each sub-region K z assume respectively the following average values: 1 1 1d n n z nz nn z K Kzz zz (17) Copyright © 2011 SciRes. JEP  Puff Models for Simulation of Fugitive Hazardous Emissions in Atmosphere157 Obviously, the greater the number o more accurate the concentration patter though the relative code running time is consequently gr f layers (N), the n calculated, al- eater. Moreover, the layers in which the ABL is di- vided can be not constant in thickness. A more detailed description is required of wind and diffusion coefficients in proximity to the ground, where their gradients are high and more strongly influence pollutant dispersion. There- fore layers close to the terrestrial surface can be assigned a smaller thickness than those located higher up. With the division of the domain into N sub-intervals, the solu- tion of the Equation (1) is reduced to the solution of N problems of this type: 2 0 2()() nn n cc K QzHs tt tz (18) for , where, represents the concen- trationeric subayer. The boun initial conditions are given by: 1 1n,,N n in the nth ge n c -ldary and 0, for 0, n n c K zh z (19) and e equations represented by the Equation (18) are the continuity conditions and flux at the interfaces. Namely: ,0, for 0 n czt t (20) Th joined by for the concentration 1 1, 2,,1, nn ccn N (21) 1 nn cc 11, 2,,1 nn K Kn N. zz (22) We apply the Laplace Transform technique in time variable in Equation (18). We determine the solut the resulting equation, in a easy manner, using the well kn ion of ow results of second order linear differential equations with constant coefficients. Indeed, it turns out that by this procedure, the pollutant concentration in each sub-layer reads like: 2nn RK fo , whereas s denotes the Lap formed variable. We are now in position to construct t global solution for the puff emission. For such, ac- cord- the Green fun 00 nn nn Rz Rz nnn RzHtsRzH ts cz,s AeBe Qee. (23) r 1, , 1nNlace trans- he ing ction theory for particular solution, we write down the solution for a single puff like: 00 1 ,22 nn iRzRz nnn i nn Q cztAe Be iRK d nS nS Rz H tsRzH tsst s ee HzHes (24) for 1, , 1nN , where n nz RsK, s H is the heig (located in that mu is valid oan ht of the source Heaviside function only in the sub-layer that c 1, , 1 0x ltiplies the part ntains the source, ) and H is the that An d Bn (nN ) are the integration costnanhey are determinate by solving the linear system resulting from the application of the boundary and interfaces conditions. More details on the ADMM approach can be found on [8] and [11]. Finally, we would like to point out that since we suc- ceed in the task of searching solution for the puff prob- lem (1), we are confident to affirm that we pave the road ts, t to mitigate the previous Gaussian assumptions in the x and y directions, working out the three-dimensional ad- vection-diffusion equation with puff source by the ADMM approach. Once the solution for single puff is know, we claim that the puff solution reads like the summation of the contribution of all puffs emitted by the source. This pro- cedure leads to the solution: 0 0 1 d puff p n P pn t p cz,t M cz,tHtt t (25) for p = 1:P, where P is the total number of puffs emitted, is the mass carried out for the pth puff and p M p uff n c obtain the is th search e one-dimensional puff solution. To ed three-dimensional solution, we make the as- hree- sumption that the solution in the x and y directions are described by Gaussian solution. Henceforth, the t dimensional puff solution, assuming point source at 0 xy , has the form: ,,,,, , puff puffn puff cxyztcxyt (26) noticing that the function p uff is given by Equation (4). Here ,,, ff xyzt is the searched puff solution. Fur- pu C 0 ther, x and 0 y essed in terms of are the puff centroid coordi pr nates ex- x ancompond y wind ent as: , x ut (27) , y vt (28) where u and v are respective the wind components in the x and y directions. Here t is the time interval of the puff emission. In addition, we are the standard deviation for x set. must recall that x and y and y directions [12]. 3. Experimental Data and Vertical Turbulence Parameterization The performances of the present models were evaluated against experimental data of Copenhagen [12,15] data Copyright © 2011 SciRes. JEP  Puff Models for Simulation of Fugitive Hazardous Emissions in Atmosphere 158 Table 2. Theniu fee In the Copenhagen experiment the tracer SF6 was released wit of 115 m, and f thout buoyancy from a tower at a heigh collected at the ground-level positions at a maximum of three crosswind arcs of tracer sampling units. The sam- pling units were positioned, at the ground level, 2-6 km from the point of release. The site was mainly residential with a roughness length of 0.6 m. The meteorological conditions during the dispersion experiments ranged from moderately unstable to convective. We used the values of the crosswind-integrated concentrations nor- malized with the tracer release rate from [12]. Generally, the distributed data set contains hourly mean values of concentrations and meteorological data. However, in this model validation, we used data with a greater time reso- lution kindly made available by Gryning and described in [3]. In particular, we used 20 minutes averaged measured concentrations and 10 minutes averaged values for mete- orological data Tables 1, 2 and 3 report the friction ve- locity, the Monin-Obukhov length and boundary layer height (only one value for each run), respectively, used in the simulations. The puffs considered here are emitted in time intervals t1 = 120 s. and the calculation of the concentration of pollutants is made with a time resolution t2 = 30 s. In order to evaluate the performance of the puff mod- els against experimental ground-level concentration. we have to introduce a boundary layer parameterization. The K theory assumes that concentration turbulent luxes are proportional to the mean concentration gradi- ent. The reliability of the K-approach strongly depends on the way the eddy diffusivity is determined on the ba- sis of the turbulence structure of the ABL, and on the model’s ability to reproduce experimental diffusion data. Table 1. The friction velocity (m/s) for the time tnt for n = 1:12 and t=10 minutes. Run n 1 2 3 4 5 7 8 9 1 0.36 0.68 0.46 0.56 0.58 0.48 0.65 0.72 2 0.37 0.67 0. 0.51 0.52 0.4548 0.79 0.73 0.40 0.81 0.47 0.37 0.51 0.57 0.67 0.60 0. 0 0 00. 0 00. 12 0.36 0.66 0.40 0.39 0.43 0.62 0.69 0.74 3 4 43.68.39.4458.62.6759 5 0.35 0.75 0.39 0.48 0.59 0.53 0.68 0.65 6 0.34 0.74 0.40 0.48 0.52 0.65 0.65 0.71 7 0.42 0.76 0.40 0.39 0.52 0.63 0.68 0.73 8 0.43 0.82 0.41 0.40 0.45 0.65 0.67 0.73 9 0.40 0.76 0.31 0.39 0.44 0.66 0.73 0.73 10 0.37 0.73 0.34 0.39 0.44 0.62 0.73 0.66 11 0.35 0.69 0.39 0.39 0.44 0.52 0.75 0.67 Mon-Obkhov length(m) or th tim tnt for n12 = 1: andt=10 minu n N tes. Ru 1 2 3 4 5 7 8 9 1 –26–––492 –71 ––178152–75 71793 2 –23–227–194–42 –215 –80 –85–471 –83 –311–106368 –64 3 –23 ––47–202 ––160–101–32 –735 – ––366 – 4 4211149 5 –36–203–129–71 –366 –177 –45–633 6 –42–286–70–80 –273 –67 –6313588 7 –47–155–83–83 –273 –87 –41–593 8 –38–228–60–101 –262 –71 –47–471 9 –83–184–106–129 –395 –56 –70–389 10 –21–389–42–129 –395 –111 –64–375 11 –32–133–101–129 –395 –215 –52–262 12 –29–375–70–129 –759 –123 –39–252 Tau r the (hourly data). R ble 3. Bondary layeheigh for te nin experiments un 1 2 3 4 5 7 89 h 198019201120390 820 1850 8102090 We are aware of the great variety of parameterization of the eddy-diffusivity coefficient inherent to the K-model [10]. Most of m ba onmilty try,d gidit resul tmmrta, s well as discontinuities and jumps at the transition be- the aresed siariheo an ve fferents forhe sae atosphe ic sbility a tween different stability regimes of the ABL. However, in this work, we select two formulations for the eddy diffusivity coefficient for the vertical dispersion. The first one is discussed by Pleim and Chang [16] and written as: z * Kz kwz1h (29) The second one, is the eddy diffusivity suggested by Degrazia et al. [17] which reads like: 0.55 , 4 w * mw σz Kz f (30) where the vertical speed variance w is defined as: 23 23 22 23 106 ww * mw z .c f * w h (31) where 036 w c., * w is the convective velocity scale, * mw f is the non-dimensional frequency of the vertical d by following form: spectral peak expresse Copyright © 2011 SciRes. JEP 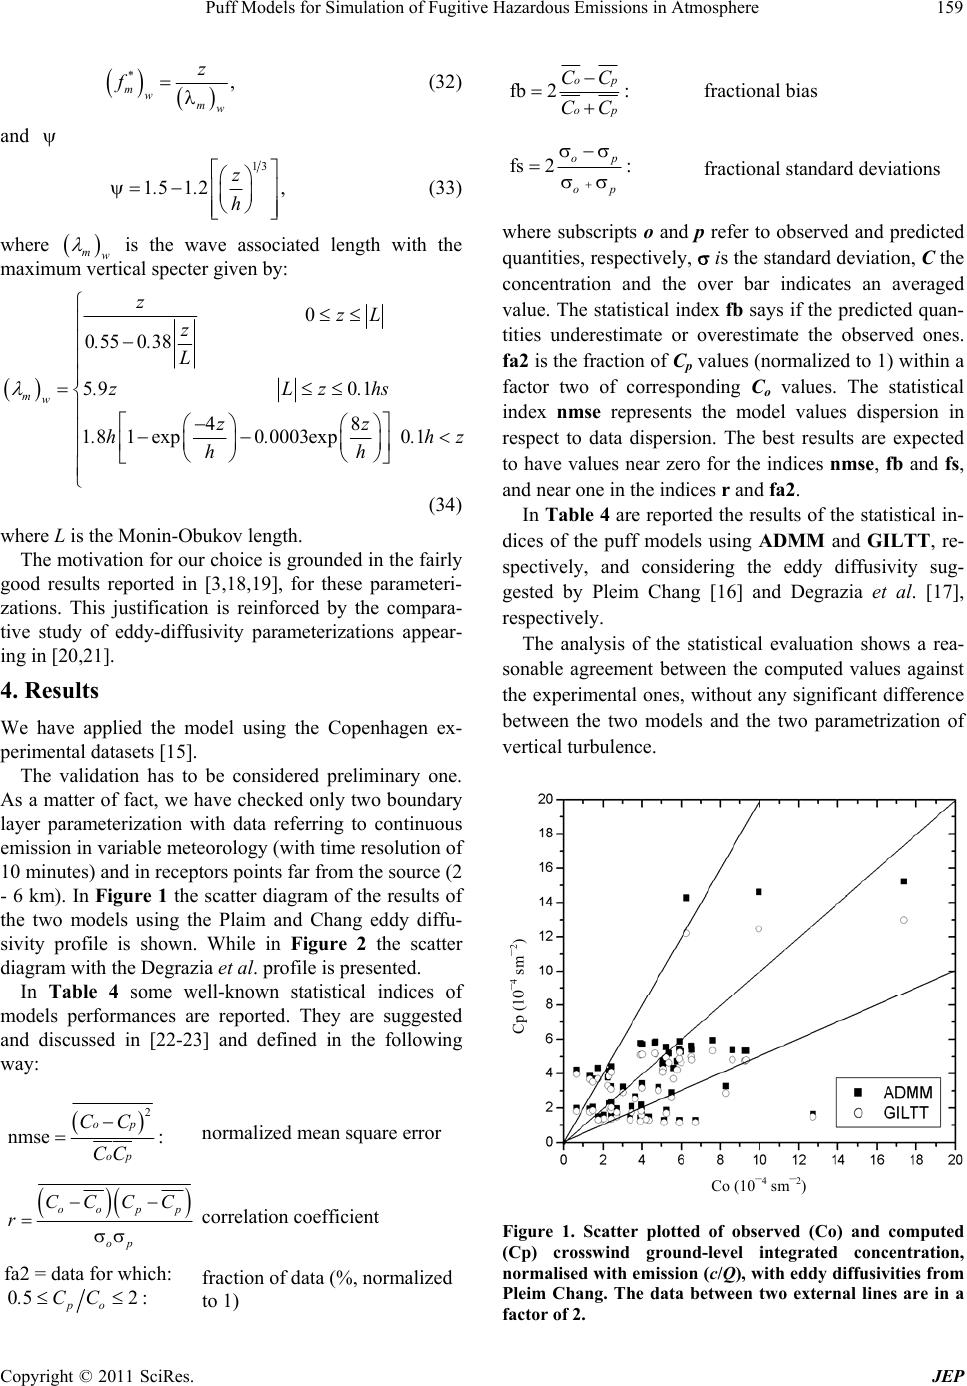 Puff Models for Simulation of Fugitive Hazardous Emissions in Atmosphere159 , * mwmw z f (32) and 13 15 12, z .. h (33) where is the wave maximcal specter given by: mw um verti associated length with the 0 055 038 5 9 0 1 48 1 81exp0 000 mw zz .h . 3exp0 1 zzL z .. L .z L z.hs .hz hh (34) where L is the Monin-Obukov length. The motivation for our choice is grounded in the fairly good results reported in [3,18,19], for these parameteri- zations. This justification is reinforced by the compara- tive study of eddy-diffusivity parameterizations appear- ing in [20,21]. n with data referring to continuous riable meteorology (with time resolution of 4. Results We have applied the model using the Copenhagen ex- perimental datasets [15]. The validation has to be considered preliminary one. As a matter of fact, we have checked only two boundary layer parameterizatio emission in va 10 minutes) and in receptors points far from the source (2 - 6 km). In Figure 1 the scatter diagram of the results of the two models using the Plaim and Chang eddy diffu- sivity profile is shown. While in Figure 2 the scatter diagram with the Degrazia et al. profile is presented. In Table 4 some well-known statistical indices of models performances are reported. They are suggested and discussed in [22-23] and defined in the following way: 2 nmse opCC : normalized mean square erro op CC r oo pp CCCC r correlation coefficient fraction of data (%, normalized to 1) fb 2 op op CC CC : fractional bias fs 2 op op : fractional standard deviations p quantities, respectiv concentration and the oan averaged value. The statistical index e predicted quan- tities underestate or observed ones. fa2 is the fraction of Cp values (normalized to 1) within a factor two of correspondi C index nmse reesents n respect to data dispersion. The best results are expected parametrization of ve Figure 1. Scatter plotted of observed (Co) and computed (Cp) crosswind ground-level integrated concentration, normalised with emission (c/Q), with eddy diffusivities from Pleim Chang. The data between two external lines are in a fact or of 2. where subscripts o and ely, refer to observed and predicted is the standard deviation, C the ver bar indicates fb says if th overestimate theim ng o values. The statistical the model values dispersion ipr op fa2 = data for which: 05 2 po .CC: to have values near zero for the indices nmse, fb and fs, and near one in the indices r and fa2. In Ta ble 4 are reported the results of the statistical in- dices of the puff models using ADMM and GILTT, re- spectively, and considering the eddy diffusivity sug- gested by Pleim Chang [16] and Degrazia et al. [17], respectively. The analysis of the statistical evaluation shows a rea- sonable agreement between the computed values against the experimental ones, without any significant difference between the two models and the two rtical turbulence. Cp (10–4 sm–2) Co (10–4 sm–2) Copyright © 2011 SciRes. JEP  Puff Models for Simulation of Fugitive Hazardous Emissions in Atmosphere 160 Figure 2. Scatter plotted of observed (Co) and computed (Cp) crosswind ground-level integrated concentration, nor- malised with emission (c/Q), with eddy diffusivities from Degrazia. The data between two external lines are in a fac- tor of 2. Table 4. Statistical evaluation of model results. Model Edyy diffusivity nmse r fa2 fb fs ADMM Eq. (41) 0.42 0.58 0.72 0.16 0.01 ADMM G G Eq. (42) 0.40 0.58 0.75 0.14 0.02 ILTT Eq. (41) 0.48 0.57 0.70 0.28 0.16 ILTT Eq. (42) 0.48 0.57 0.72 0.29 0.17 5. Conclusions We presented a puff model where the vertical concentra tion distribution is not Gaussian but is describe by new solutions of the advection-diffusion equation that accept eddy diffusion co any restriction in the well-known Copenhagen data set, but with greater time resolution respect to the original one. Anon of well-known statistical indices show that both ap- pr cp aodfoe ground level concenare not significant dif- fbete tos w dy erizs hri- mental data. elimsulnfelicabilityhe app prond prsing fr rerk: n offityeri nd using the ADMM and GILTT solutions in the lat- - two efficient with their height function. As preliminary evaluation of the model performances, the results predicted by the puff model, using two differ- ent turbulence parameterizations where compared with data from a alysis of the results obtained and the applicati oachesonsidered tration data. There roduce go fit r th erences ween thwo slution and the to eddy iffusivitparametationin te range of expe The prinary rets coirm th app of t roach valuatio posed a f other ed are dy di omi usiv o para futu met wo zations e a eral dispersion also. 6. Acknowledgements The authors are gratefully indebted to CNPq, FAPERGS, CNR and ENVIREN for the partial financial support of this work. Cp (14 s) 0–m–2 REFERENCES [1] R. Lupini and T. Tirabassi, “Solution of the Advection- Diffusion Equation by the Moments Method,” Atmos- pheric Environment, Vol. 17, No. 5, 1983, pp. 965-971. doi:10.1016/0004-6981(83)90248-2 [2] T. Tirabassi and U. Rizza, “A Practical Model for the Dispersion of Skewed Puffs,” Journal of Applied Meteor- ology, Vol. 34. No. 4, 1995, pp. 989-99. doi:10.1175/1520-0450(1995)034<0989:APMFTD>2.0.C O;2 [3] T. Tirabassi and U. Rizza, “Boundary Layer Parameteri- zation fo Co (10–4 sm–2) r a Non-Gaussian Puff Model,” Journal of Applied Meteorology, Vol. 36, No. 8, 1997a, pp. 1031-1037. doi:10.1175/1520-0450(1997)036<1031:BLPFAN>2.0.C O;2 [4] T. Tirabassi and U. Rizza, “A Non-Gaussian Puff Model,” Nuovo Cimento, Vol. 20C, 1997b, pp. 453-460. ilhena, D. D. Moreira and D. 1016/j.atmosenv.2005.01.003 [5] S. Wortmann, M. T. M. V Buske, “A New Analytical Approach to Simulate the Pollutant in the PBL,” Atmospheric Environment, Vol. 39, No. 34, 2005, pp. 2171-2178. doi:10. [6] D. M. Moreira, M. T. Vilhena, D. Buske and T. Tirabassi, “The GILTT on-Diffusion Equa tion for an Inhoy PBL,” At- Solution of the Advecti mogeneous and Nonstationar mospheric Environment, Vol. 40, No. 17, 2006, pp. 3186- 3194. doi:10.1016/j.atmosenv.2006.01.035 [7] M. T. Vilhena, U. Rizza, G, Degrazia, C. Mangia, D. M Moreira and T. Tirabassi, “An Ana . lytical Air Pollution . Tirabassi, C. P in the Atmosphere by the Laplace Transform: The Model: Development and Rvalution,” Contribution At- mospheric Physics, Vol. 71, 1998, pp. 818-827. [8] D. M. Moreira, M. T. Vilhena, M. T. T Costa and B. Bodmann, “Simulation of Pollutant Disper- sion ADMM Approach,” Water, Air and Soil Pollution, Vol. 177, No. 1-4, 2006a, pp. 411-439. doi:10.1007/s11270-006-9182-2 [9] P. Zannetti, “ nology Publications, Southampton, UK, 1990. [10] J. H. Seinf Air Pollution Modeling,” Computer Tech- eld and S. N. Pandis, “Atmospheric Chemistry and Physics,” John Wiley & Sons, New York, 1998, pp. 1326. [11] C. P. Costa, M. T. Vilhena, D. M. Moreira and T. Tira- Copyright © 2011 SciRes. JEP  Puff Models for Simulation of Fugitive Hazardous Emissions in Atmosphere Copyright © 2011 SciRes. JEP 161 c Environment, Vol. 40, bassi, “Semi-Analytical Solution of the Steady Three- Dimensional Advection-Diffusion Equation in the Planetari Boundary Layer,” Atmospheri 2006, pp. 5659-5669. doi:10.1016/j.atmosenv.2006.04.054 [12] S. E. Gryning, A. A. M. Holtslag, J. S. Irwin and B. Siversten, “Applied Dispersion Modelling Based on Me- teorological Scaling Parameters,” Atmospheric Environ- ment, Vol. 21, 1987, pp. 79-89. doi:10.1016/0004-6981(87)90273-3 [13] C. F. Segatto and M. T. M. B. Vilhena, “The State- of-the-Art of the LTSN Method,” Proceeding of M&C'99 Conference on Mathematics and Computation, Reactor ere,” Atmospheric Re- Physics and Environmental Analysis in Nuclear Applica- tions, Vol. 3, No. 2, 1999, pp. 1618-1631. [14] D. M. Moreira, M. T. Vilhena, D. Buske and T. Tirabassi, “The State-of-Art of the GLTT Method to Simulate Pol- lutant Dispersion in the Atmosph search, Vol. 92, 2009, pp. 1-17. doi:10.1016/j.atmosres.2008.07.004 [15] S. E. Gryning and E. Lyck, “Atmospheric Dispersion from Elevated Sources in an Urban Area: Comparison between Tracer Experiments and Model Calculations,” Journal of Climate Applied Meteorology, Vol. 23, No. 4, 1984, pp. 651-660. doi:10.1175/1520-0450(1984)023<0651:ADFESI>2.0.C O;2 [16] J. Pleim and J. S. Chang, “A Non-Local Closure Model for Vertical Mixing in the Convective Boundary Layer,” Atmospheric Environment, Vol. 26, No. 6, 1992, pp. 965- 981. [17] G. A. Degrazia, D. M. Moreira and M. T. M. B. Vilhena, “Derivation of an Eddy Diffusivity Depending on Source Distance for Vertically in Homogeneous Turbulence in a Convective Boundary Layer,” Journal of Applied Mete- orology, 2001, pp. 1233-1240. doi:10.1175/1520-0450(2001)040<1233:DOAEDD>2.0. CO;2 [18] C. Mangia, D. M. Moreira I. Schipa G. A. Degrazia, T. T Tirab . assi and U. Rizza. “Evaluation of a New Eddy Dif- 016/S1352-2310(01)00469-1 fusivity Parameterisation from Turbulent Eulerian Spectra in Different Stability Conditions,” Atmospheric Environ- ment, Vol. 36, No. 1, 2002, pp. 67-76. doi:10.1 [19] D. M. Moreira, J. C. Carvalho, A. G. Goulart and T. Tirabassi, “Simulation of the Dispersion of Pollutants Using Two Approaches for the Case of a Low Source in a SBL: Evaluation of Turbulence Parameterisations,” Water Air and Soil Pollution, Vol. 161, No. 1-4, 2005, pp. 285-297. doi:10.1007/s11270-005-4287-6 [20] T. Tirabassi, F. Baffo and D. M. Moreira, “Eddy Diffu- and T. Tirabassi, terisations by an 3, No. 6, 1989, sivity Parameterizations and Improve Features in an Analytical Multilayer Dispersion Model,” Proceeding of XIII Brazilian Congress of Meteorology, Fortaleza (Br), August 2004. [21] D. Buske, M. T. Vilhena, D. M. Moreira “Evaluation of Eddy Diffusivity Parame Analytical Solution of the Advection-Diffusion Equa- tion,” Proceeding of XIV Brazilian Congress of Meteorology, Florianopolis (Br), November 2006. [22] S. R. Hanna, “Confidence Limit for Air Quality Models as Estimated by Bootstrap and Jackknife Resampling Methods,” Atmospheric Environment, Vol. 2 pp. 1385-1395. doi:10.1016/0004-6981(89)90161-3 [23] J. C. Chang and S. R. Hanna. “Air Quality Model Per- formance Evaluation,” Meteorological Atmosphere Physics, Vol. 87, No. 1-3, 2004, pp. 167-196. |