 Advances in Physical Education 2014. Vo l.4, No.1, 10-24 Published Online February 2014 in SciRes (http://www.scirp.org/journal/ape) http://dx.doi.org/10.4236/ape.2014.41003 OPEN ACCE SS Physiques in Migrant Peasant Worker’s Children by Comparison with Rural and Urban Children in Shanghai, China Jin-Kui Lu 1*, Xiao -Jian Yin2, Takemasa Watanabe1, Yan-Min Lin3, Toyoho Tanaka1 1School of Health and S port Sciences, Chukyo Uni vers ity, 101 Tokodachi, Kaizu-c ho, Toyota, Aichi, Japan 2Key Laboratory of Adolescent Health Assessment and Exercise Intervention, Ministry of Education, School of Phys ical Educ at io n a nd He al th, East China Normal Universit y, Shanghai , China 3Department of Physical Education, Lvliang College, Lvliang, China Email: *lujinkui2013@126.com Received N o v ember 26th, 2013 ; revi sed December 26th, 2013; accepted January 4th, 2014 Copyrigh t © 20 14 Jin-Ku i Lu et al. Thi s is an open ac cess art icle dis tributed under th e Creati ve Common s At- tribution License, which permits unrestricted use, distribution, and reproduction in any medium, provided the original work is properly cited. In accordance of the Creative Commons Attribution License all Copyrights © 2014 are reserved for SCIRP and the owner of the intellectual property Jin-Kui Lu et al. All Cop yright © 2014 are guarded by law and by SCIRP as a guardian. Background: a few studies have been conducted which describe health status of Migrant Peasant Work er’s children. However, there are no studies which compare physiques of MPW’s children with those of rural children and urban children. Also, few studies have been done on physiques of MPW’s children as it relates to socioeconomic f act or s in Chi na . Methods : We examin ed a cr os s-sectional study of 2457 children from Shanghai and Wuhu city in 2011. First, we compared the differences of physiques among three groups by ANOVA. Second, ANCOVA were applied to analyze the associations between the physiques and socioeconomic factors by taking physiques as dependent variables. The independent varia b les i ncluded s oc ioec ono mic fa c tors suc h as the p arent a l occ upa tion, t he pa r ental educ a tion a nd fa m- ily monthly income. Third, ANCOVA were used to assess differences in physiques among the three groups by adj usti ng soci oeconomic fac tors . Results: There wer e signi fic ant dif ferenc es in all physic al in- dexes, no matter they were boys and girls (P < .001). Children’s physiques of MPW were smaller than those of c hil dren of Ci ti z en in Sha n ghai Ci ty. A mon g a ll a ges, rega r dl ess of gender , Chil dr en’s physiques of MP W were bigger tha n those of childr en of rural r esident. In bot h boys and girls all indexes displayed statistically significant associations with parental occupations (P < .001). There were strong associations between parental educ ation and all physi cal indexes ( P < .001). Family monthly inc ome was found t o be significantly associated with children’s physiques (P < .001). In both boys and girls, there were strong ass ociati ons b etween physique and group in al l indexes ( P < .001), but physiques hardly had any associa- tions with s ocioeconomic factors. Conclusions: We fi n d t ha t ph ysi q u es of MPW’s children were small er than those of childr en of c it iz en i n Sha nghai Ci ty, a nd ph ysi q ues of MP W’s chil dr en were b i gger t ha n thos e of children of rur al resident. There are strong associations b etween ph ysiques and soc ioeconomic factors. Key words: Migrant Peasant Worker; Chil dren; Physi ques; Socioeconomic Factors; Group Introduction With the rapid urbanization in China, it was extre mely obvi- ous that there was shortage of labor in southeast coastal cities. Since the economic reform and Opening-Up Policy in China, the spare labor force was transfer ring from rural areas to cit ies, and the population of the labor has consistently increased. The term “Migrant Peasant Worker” (MPW), referred to those who migrate from rural areas to urban areas seeking employment opportunities. Most MPWs children accompanied their parents to the cities. At the end of 2009, the number of MPWs has reached over 145 millions (State Statistic Bureau, 2009). More- over, the number of MPWs’ children l ess than 14 ye a r s o l d was estimated at 15 millions, and about 380 thousand MPWs’ chil- dren were in Shanghai City in 2005 (Xiong, 2010). Chinese government has classified every Chinese citizen as either “r ural register” or “urban register” as a means of catego- rizing household registration. This system is known as “Hukou”. Newborn have to be registered in the area of parental registra- tion. Citizens can only receive government benefits within the district of their household registration. Moreover, any reforma- tions to Hukou are restricted because there are significant dif- ferences in government benefits from local governments in rural Hukou and urban Hukou. Urban citizens enjoy access to state-subsidi es such as food allowance, l ife employment, medi- cal insurance, housing, social security and pensions. Those who were designated as rural Hukou are not entitled to these city- subsidies (Solinger, 1999). MPWs have no access to services from local states d u e to their ru ral Huko u, and their chi ldr en are unable to attend state schools in cities. They usually can not afford expensive private schools, so they are forced to attend schools in very poor condition. Hence, the MPW’s children are at higher risk of suffering from poor health than the children of  J.-K. LU ET AL. OPEN ACCE SS urban Hukou. On the contrary, since the migration from rural area to urban area has i ncreased MPWs family income (Alaimo, Olson, Frongillo, Briefel, 2001), they are in a better position to provide for their children. Their increased income enables more MPWs to purchase medical insurance for their children, which ensures adequat e medical care. From thi s aspect, migratio n has a favorable impact on their children’s health (Belsky, Bell, Bradley, et al., 2007; Black, Morris, Smith, Townsend, White- head, 1988; Bornstein, Hahn, Suwalsky, & Haynes, 2003). Many studies have reported health issues of MPWs and their children. MPWs were generally found to be in poor health, having a co mparatively high prevalence of illness (Chen et al., 2010; Ma, 2008) compared to ch ildren who are cit izen of citi es, MP Ws’ children are underweight and undernourished com- pared to children of citizen in cit ies (Bradley & Kelleh er, 1992; Chen et al., 2010; Chen et al., 2006). Zhang reported that MP Ws’ children have higher prevalence of underweight, ane- mia and d ental caries th an children of citizen s in Shanghai city (Zhang et al., 2005). However, this study was based on physical measure ment onl y in MP Ws’ children. The data for children of citizens in Shanghai city was used fro m a former Yearly Heal th Check Record. Yin showed that MPWs’ children have lower weight than children of citizens in Shanghai city, but this report did not refer to the socioeconomic factors (Yin et al ., 2011). Li reported that the growth and development parameters (height, body weight,chest circumference,vital capacity, body mass index)of children from MPWs were much lower than that of urban children, but the sample size of the study was small (625 subjects including 2 groups), and the socioeconomic factors were not mentioned (Li, Zhou , 2011). Yan showed that MPWs’ children have bigger physique than children living in rural areas from which MPWs’ children come after observing adjustment by family income. The author explained the results in the fol- lowing way. Since the migration improved family income, MPW’s wages afforded them a higher quality of consumer goo ds and lifestyle than that was available to most children living in rural areas, but parental occupation and education were not mentioned (Yan, 2005). There are man y studies on the health problems of immi grant children in other countries. Immigrant children can be divided into international immigrant children and internal migration children. International immigrant is defined as immigrants who move from one country to other country, and internal migration is called migration from one region to another region in the same coun try. We believe th at Chi nese MP Ws exhibit th e same characteristics as international immigrations as well as internal migrations. On the one hand, MPWs have no “urban Hukou” in cities and in the same way international immigrants have no local nationality. On the other hand, Chinese MPWs are from rural ar eas to urban areas in China. The y are similar to internal migration, because both of them speak the same language and have similar lifestyle. The international immigrant children with low socioeco- nomic status (Bogin, Smith, Orden, Varela Silva, Loucky, 2002; Hernandez, 2004) and l imited health care access (Casey, Szet o, Lensing, Bogle, & Weber, 2001; Desai & Alva, 1998; Dittus, Hillers, & Beerman, 1995) were at higher risk of poor health status than native-born children. The immigrant children have been identified as having an array of poor health status and these include: growth retardation (Geltman, Radin, Zhang, Cochran, & Meyers, 2001; Huang, Stella et al., 2006) obesity (Fredriks, Buuren, Jeurissen, et al., 2004; Geltman, Radin, Zhang, Cochran, Meyers, 2001; Guarnaccia, Lopez, 1998), and mental health problems (Guarnaccia, Lopez, 1998; Hu, 2004). For children of internal migration, some studies have showed that they were stunted and underweight due to their bad life- styles (Glew, Brock et al., 2004; Slesinger, Christenson, Caut- ley, 1986). Slesinger repor ted th at the migrant far mers’ children are at substantially greater risk of health problems and earlier mortality than the urban children in Wisconsin, since they lack access to regular physical checkup (Slesinger, Christenson, Cautley, 1986). Glew showed that west Africa Fulani immi- grant children and adolescents (5 - 18 years old) have smaller physiques than Nigerian children in northern Nigeria due to their poor lifestyles (Glew, Bro ck, et al ., 2004). However, some studies have shown that immigration are likely to have earlier onset of puberty ,improved physical status and reduction of the prevalence of stunting (Bogin, Smith et al., 2002; Garnier, Ndiaye, Ben efice, 2003). Bo gin et al. showed that Maya immi- grant children living in Florida in USA are taller and have longer leg than their counterparts living in Guatemala (Bogin, Smith, et al. (2002) Garnier reported that immigration from rural areas to Dakar in Senegal resulted in Senegalese children having an earlier onset of puberty and an improvement of nutri- tional status (higher BMI, fat mass index and midarm circum- ference) but without catch-up in growth (Garnier, Ndiaye, Benefice, 2003). There are almost no reports that internal mi- grant children’s physiques and health status have improved by their immigration in China. Purpose In China, as previously described, there are many studies on the health of MPW’s children. However, there are no studies which compared physiques of MPW’s children with those of rural children and urban children at the same time and few studies on physiques of MPW’s children which take socioeco- nomic factors into consideration. The present study is aimed at evaluating physiques of MPW’s children as they with rural and urban children while taking socioeconomic factors into account. We hypothesize that MPW’s children have smaller physiques than urban children and MPW’s children have bigger physiques than rural children after the adjustment by socioeconomic fac- tors. Methods Study De sign This study was a cross-sectional survey of children aged 7 - 12 years in Shanghai city and Anhui province, China. The re- search plan was approved by the Ethical Committee of Gradu- ate School of Health and Sport Sciences in Chukyo University. Study Area The stud y areas were lo cated in Sh an ghai ci ty and Wu hu cit y in Anhui province. The province is the origin of the greatest number of MPWs in Shanghai city (http://www.stats.gov.cn/tjfx/jdfx/t20110428_402722253.htm.2 011/11/24). Furthermore, the latitude and temperature in Wuhu city are al most the same as Sh anghai cit y (annual average tem- peratu re: Shanghai 15.8˚C, Wuhu city 15.9˚C). Anhui province 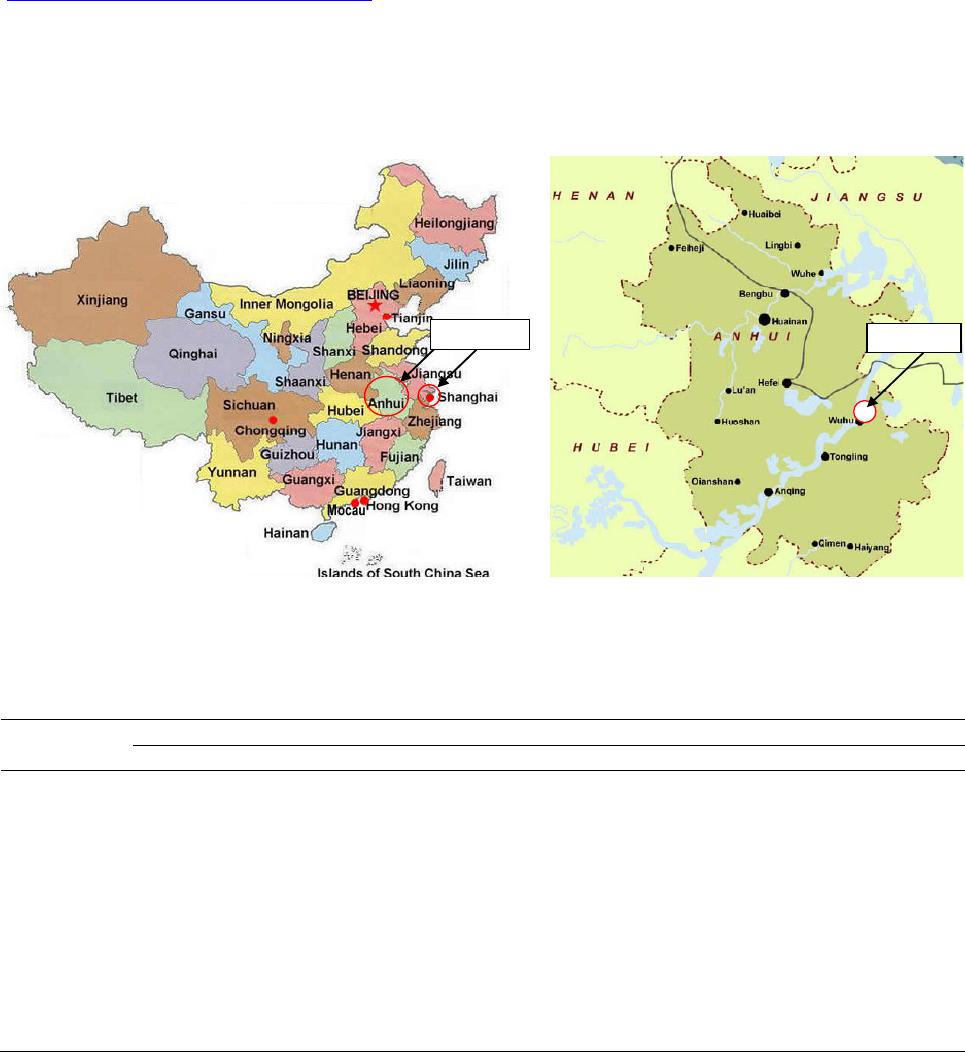 J.-K. LU ET AL. OPEN ACCE SS is located in Eastern China, across the basins of the Yangtze River and the Huai River. The capital of the province is Hefei. Wuhu city locates in 143 km southeast of the Hefei city. The city covers 3317 km2 and contains a total population of about 2,307,000 people. The majority of the population lives in rural area. It is an agricultural district which heavily exports its labor force.29 Shanghai is located at the mouth of Yangtze River Delta in the middle portion of the Chinese coast. Shanghai city covers 6340.5 km2 and contains a total population of about 23,470,000 people. It is a major fi nancial center an d the b usiest hub in China (http://en.wikipedia.org/wiki/Shanghai. 2011/12/02). (Figure 1) Subjects The subjects included two urban groups in Shanghai City and one rural group in Anhui province. Each group consisted of school children from two primary schools. Of two urban groups, one group was MPW’s children in 2 special primary schools founded by MPWs themselves. One of two schools is located in urban areas and another one is in a suburb of Shanghai. The other group is made up of children of Shanghai citizens. The children are from 2 state primary schools. One is located in an urban areas and the other in the suburbs. For the rural group, 2 state primary schools were selected from rural areas in Wuhu city. One lies in rural mountain district and the other is in ru ral plain district. The original cohort consisted of 4132 subjects, all children from 6 primary schools. Among them, 964 were not measured due to their absence during physical measurement session, and 592 did not complete questionnaires. After physi- cal measurement, 119 were excluded, because 95 were not in the required age range of 7 to 12, and 24 were from ethnic mi- nority (Figure 2). We defined children of rural resident as group 1, MPW’s ch ildren as group 2 and children of Citizen in Shanghai City as group 3. Finally, there were 748children in group 1, 914 in group 2 and 795 in group 3 for the analysis (Table 1). (a) (b) Figure 1. Maps showing (a) loc ation of two study areas in China and (b) location of Wuhu City in Anhui province. Table 1. Dist ribution of the demographic characteristic s of the three group children. Rural resident Migrant peasant worker Citizen in Shanghai city N (%) N (%) N (%) All 748 (100) 914 (100) 795 (100 ) Gender Male 438 (5 8.6) 557 (60.9) 4 03 (50.7) Female 310 (41.4) 357 (39. 1) 392 (49.3) Age (years) 7 74 (9.9) 107 (11.7) 1 00 (12.6) 8 97 (13.0) 182 (19.9) 115 (14. 5) 9 120 (16. 0) 204 (22.3) 167 (2 1.0) 10 152 (20.3) 162 (17.7) 206 (25. 9) 11 174 (23.3) 175 (19.2) 149 (18. 7) 12 131 (17.5) 82 (9.0) 58 (7.30) 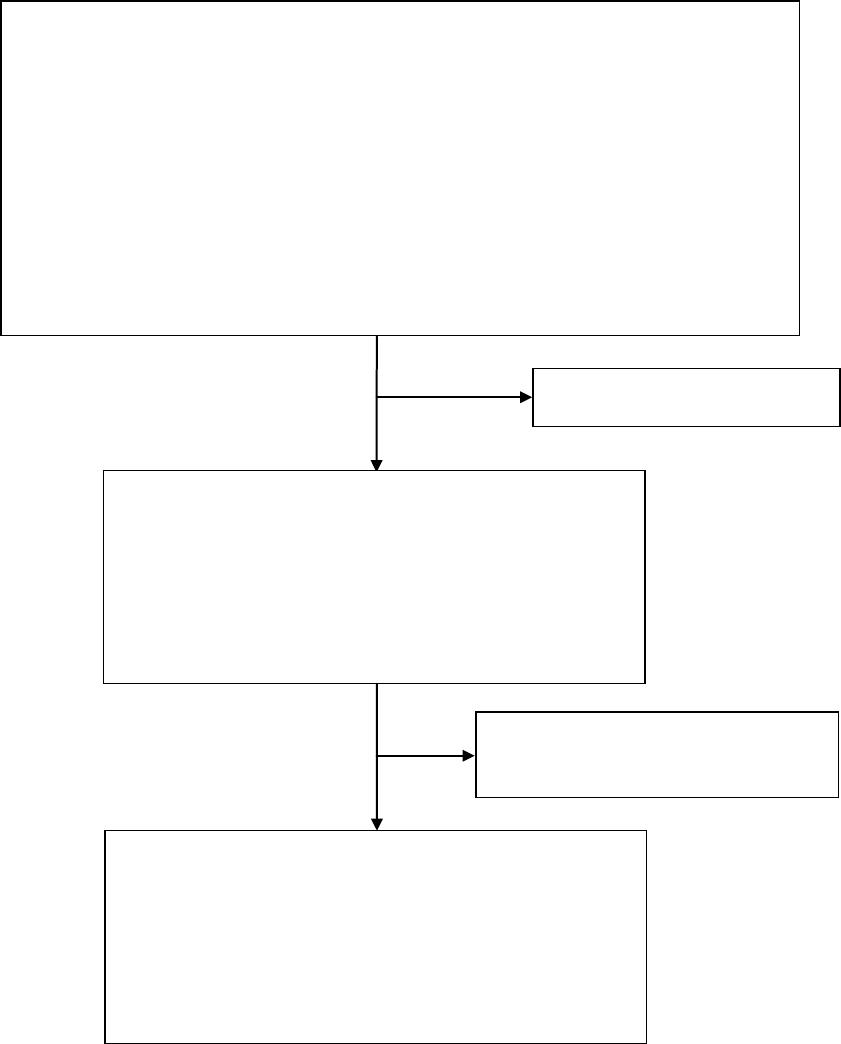 J.-K. LU ET AL. OPEN ACCE SS All students in 6 primary schools (N = 4132) Group 1 (N = 1150) One state primary school in rural plain district in A city, Anhui province, (n = 658) One state primary school in mountain area of rural district in Wuhu city, Anhui province, (n = 592) Group 2 (N = 1392) One primary school for children of Migrant Peasant Worker in unban district in Shanghai city, (n = 754) One primary school for children of Migrant Peasant Worker in suburb in Shanghai city, (n = 638) Group 3 (N = 1590) One state primary school in Unban district in Shanghai city , ( n = 869) One state primary school in suburb in Shanghai city, (n = 721) 119 subjects were excluded: 95 were not in the age range of 7 to 12 24 were from ethnic minority Group 1 (N = 793) School in rural plain district, (n = 438) School in rural mountain district, (n = 355) Group 2 (N = 980) School in urban district, (n = 534) School in suburb, (n = 446) Group 3 (N = 803) School in urban district, (n = 456) Schoolin subur b, (n = 347) 964 were not measured 592 did not complete questionnaires Group 1 (N = 748) School in rural plain district, (n = 418) School in rural mountain district, (n = 330) Group 2 (N = 914) School in urban district, (n = 512) School in suburb, (n = 402) Group 3 (N = 795) School in urban district, (n = 453) Schoolin subur b, (n = 342) Figure 2. Flow chart showing participants and the derivation of sample. Investigators The study comprised survey by questionnaires and anthro- pometric measurements. The seven investigators were gradu ate students majored in sport and health in K university in Shang- hai. They were trained for one week. The training included special instruction for filling in questionnaires and for taking physical measurement. Each of them was put in charge of tak- ing a specific physical measurement, and one of the authors was responsible to the questionnaire. Survey Questionnaire We designed the questionnaire according to the Chinese Na- tional Nutrition and Health Survey, and National Health Inter- view Survey in USA. 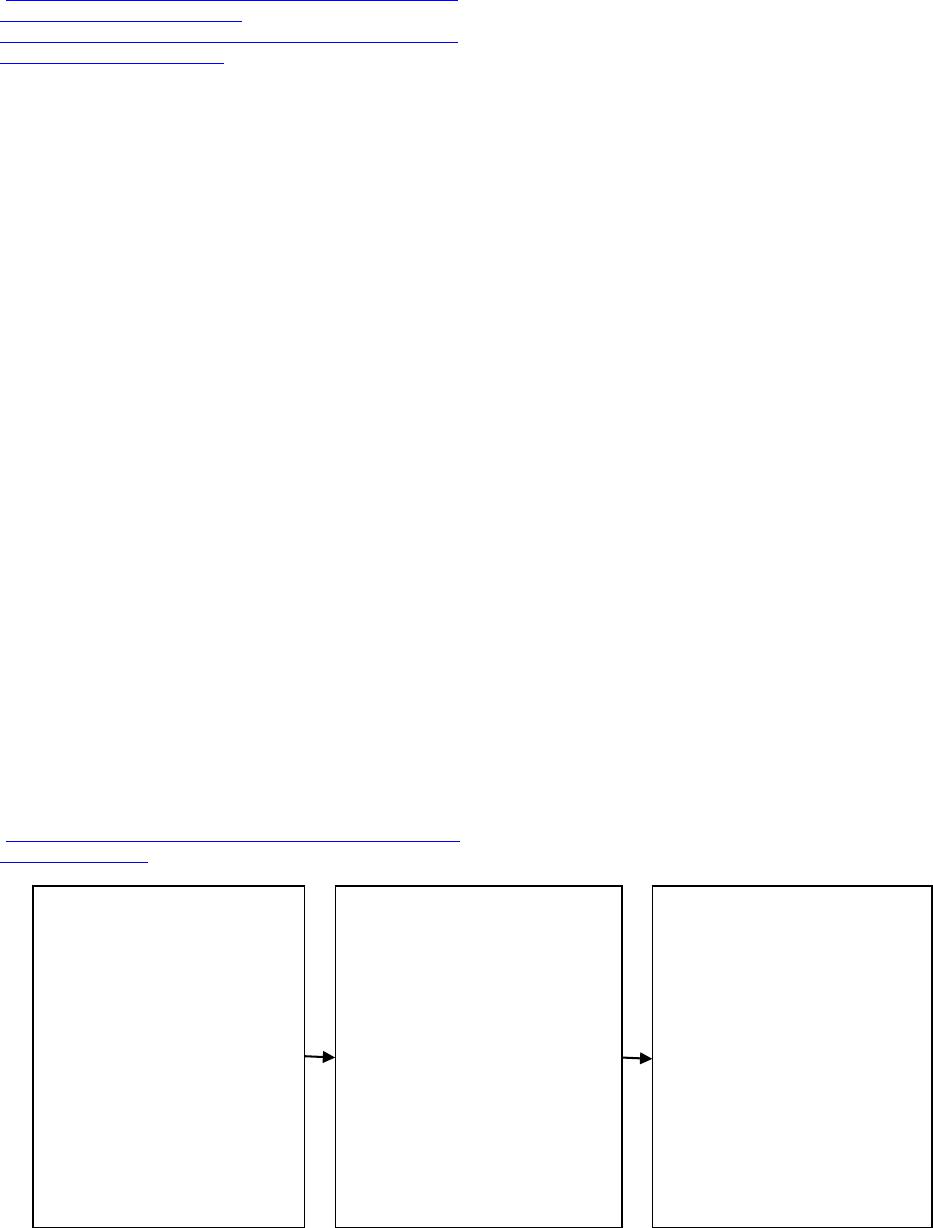 J.-K. LU ET AL. OPEN ACCE SS (http://www.moh.gov.cn/publicfiles/business/htmlfiles/wsb/pzc jd/200804/21290.htm.2010/12/10; http://www.cdc.gov/nchs/nhis/quest_data_related_1997_forwar d.htm#2012_NHIS.2010/11/06) A preliminary questionnaire was assessed by a pilot survey in March, 2010. According to the pilot survey, the questionnaire was slightly modified for ease of un d erstan ding and response. The questionnaire included questions concerning the occupation of child’s parents, the child’s parental education, the guardian’s cognition of health, the child living environment and family status, the child learn- ing and living condition, child’s health status, child’s lifestyle of diet and child’s food intake frequency. We distributed the questionnaire to each school with the principal’s consent. The questionnaires were handed out to the children and were col- lected by the teachers in charge of each class. Each child was asked to complete the questionnaire by consulting with their parent or guardian at home. Physical Measurements The physical characteristics measured in this study were as follows: height, weight, sitting height and body fat percentage. These ph ysical indexes were chosen b ecause heigh t and weight are used to measure to assess the nutritional health status of a child, sitting height is often used as an indication of body pro- portion, and body fat percentage is used as an indication of body composition (Frisancho, 1981; Waterlow, Buzina, Keller, Lane, Nichaman, & Tanner, 1 977). The anthropometric equip- mentswereZT-120 Weight-Height-Sitting height Meter (Wuxi Weighing Apparatus Company, China) and TBF-310 Body Fat Calculator (TANITA Company, Japan). The boys were meas- ured wearing underpants only, and girls wore a t-shir t and a pair of light trousers. No subjects wore shoes. Heights were meas- ured agai nst metal col umn scales, knees n ot bent, ar ms at sides, shoulders relaxed, feet flat on the floor, and recorded to the nearest .1 cm. Sitting heights were measured sitting against metal col umn scales , and recorded to the nearest .1 cm. Weigh- ing was done on platform scales, and the results were recorded to the nearest .1 kg. Body fat percentages were measured standing on platform scales after subject’s feet were clean ed by paper. (http://www.maine.gov/education/sh/heightandweight/heightwe ight.pdf .2011/03/02) Analytical Framework and Statistical Analyses There are many studies that have been conducted which ex- plore the associations between socioeconomic factors and the children’s physiques. Those researches noted that children who live in low-level socioeconomic status are at higher risk of growth retardation or obesity, and that socioeconomic status was a multi-dimensional construct that was most often meas- ured by some combination of income, education, and occupa- tion (Kuh, Power, Rodgers, 1991; Li & Zhou, 2011; Ma, 2008). Therefore, in this report, parental occupation, parental educa- tion and family monthly income were selected as indices of socio economic status (Table 2). In anal ysis of variance (ANOVA ) and analysis of covari ance (ANCOVA), the socioeconomic factors were reclassified be- cause in the questionnaire the classified categories of occupa- tion and family monthly inco me were ex cessi ve, an d th ere were few parents with graduate degree in education. Three socio- economic factors were reclassified as follow: 1) occupation: administrator & office clerk personnel & military personnel (OCP), professional (PRO), business service (BS), agriculture and water conservancy labors (AWCL), production of transport equipment operators (PTEO), unemployed (UNE), others (OTH); 2) education: primary school or lower, junior high school, senior high school, college or higher; 3) famil y monthly income (yuan): ≤2000, 2001 - 5000, 5001≤. (uxin, et al.,2007) The first analyses examined the differences of physique among three groups by ANOVA. The dependent variables in- cluded height, weight, sitting height, body fat percentage. Sec- ondly, ANCOVA were applied to analyze the associations be- tween children’s physiques and socioeconomic factors by tak- ing height, weight, sitting height, body fat percentage as de- pendent variables, socioeconomic factors (parental occupation, parental education, family monthly income) as independent variables, and age as a covari ant . Thi rdl y, ANCOVA were u sed to assess differences of physiques among three groups by ad- justing socioeconomic factor (parental occupation, parental education, family monthly income). The analyses were exe- cuted by taking physiques as a dependent variable, the group and so cioecon omic factors as indep end ent variab les, an d age as a covariant (Figure 3). All statistical analyses were performed using SPSS17.0 for Windows. ANOVA <Comparison among three groups> Dependent variable, Height, Weight, Sitting height, Body fat percentage Independent variable, Group Age ANCOVA <Comparison among socioeconomic factors > Dependent variable Height, Weight, Sitting height, Body fat percentage Independent variable Paren tal occupati on Paren tal educati on Family income per month Covariant variable Age ANCOVA <Comparison among socioeconomic facto rs an d grou p> Dependent variable Height, Weight, Sitting height, Body fat percentage Independent variable Parental occupation, Group Parental education, Group Family income per month, Group Covariant variable Age Figure 3. Conceptual fram eworks f or analyses .  J.-K. LU ET AL. OPEN ACCE SS Tabl e 2. Socioeconomic st atus of families of the part icipan ts. Rural resident N (%) Migrant peasan t worker N (%) Citizen in Shanghai city N (%) <Parental occupation > Father 714 (95.5) 875 (95.7) 765 (96.2) Professional 43 (5.8) 35 (3.8) 166 (20.9) Office clerk per so nnel 35 (4.7) 23 (2.5) 62 (7.8) Agriculture and water conservancy labors The production of transport equipm ent operators 86 (11.5) 509 (55.7) 1 86 (23.4) Unemployed 40 (5.4) 22 (2.4) 22 (2.8) Mother 7 13 (95.3) 882 (96. 5) 770 (96.9) Professional 35 (4.7) 18 (2.0) 92 (11.6) Agriculture and water conservancy labors 284 (38. 0) 15 (1.6) 20 (2.5) The production of transport equipm ent operators Military personnel 1 (.1) 1 (.1) 0 (0) Unemployed 84 (11.2) 428 (46.8) 63 (7.9) <Par ental educati on> Father 714 (95.5) 873 (95.5) 765 (96.2) Junior high sc hool 382 (51.1) 414 (45.3) 188 (23.7) Graduate 1 (.1) 2 (.2) 24 (3.0) Mother 718 (96.0) 886 (96.9) 771 (97. 0) Senior high school 50 (6.7) 130 (6.3) 229 (28.8) Graduate 2 (.3) 4 (.4) 9 (1.1) <Family monthly income, yuan> 575 (76.9) 835 (91.4) 749 (94.2) ≤ 1000 1 73 (23.1) 66 (7.2) 12 (1.5) 1001 ~ 2000 194 (25.9) 202 (2 2.1) 73 (9.2) 2001 ~ 3000 114 (15.2) 153 (1 6.7) 85 (10.7) 3001 ~ 4000 32 (4.3) 101 (11.1) 85 (10.7) 4001 ~ 5000 21 (2.8) 96 (10.5) 86 (10.8) 5001 ~ 6000 14 (1.9) 55 (6.0) 114 (14.3) 6001 ~ 7000 8 (1.1) 47 (5.1) 66 (8.3) 7001 ~ 8000 5 (.7) 21 (2.3) 65 (8.2) 8001 ~ 10000 5 (.7) 49 (5.4) 88 (11.1) 10000< 9 (1.2) 45 (4.9) 75 (9.4) Unknown 173 (23.1) 79 (8.6) 46 (5.8) aClassification of socioeconomic factor were adjusted by according to Chi nese sixth nat iona l c e ns us , 2 0 10 . bThe data which were filled as “unk now n” were excluded in the analysis.  J.-K. LU ET AL. OPEN ACCE SS Results Table 2 presents the frequencies and proportions of chil- dren’s parental occupation, parental education and family monthly income. For the fathers, a high proportion of the occupations were AWCL with 31%, OTH with 18% and BS with 15% in group 1, PTEO with 56% and BS with 19% in group 2, and PTEO with 23%, PRO w it h 21% and BS with 20% in group 3. For mothers, those were as follows: AWCL with 38%, OTH with 15% and BS with 14% in group 1, UNE with 47%, BS with 21% and OTH with 14% in group 2, and BS with 29%, OCP with 15% and PTEO with 15% in grou p 3. Group 1 tended to have a high proportion of AWCL in both parents, Group 2 did PTEO in father and UNE in mother, and group 3 did PRO, OCP and AD (administrator) in both par e nt s . Regarding the parental education, father’s education level of junior high school or lower was 84% in group 1, 66% in gr oup 2, and 26 % in grou p 3. The career of coll ege or higher was 3% in group 1, 8% in group 2, and 31% in group 3. For mothers, junior high school or lower was 85% in group 1, 76% in group 2 and 42% in group 3. The career of college or higher was 2% in group 1, 7% in group 2 and 26% in group 3. The education level was high in ascending order of group 1, group 2 and group 3 in both father and mother. Father’s level was higher than mother’s in all groups. Family monthly income (yuan) was high in ascending order of group 1, group 2 and group 3. The income of 2000 or less was 49% in group 1, 29% in group 2, and 11% in group 3.The income of 5001 or higher was 6% in group 1, 23% in group 2, and 51% in group 3. Comparison of Physique among Three Groups by ANOVA Comparisons of physique among three groups were pre- sented in Fig ure 4. There were significant differences in all physical indexes, no matter what boys and girls (P < .001). Children’s physiques of group 2 were smaller than group 3 except for sitting height (7-year-old boys, 12-year-old girls) and body fat percentage (7-year-old boys, 7 to 9-year-old girls). In all age, regardless of gender, physiques in group 2 were bigge r than group 1. Relatio nship be tween Physique and Socioeconomic Factor by ANCOVA Tables 3 and 4 show associ ations of physiques with parental occupation. In both boys and girls all indexes displayed statis- tically significant associations with parental occupations (P < .001). Among the occupations in fathers, AWCL and UNE had relatively small physiques, and OCP, PRO and PTEO showed big physiques in both boys and girls. In respect of mother’s occupations, AWCL had relat ively small physiques in boys. Similarly, AWCL had relatively small physiques while OCP, PRO, B S and PTEO sh owed big phys iques in girls. Tabl e 3. Comparison of physiques by father’s occupation. Height Weigh t Sitting height Body fat percentage Beta (95%CI ) F-value P-value Beta (95%CI) F-value P-value Beta (95%CI) F-value P-value Beta (95%CI ) F-value P-value <Boys> Occupationa 15.17 <.001 14.32 <.001 17.04 <.001 16.64 <.001 OCP .85 (−1.00 - 2.7) 1.79 (−.09 - 3.66) −.34 (−1.40 - .71) .68 (−.59 - 1.96) PRO 1.92 (.13 - 3.72) .92 (−.90 - 2.74) .25 (−.77 - 1.28) 2.10 (.86 - 3.33) BS .12 (−1.40 - 2.7) −.02 (−1.56 - 1.53) .21 (−.66 - 1.08) .58 (−.47 - 1.63) AWCL −5.05 (−6.76 - −3.34) −4.51 −6.25 - −2.78) −2.93 (−3.90 - − −2.60 (−3.78 - −1.42) PTEO 1.39 (.01 - 2.78) 1.91 (.50 - 3.32) 1.08 (.29 - 1.87) 2.00 (1.04 - 2.95) UNE −1.63 (−4.10 - .84) −1.89 (−4.40 - .61) −1.56 (−2.97 - −.16) −.50 (−2.20 - 1.19) OTHb — — — — Age (years) 4.58 (4.31 - 4.86) 1063.42 <.001 2.77 (2.49 - 3.05) 377.18 <.001 1.87 (1.72 - 2.03) 546.59 <.001 .46 (.27 - .65) 22.96 <.001 <Girls> Occupation 15.58 <.001 14.59 <.001 15.02 <.001 11.97 <.001 OCP 3.08 (1.09 - 5.07) 2.10 (.45 - 3.76) .96 (−.14 - 2.05) .62 (−.68 - 1.91) PRO 4.58 (2.65 - 6.51) 2.11 (.51 - 3.72) 1.59 (.53 - 2.65) .41 (−.85 - 1.67) BS 1.71 (.01 - 3.41) 1.69 (.27 - 3.1) 1.01 (.07 - 1.95) .48 (−.63 - 1.59) AWCL −3.72 (−5.69 - −1.75) −3.21 −4.85 - −1.57) −2.43 (−3.52 - − −2.92 (−4.21 - −1.64) PTEO 3.14 (1.61 - 4.67) 2.95 (1.68 - 4.22) 1.88 (1.04 - 2.72) 1.73 (.73 - 2.73) UNE −1.79 (−4.73 - 1.14) −1.54 (−3.98 - .90) −.09 (−1.71 - 1.52) −1.46 (−3.38 - .45) OTH — — — — Age (years) 4.62 (4.29 - 4.95) 765.69 <.001 2.68 (2.40 - 2.95) 371.25 <.001 1.98 (1.80 - 2.16) 464.42 <.001 .50 (.29 - .71) 21.04 <.001 aOCP: Office clerk pers on nel, PRO: Professional, BS: Business service, AWCL: Agriculture and water conservancy labors, PTEO : The p ro d uct io n of t ra ns po rt equ ip me nt operators, UNE: Unemp l oye d, OTH: Other. bOTH was set as reference. 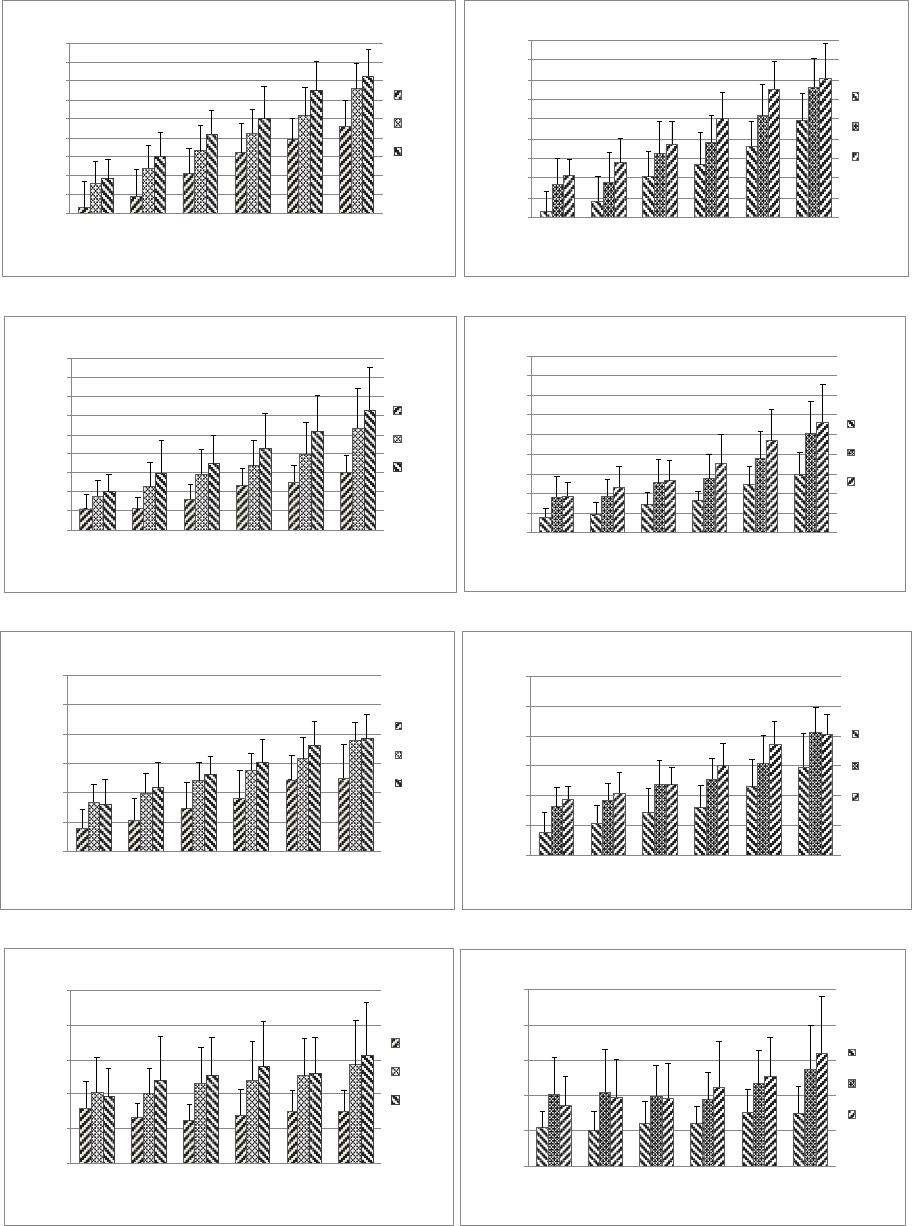 J.-K. LU ET AL. OPEN ACCE SS Height Wei ght Sitting height Body fat percentage Figure 4. Comparisons of physiques among three groups by ANOVA. 115 120 125 130 135 140 145 150 155 160 115 120 125 130 135 140 145 150 155 160  J.-K. LU ET AL. OPEN ACCE SS Table 4. Comparison of physiques by mother’s occupation. Height Weigh t Sitting height Body fat percentage Beta (95%CI ) F-value P-value Beta (95%CI) F-value P-value Beta (95%CI) F-value P-value Beta (95%CI ) F-value P-value <Boys> Occupationa 13.80 <.001 16.55 <.001 13.49 <.001 12.51 <.001 OCP 1.13 (−.66 - 2.92) 2.18 (.37 - 3.99) −.70 (−1.74 - .34) 1.35 (.11 - 2.59) PRO −.71 (−2.12 - 2.02) .22 (−1.89 - 2.33) −.46 (−1.67 - .75) .54 (−.91 - 1.99) BS .20 (−1.21 - 1.61) 1.21 (−.21 - 2.63) −.23 (−1.05 - .58) 1.07 (.09 - 2.04) AWCL −5.55 (−6.76 - −3.34) −5.40 −6.99 - −3.81) −3.31 −4.23 - − −2.80 (−3.89 - −1.71) PTEO −1.07 (−2.72 - .57) −.28 (−1.93 - 1.38) −.54 (−1.49 - .41) .34 (−.80 - 1.47) UNE −.24 (−1.61 - 1.14) .17 (−1.21 - 1.56) −.22 (−.58 - 1.01) .98 (.03 - 1.94) OTHb — — — — Age (years) 4.50 (4.22 - 4.77) 1034.18 <.001 2.70 (2.42 - 2.98) 367.96 <.001 1.83 (1.68 - 1.99) 514.33 <.001 .41 (.22 - .60) 17.52 <.001 <Girls> Occupation 19.82 <.001 15.62 <.001 17.48 <.001 9.96 <.001 OCP 4.46 (2.39 - 6.52) 2.90 (1.17 - 4.63) 1.33 (.18 - 2.48) .75 (−.61 - 2.10) PRO 4.23 (1.97 - 6.49) 1.90 (.01 - 3.80) .88 (−.38 - 2.14) −.18 (−1.67 - 1.30) BS 2.17 (.50 - 3.84) 1.99 (.59 - 3.39) .75 (−.187 - 1.68) 1.12 (.03 - 2.22) AWCL −4.73 (−6.60 - −2.86) −3.59 −5.16 - −2.03) −3.22 −4.27 - − −2.57 (−3.80 - −1.34) PTEO 2.90 (.88 - 4.92) 2.81 (1.12 - 4.50) 1.25 (.13 - 2.38) 1.59 (.26 - 2.91) UNE .85 (−.81 - 2.51) 1.16 (−.24 - 2.55) −.54 (−.39 - 1.46) .80 (−.29 - 1.89) OTH — — — — Age (years) 4.64 (4.32 - 4.96) 795.39 <.001 2.72 (2.45 - 2.994) 389.18 <.001 2.00 (1.82 - 2.18) 475.56 <.001 .54 (.33 - .75) 24.98 <.001 aOCP: Office clerk personnel, PRO: Professional, BS: Business service, AWCL: Agriculture and water conservancy labors, PTEO : The p ro duc t ion o f t ra ns por t e qu ip me nt operators, UNE: Unemp l oye d, OTH: Other. bOTH was set as reference. There were strong associations between parental education and all physical indexes (Table 5, P <.001). In both boys and girls, children of fathers with higher education were bigger than those that had lower edu cation. With regard to mothers’ educa- tion, the results yielded almost the same as fathers’. Family monthly income was significantly associated with children’s physiques (P < .001). In both sexes, higher was the family monthly income, bigger or higher were the physiques of children in all ind exes (Table 6). Associations of the Physiques with Socioeconomic Factors and Group by ANCOVA Tables 7 and 8 show that there were strong associations (boys and girls) between physique and group in all indexes (P < .001), but physiques hardly had any associations with socio- economic factors. After the adjustment by socioeconomic fac- tors, the sizes of physiques were big in descending order of group 3, group 2 and gro up 1, while ANCOVA was performed taking socioeconomic factors and group as independent vari- ables when age was taken as a covariate. Discussion This study showed significant differences in physiques among three groups. Physiques of MPW’s children were smaller than children of citizen in Shanghai City, and MPW’s children had bigger physiques than rural children. The former finding is consistent with previ ous stu dies th at repo rte d MPW’s children were smaller than urban children (Bradley, Kelleher, 1992; Chen et al., 2010 ; Chen et al., 2006). The latter finding is also consistent with the results from a previous study (Yan, 2005) We also found that there were strong associations be- tween p hysiques and each socioeconomic factor such as famil y income, parental occupation and parental education. These findings were consistent with studies that children from high SES family have bigger physiques than those from low SES family (Morton, et al., 2002; McBride, 1990; Mahoney, Kaiser et al., 1999; McLoyd, 1998; Ma, Wu, Yang, 2010; NICHD Early Child Care Research N etwork, 1998; Ortega, Fang, Perez, et al., 2007; P arke, Coltrane, Duffy, Buriel, Denn is et al., 2004; Rona, Chinn, 1991; Solinger, 1999; Mohanty, Woolhandler, Himmelstein, Pati, Carrasquillo, Bor, 2005; Slesinger, Chris- tenson, Cautley, 1986; Stamatakis, Wardle, C ole, 2010). Finally, by the ANCOVA in which both socioeconomic factors and groups were taken as independent variables and age was taken as a covariate, although strong associations between physiques and group were identified, there were hardly associations be- tween socioeconomic factors and physiques. At first, the associations between physiques and socioeco- nomic factors were discussed. In this study, we examined pa- rental occupation , parental educational career and family monthly income among socioeconomic factors. In this study, children whose parents were AWCL had rela- tively small physiques, and OCP and PRO did big physiques in  J.-K. LU ET AL. OPEN ACCE SS Tabl e 5. Associations between parental education and physiques. Height Weigh t Sitting height Body fat percentage Beta (95%CI ) F-value - Beta (95%CI) F-value - Beta (95%CI) F-value P-value Beta (95%CI ) F-value P-value <Boys> Father’s education 35.21 <.001 35.53 <.001 35.46 <.001 26.67 <.001 Primary school or 6.46 −7.94 - −4.97) Junior high school 4.26 −5.60 - −2.93) − −7.96 - −4.94) −3.55 (−4.40 - −2.70) −3.65 (−4.69 - −2.61) Senior high school 1.28 (−2.74 - .19) − −5.95 - −3.23) −2.22 (−2.98 - −1.45) −2.65 (−3.58 - −1.71) College or highera — − (−2.82 - .16) −.41 (−1.25 - .43) −.51 (−1.54 - .51) Age (years) 4.61 (4.33 - 4.88) 1082.76 <.001 — — — <Girls> 2.79 (2.51 - 3.07) 385.67 <.001 1.89 (1.73 - 2.04) 555.12 <.001 .43 (.24 - .62) 19.09 <.001 Father’s education 4.36 <.001 Primary school or 8.04 −9.68 - −6.41) 28.26 <.001 42.03 <.001 8.89 <.001 Junior high school 4.62 −6.00 - −3.24) − −6.85 - −4.09) −4.36 (−5.26 - −3.46) −2.29 (−3.39 - −1.19) Senior high school 1.44 (−2.92 - .05) − −4.40 - −2.08) −2.19 (−2.95 - −1.43) −1.79 (−2.72 - −.87) College or higher — −.76 (−2.01 - .50) −.34 (−1.16 - .48) −.50 (−1.50 - −.50) Age (years) 4.77 (4.45 - 5.08) 863.33 <.001 — — — <Boys> Mother’s education 32.70 <.001 36.14 <.001 19.49 <.001 24.35 <.001 lower 5.45 −6.91 - −3.98) − −7.55 - −4.60) −2.72 (−3.58 - −1.86) −3.58 (−4.60 - −2.56) Junior high school 3.14 −4.60 - −1.68) − −5.06 - −2.12) −1.87 (−2.73 - −1.02) −2.71 (−3.72 - −1.69) Senior high school −.19 (−1.83 - 1.44) .74 (−2.38 - .91) −.56 (−1.57 - .40) −.78 (−1.91 - .36) College or higher — — — — Age (years) 4.65 (4.37 - 4.92) 1114.96 <.001 2.87 (2.59 - 3.14) 419.67 <.001 1.89 (1.73 - 2.05) 536.49 <.001 .48 (.29 - .67) 22.44 <.001 <Girls> Mother’s education 34.51 <.001 24.79 <.001 21.39 <.001 5.57 <.001 lower 7.33 −8.87 - −5.79) − −6.56 - −3.96) −3.30 (−4.17 - −2.43) −2.04 (−3.08 - −1.01) Junior high school 3.94 −5.47 - −2.40) − −4.25 - −1.66) −1.70 (−2.56 - −.83) −1.38 (−2.40 - −.35) Senior high school 2.44 (−4.17 - .70) − (−3.25 - −.32) −1.28 (−2.26 - −.30) −.85 (−2.01 - .32) College or higher — — — — Age (years) 4.84 ( 4.52 - 5.17) 868.47 <.001 2.88 (2.67 - 3.15) 433.50 <.001 2.12 (1.93 - 2.30) 519.76 <.001 .62 (.41 - .84) 32.14 <.001 aCo lle ge or higher was set as reference. Tabl e 6. Associations between family monthly income and physiques. Height Weight Sitting height Body fat percentage Beta (95%CI ) F-value P-value Beta (95%CI) F-value P-value Beta (95%CI) F-value P-value Beta (95%CI ) F-value P-value <Boys> income 55.51 <.001 40.55 <.001 45.91 <.001 28.00 <.001 ≤2000 −5.68 (−6.77 - −5.0) −4.88 (−5.97 - −3.79) −3.07 −3.70 - −2.43) −2.87 (−3.62 - −2.11) 2001-5000 −1.93 (−2.99 - −.87) −1.74 (−2.80 - −.68) −1.22 (−1.84 - −.60) −1.49 (−2.22 - −.76) 5001≤a — — — — Age (years) 4.73 (4.45 - 5.01) 2.97 (2.69 - 3.25) 435.46 <.001 1.93 (1.77 - 2.10) 536.81 <.001 .54 (.35 - .73) 30.23 <.001 <Girls> Family monthly 50.35 <.001 38.55 <.001 34.48 <.001 13.05 <.001 ≤2000 −6.22 −7.46 - − −4.43 (−5.48 - −3.38) −2.92 −3.61 - −2.22) −1.94 (−2.79 - −1.09) 2001-5000 −2.10 (−3.33 - −.87) −.89 (−1.93 - .15) −1.13 (−1.82 - −.44) −.07 (−.91 - .77) 5001≤ — — — — Age (years) 5.00 (4.64 - 5.31) 858.88 <.001 3.00 (2.68 - 3.24) 423.51 <.001 2.14 (1.95 - 2.33) 504.53 <.001 .63 (.41 - .86) 29.66 <.001 a5001≤ was set as reference.  J.-K. LU ET AL. OPEN ACCE SS Tabl e 7. Associations of physiques with occupation, education, family monthly income, and group by ANCOVA, boys. Height Weigh t Sitting height Body fat percentage Beta (95%CI) F-value P-value Beta (95%CI) F-value P-value Beta (95%CI) F-value P-value Beta (95%CI) F-value P-value Father’s occupation .87 1.93 2.24 <.05 2.81 <.05 Group 155.60 <.001 149.78 <.001 168.00 <.001 102.89 <.001 1 −6.80 (−9.24 - −4.37) −7.63 (−10.12 - −5.15) −3.96 (−5.34 - −2.57) (−5.17 - −1.64) 2 a — — — — 3 4.11 (1.40 - 6.81) 4.81 (2.04 - 7.57) .84 (−.70 - 2.37) 2.55 (.59 - 4.51) Age 4.86 (4.61 - 5.10) 1512.27 <.001 3.04 (2.79 - 3.29) 569.12 <.001 2.04 (1.90 - 2.18) 828.55 <.001 .62 (.45 - .80) 47.93 <.001 Mother’s occupation 1.35 1.01 3.11 <.05 .72 Group 160.56 <.001 136.52 <.001 198.15 <.001 106.03 <.001 1 −6.52 (−8.82 - −4.22) −8.00 (−10.32 - −5.65) −4.14 (−5.44 - −2.83) 4.24 (−5.89 - −2.59) 2 — — — — 3 4.93 (2.61 - 7.25) 4.30 (1.95 - 6.65) 1.31 (−.01 - 2.62) 2.03 (.37 - 3.70) Age 4.86 (4.62 - 5.12) 1503.69 < .001 3.08 (2.83 - 3.33) 586.10 <.001 2.07 (1.93 - 2.21) 845.04 <.001 .64 (.46 - .82) 50.60 <.001 Father’s education .37 .34 1.93 1.16 Group 68.85 <.001 70.12 <.001 58.90 <.001 45.18 <.001 1 −5.98 (−10.88 - −1.08) −9.50 (−14.52 - −4.49) −3.15 (−5.94 - −.37) (−8.074 - −.94) 2 — — — — 3 5.57 (3.18 - 7.96) 3.05 (.60 - 5.50) 1.85 (.49 - 3.21) 1.96 (.22 - 3.71) Age 4.92 (4.68 - 5.17) 1537.70 <.001 3.12 (2.87 - 3.37) 589.82 <.001 2.10 (1.96 - 2.24) 863.60 <.001 .65 (.47 - .82) 49.76 <.001 Mother’s education .63 .42 .94 .53 Group 80.35 <.001 74.93 <.001 68.83 <.001 44.89 <.001 1 −5.82 (−12.15 - .50) −7.24 (−13.67 - −.81) −3.14 (−6.78 - .50) (−9.15 - .03) 2 — — — — 3 7.08 (4.59 - 9.59) 5.47 (2.93 - 8.01) 2.48 (1.04 - 3.92) 2.40 (.59 - 4.20) Age 4.88 (4.64 - 5.12) <1567.60 <.001 3.11 (2.86 - 3.35) 615.83 <.001 2.05 (1.91 - 2.19) 837.88 <.001 .64 (.47 - .81) 51.83 <.001 Family monthly income 3.04 <.05 .58 .33 1.66 Group 135.67 <.001 122.80 <.001 134.64 <.001 <.001 <.001 1 −9.93 (−12.83 - −7.02) −7.79 (−10.71 - −4.87) −5.56 (−7.24 - −3.89) (−5.91 - 1.78) 2 — — — — 3 3.63 (2.16 - −5.10) 3.59 (2.12 - 5.07) .94 (.09 - 1.79) 1.38 (.33 - 2.43) Age 4.93 (4.68 - 5.18) 1488.72 <.001 3.16 (2.90 - 3.41) 605.98 <.001 2.06 (1.91 - 2.20) 780.33 <.001 .68 (.50 - .85) 55.36 <.001 aGroup 2 was set as reference. both boys and girls. Kuh DL et al. have reported that children (7, 10, 11 yrs) whose fathers’ occupations were non-manual work had taller than those with manual work (Kuh, Power, Rodgers, 1991). AWCL is considered to belong to manual work, and OCP and PRO to non-manual work according to Registrar General’s categories in UK (Black, Morris, Smith, Townsend, Whitehead, 1988; Kuh, Power, Rodgers, 1991). Therefore, our findings are generally consistent with the report. Parents with non-manual occupation can provide their children an array of services, goods such as proper clothing, housing and food, which are b eneficial to child ren. Many children of parents with manual occupation lack access to those same resources and benefits, thus putting them at risk for underweight (Halldorsson, Kunst, Kohler, Mackenbach, 2000; Rona, Chinn,1991). In our data, occupations such as OCP and PRO are regarded as non-manual occupation, and they had a tendency to earn high wage. Therefore, similar mechanisms are assumed to have worked on the research populations. Parental educational career has a definite association with children’s physiques, that is, children with higher parental edu- cational career have a tendency towards bigger physiques. Many studies showed that parental education has a profound influence on child’s physical growth. (Parke, Coltrane, Duffy, Buriel, Dennis et al., 2004; Ron a & Chin n, 1991; Solinger, 1999). Physiques of children whose parents have high-level education are bigger than those whose parents had low-level  J.-K. LU ET AL. OPEN ACCE SS Tabl e 8. Associations of physiques with occupati on, education, family monthly income, and group by ANCOVA, girls. Height Weigh t Sitting height Body Fat Percentage Beta (95%CI) F-value P-value Beta (95%CI) F-value P-value Beta (95%CI) F-value P-value Beta (95%CI) F-value P-value Father’s occupation 1.13 1.05 .76 1.05 Group 83.42 <.001 82.48 <.001 106.76 <.001 36.48 <.001 1 −5.32 (−8.09 - −2.57) −4.92 (−7.26 - −2.59) −1.77 (−3.28 - −.26) −3.91 (−5.85 - −1.97) 2 a — — — — 3 7.29 (4.34 - 10.25) 4.38 (1.88 - 6.88) 3.30 (1.68 - 4.92) 1.45 (−.62 - 3.53) Age 5.06 (4.76 - 5.36) 1093.38 <.001 3.03 (2.78 - 3.29) 549.71 <.001 2.25 (2.09 - 2.42) 722.55 <.001 .73 (.52 - .95) 46.69 <.001 Mother’s occupation 1.80 .90 .51 .49 Group 104.98 <.001 87.93 <.001 139.69 <.001 39.54 <.001 1 −5.63 (−8.56 - −2.70) −3.92 (−6.37 - −1.47) −2.76 (−4.36 - − 2.35 (−4.36 - −.34) 2 — — — — 3 5.77 (2.69 - 8.85) 6.10 (3.52 - 8.67) 2.61 (.93 - 4.29) 3.47 (1.36 - 5.58) Age 5.03 (4.74 - 5.33) 1122.30 <.001 3.06 (2.82 - 3.31) 594.04 <.001 2.25 (2.09 - 2.41) 749.54 <.001 .75 (.55 - .96) 53.37 <.001 Father’s education 1.11 .74 2.58 .74 Group 50.73 <.001 57.35 <.001 60.51 <.001 30.23 <.001 1 −6.17 (−11.12 - −1.21) −8.05 −12.23 - −3.87) −5.21 (−7.92 - − −3.31 (−6.77 - .15) 2 — — — — 3 4.85 (2.19 - 7.52) 1.84 (−.41 - 4.09) 1.07 (−.39 - 2.53) −.78 (−2.64 - 1.08) Age 4.98 (4.69 - 5.27) 1133.19 <.001 3.01 (2.77 - 3.26) 581.97 <.001 2.26 (2.10 - 2.42) 776.52 <.001 .77 (.57 - .98) 55.94 <.001 Mother’s education 1.61 .22 1.08 1.00 Group 60.01 <.001 56.79 <.001 67.73 <.001 25.55 <.001 1 −4.57 (−10.92 - 1.77) −6.88 −12.24 - −1.51) −3.29 (−6.79 - .21) −1.79 (−6.22 - 2.65) 2 — — — — 3 7.49 (4.24 - 10.75) 2.44 (−.31 - 5.19) 2.78 (.98 - 4.57) .18 (−2.10 - 2.45) Age 5.02 (4.73 - 5.31) 1157.33 <.001 3.05 (2.81 - 3.30) 596.80 <.001 2.23 (2.07 - 2.39) 752.18 <.001 .76 (.56 - .96) 54.05 <.001 Family monthly income 2.74 2.93 .09 1.47 Group 74.73 <.001 68.38 <.001 1144.16 <.001 42.14 <.001 1 −7.85 (−11.70 - −4.00) −7.24 −10.51 - −3.97) −4.08 (−6.20 - − −5.50 (−8.22 - −2.78) 2 — — — — 3 4.21 (2.29 - −6.13) 1.79 (.16 - 3.42) 1.69 (.63 - 2.75) .18 (−1.18 - 1.54) Age 5.09 (4.79 - 5.40) 1072.88 <.001 3.08 (2.82 - 3.34) 543.17 <.001 2.23 (2.06 - 2.39) 672.58 <.001 .73 (.51 - .94) 43.55 <.001 aGroup 2 was set as reference. education (Mohanty, Woolhandler, Himmelstein, Pati, Carras- quillo, Bor, 2005; Slesinger, Christenson, Cautley, 1986; Sta- matakis, Wardle, Cole, 2010; Chin J School Health, 2011) . Parents with high level of education have resources to promote health of children, and are in a better position to prevent or reduce their disease. Moreover, parents with high level of edu- cation may also have a higher standard of living and healthier behaviors, which have a direct influence on their children. Ma- ternal education is shown to have a strong association with childcare and thus impacts a child’s development (Boyle, Racine, Georgiades, et al., 2006; NICHD Early Child Care Research Network, 1998). Wang et al. have reported that there were strong associations between fathers’ education and child development in China. (Wang & Zhou, 2012) In this study, the education level was high in ascending order of group 1, group 2 and group 3 in both father and mother, and children’s physiques correlated with their parent’s education level. This finding is consistent with previous studies (Mohanty, Woolhandler, Himmelstein, Pati, Carrasquillo, Bor, 2005; Slesinger, Chris- tenson, Cautley, 1986; Stamatakis, Wardle, Cole, 2010; Shi et al., 2011). The associations between socioeconomic status and chil- dren’s physiques have often been explained in terms of family income (Will, Zeeb, et al., 2005). In our study, children from high-income family have relatively bigger physique than those from l o w-in come fami ly (Table 6). These resul ts are consistent with previous studies (Waterlow, Buzina, Keller, Lane, Nicha- man, & Tanner , 1977; Weinreb, Goldberg, Perloff, 1998; Wang, Zhou, 2012). The determination of how family income affects children’s physique is explained in the following ways. Family income influences the ability to purchasing healthy items which have an impact on a child’s growth. A poor family is much more likely to buy a large amount of cheap, unhealthy food to feed their family, rather than a small amount of nutritious food that will leave them hungry. This inadequate dietary habit re- sults in stunting in child’s growth (Casey, Szeto, Lensing, J.-K. LU ET AL. OPEN ACCE SS Bogl e , & Weber, 2001; Dittus, Hillers, & Beerman, 1995). Fur- thermore, many poor families cannot purchase necessary health care services (Bradley, Kelleher, 1992; Dubay, Kenney, 2001). Family monthly income was high in ascending order of group 1, group 2 and group 3. Therefore, similar mechanisms to previ- ous reports are assumed to have worked on the research popu- lations. Then, the following results are discussed. Although there were strong associations between physiques and group, there were hardly associations between socioeconomic factors and physiques by the ANCOVA in which both socioeconomic fac- tors and groups were taken as independent variables and age was taken as a co var iate. In this study, the education level was high in ascending order of group 1, group 2 and group 3 in both father and mother. Family monthly income was high in ascending order of group 1, group 2 and group 3. Moreover, the occupations with high wages were high in ascending order of group 1, group 2 and group 3, and on the contrary, the occupations with low wages were low in descending order of group 1, grou p 2 and group 3. These facts mean that the factor of group denotes the same tendency of three socioeconomic factors. This is the main rea- son why there were strong associations between physiques and group, but there are hardly associations between physiques and socio economic factors in the ANCOVA. In addition to the socioeconomic factors, there are some other differences among the three groups such as residential area and household registration called Hukou. While the group 1 lives in rural area, th e group 2 and grou p 3 live in urban area. Many studies have showed that there were the differences of physiques between rural and urban areas in China (McLoyd, 1998; Zho u, 2009; Zhang & Wang, 2006; Ma, Wu, & Yang, 2010). Yin compared the physiques of university students between rural origin and urban origin (McLoyd, 1998). The study showed that college students whose birthplaces were in urban areas were taller and heavier than those whose birth- places were in rural areas. The urban-origin students were still bigger than rural-origin ones after the adjustment by gross fam- ily income, family income per capita, latitude, air temperature, precip itation and altitud e. It means th at there are so me differen t factors affecting physiques between rural life and urban one in childhood except for family income and other environmental fac tors. The results, although subjects were university students, are consistent with our findings that group 3 had bigger phy- siques than group 1 and group 2 after the adjustment by the family income. However, there are no previous reports that showed the difference in physiques between rural-origin chil- dren and urban-origin ones after the adjustment by parental educa t ion or oc c upa t i on. In addition to the difference of physiques between ru- ral-origin group and urban-origin group, another important aspect o f the re sults is that group 2 had bigger than group 1 and smaller than group 3. Yang has showed that MPWs’ children have bigger physiques than rural children (Yan, 2005). Zhang reported that MPWs’ children are more likely to be under- weight, anemia and more l ikely to lack access to ad equate den- tal care th an children of citizens in Shan ghai city (Zh ang et al., 2005) Yin XJ showed that MPWs’ children have lower weight than children of citizens in Shanghai city (Yin et al., 2011). Li H reported that the growth and development parameters of most child ren from MPWs were much lower than that of urban chil- dren (Li & Zhou, 2011). Although group 2 and group 3 are living in urban areas, household registration (Hukou) is different in two groups. Group 2 are entitled to none of subsidies in cities from local states due to lack of urban household registration (Solinger, 1999). Besides the issue of registration, developmental history was considered different without doubt, and perhaps lifestyle in Shan ghai was also di fferent (Ma, 2000; Wang, Shen, Liu, 2008 ). These factors are thought linked to the difference of physiques between the groups. How should we substantively examine the differences of physiques between group 1 and group 2? It is clear that the migration must have effectively raised family income in group 2. In fact, the family income of group 2 was higher than group 1. However, the story is somewhat complicated, because the parental education level in group 2 was higher than group 1. Therefore, group 2 was likely to have more income than group 1 prior to migrating. Moreover, the differences in physiques are statistically significant even after the adjustment by income. Taking th ese factors in to con sideratio n, the d ifferences b et ween group 1 and group 2 were probably caused by both the migra- tion and original difference between them, which could not be adjusted by three socioecon omic factors. There are some limitations in this study. First, we could not select subjects from every province where Shanghai city’s MPWs came fro m. We selected Anhu i province as a stu dy area from following reasons: the MPWs in Shanghai city were the largest in number from Anhui province. It might have caused some selection bias in the results. Strictly speaking, the results might reflect the characteristics of Anhui province and sur- rounding areas. Second, although questionnaires were modified to make it easier to understand after pre-survey, a few respon- dents (parents or guardians) did not accurately to fill-out some parts of questionnaire. For example, some respondents did not clearly understand the classification for parental occupation, so they were not able to distinguish their particular occupation. This results in more error when comparing children’s physiques by parental occupation in group 2 than in other groups. Third, there might have been some errors in physical measurement. For instance, even though children were informed to urinate and defecate before physical measurement, some children probably did not follow the guidelines we set forth in the ses- sion prior to taking their physical measurement. Finally, this was cross-sectional desi gned study. It is possible that there have bigger physiques in group 2 than group 1 before they came to Shanghai city from their rural area. It is difficult to infer causa- tion for the association of children’s physiques with the group. Conclusion In summery, we find that physiques of MPW’s child ren wer e smaller th an those of citizens in Shanghai City, and bigger than those of rural residents. There are strong associations between physique and socioeconomic factors. These associations also exist among children whose parents are employed in Agricul- ture and water conservancy labors, are unemployed or produc- tion of transport equipment operators, as they had relatively small physiques. Conversely, children whose parents had higher education had relatively bigger physiques. When family monthly income was higher, those children displayed bigger physiques in all indexes. Whereas, when both socioeconomic factors and group were taken as independent variables, in both sexes, there were strong associations between physique and  J.-K. LU ET AL. OPEN ACCE SS group in all indexes, and there were hardly associations be- tween physiques and socioeconomic factors. Acknowledgement s The cohort study investigators from graduate School of Physical Ed ucation and Health, K University, Shanghai, China. Including: LQ Jia, B Lu, RF Wu, CC Zhang, JH Wu, Q Guo, JJ Liu. REFERENCES Alaimo, K., Olson, C. M., Frongillo, E. A., & Briefel, R. R. (2001). Food insufficiency, family income, and health in US preschool and school-aged children. Ame rica n Journal of Public Health, 91, 781- 786. http://dx.doi.org/10.2105/AJPH.91.5.781 Bogin, B., Smith, P., Orden, A. B., Varela Silva, M. I., & Loucky, J. (2002). Rapid change in height and body proportions of Maya Ame- rican children. America n Jour n al o f H uman B i o l ogy, 14, 753-761. http://dx.doi.org/10.1002/ajhb.10092 Bogin, B, et al. (2002). Rapid change in height and body proportions of Maya American children. American Journal of Human Biology, 14, 753-761. http://dx.doi.org/10.1002/ajhb.10092 Belsky, J., Bell, B., Bradley, R. H., et al. (2007). Socioeconomic risk, parenting during the preschool years and child health age 6 years. Eur op ean Jo urnal of P ub l i c He alth, 17, 508-513. http://dx.doi.org/10.1093/eurpub/ckl261 Black, D., Morris, J. N., Smith, C., Townsend, P., & Whitehead, M. (1988). Inequalit ies in he al th: The Black report. London: Penguin. Bornstei n, M. H., Hahn, C. S., Suwalsky, J. T. D., & Haynes, O. M. (2003). Socioeconomic status, parenting and child development: The Hollingshead Four-Factor Index of Social Status and the Socioeco- nomic Index of Occupations. Mahwah, NJ, 29-82. Boyle, M. H., Racine, Y., Georgiades, K., et al. (2006). The influence of economic development level, household wealth and maternaledu- cation on child health in the developing world. Social Science & Med icine, 63, 42-54. Brooks-Gunn, J., & Duncan. G. J. (1997). The effects of poverty on children. Future Child, 7, 55-71. http://dx.doi.org/10.2307/1602387 Bradley, R. H., & Kelleher, K. J. (1992). Childhood morbidity and mortality: The growing impact of social factors. Presented at Con- ference Social Science Health Policy: Building Bridges between Re- sea rch and Action, Was hington, DC. Chen, X. R., et al. (2010). An investigation on health condition and spo rts beha vior o f pea san t work ers i n Pea rl Ri ver D elta . C hina S po rt Science, 30, 11-21. (Chinese) Chen, C. M., et al. (2006). The changes of the attributable factors of child gr owth. Journal of Hygiene Research, 35, 765-768. (Chin es e) Chen, Q. (2001). Associ ati on of ph ysique wit h envi ron ment al fa ctors in children in Hangzhou City. Chinese Journal of School Health, 22, 339-340. (Chinese) Chen, J. (2001). Associations of children’s development with environ- mental factors in Hangzhou city. Chinese Journal of School Health, 22, 339-340. (Chin ese) Casey, P. H., Szeto, K., Lensing, S., Bogle, M., & Weber, J. (2001). Children in food insufficient low-income families: prevalence, health and nutrition status. Archives of Pediatrics & Adolescent Medicine, 155, 508-514. http://dx.doi.org/10.1001/archpedi.155.4.508 Desai, S., & Alva, S. (1998). Maternal education and child health: Is there a strong causal relationship? De mography, 35, 71-81. http://dx.doi.org/10.2307/3004028 Dittus, K. L., Hillers, V. N., & Beerman , K. A. (1995). Benefits and barriers to fruit and vegetable intake: relationship between attitudes and consumption. Journal of Nutrition Education, 27, 120-126. http://dx.doi.org/10.1016/S0022-3182(12)80802-8 Dubay, L, & Kenney, G. (2001). Health care access and use among low-income children: Who fairs best. Health Aff ai rs, 20, 112-121. http://dx.doi.org/10.1377/hlthaff.20.1.112 Frisancho, A R. (1981). New norms of upper limb fat and muscle areas for the assessment of nutritional status. American Jour nal o f Clin ical Nutrition, 34, 2540-2545. Fredriks, A. M., Buuren, S., Jeurissen, S. E. R., et al. (2004). Height, weight, body mass index and pubertal development references for children of Moroccan origin in The Netherlands. Acta Paediatrica, 93, 817-824. Geltm an, P. L., Radin, M., Zhang, Z., Cochran, J., & Meyers, A. F. (2001). Growth status and related medical conditions among refugee children in Massachusetts. American Journal of Public Health, 191, 1800-1805.http://dx.doi.org/10.2105/AJPH.91.11.1800 Guarnaccia, P., & Lopez, S. (1998). Mental health and adjustment of immigrant and refugee children. Child Adolescent Psychiatric Clin- ics of Nor t h Am e ric a, 7, 537-553. Glew, R. H., Brock, H. S., et al. (2004). Lung function and nutritional status of semi-nomadic Fulani children and adolescents in Northern Nigeria. Journal of Tropical P ediatrics, 50, 20-25. http://dx.doi.org/10.1093/tropej/50.1.20 Garnier, D., N dia ye , G., & B enefice, E. (2003). Influence of urban mig- ration on physical activity, nutritional status and growth of Senegal- ese adolescents of rural origin. Bulletin de la Société de Pathologie Exotique, 96 , 223-227. Hu, X P. (200 4). Going out for a non-farming job: An effective wa y to inc rease farmers’ income. Issues in Agricultural Economy, 24, 63-66. (Chinese) http://www.stats.gov.cn/tjfx/jdfx/t20120120_402780174.htm Hernandez, D. J. (2004). Demographic change and the life circum- stances of immigrant families. Fut ure Ch i l d, 14, 17-45. http://dx.doi.org/10.2307/1602792 Huang, Z. J., Stella, M. Y., et al. (2006). Health status and health ser- vice access and use among children in US immigrant families. American Journal of Public Health, 96, 634-640. http://dx.doi.org/10.2105/AJPH.2004.049791 http://www.stats.gov.cn/tjfx/jdfx/t20110428_402722253.htm http://en.wikipedia.org/wiki/Anhui http://en.wikipedia.org/wiki/Shanghai http://www.moh.gov.cn/publicfiles/business/htmlfiles/wsb/pzcjd/20080 4/21290.htm http://www.cdc.gov/nchs/nhis/quest_data_related_1997_forward.htm#2 012_NHIS http://www.maine.gov/education/sh/heightandweight/heightweight.pdf. Halld or sson, M., Kunst, A., Kohler, L., & Mackenbach, J. P. (2000). Socio-economic inequalities in the health of children and adolescents —A c omparati ve study of the five Nordi c countries. European Jour- nal of Public Health, 10, 281-288. htt p://d x.doi.org/10.1093/eurpub/10.4.281 Hervey, K., Vargas, D., Klesg es, L., Fischer, P. R., Tri ppel, S., & Juhn, Y. J. (2009). Overweight among refugee children after arrival in the United States. Journal of Health Care for the Poor and Underserved, 20, 246-256. http://dx.doi.org/10.1353/hpu.0.0118 Kuh, D. L., Power, C., & Rodgers, B. (1991). Secular trends in social class and sex differences in adult height. International Journal of Epi- demi o l o gy, 20 , 1001-1009. http://dx.doi.org/10.1093/ije/20.4.1001 Li, H., & Zhou, B. S. (2011). The cross-sectional investigation on growth and development of children aged eight to eleven from migra nt workers’ family in Shenyang City. Journal of Chin a Medi cal Unive r- sity, 40 , 1049-1051. Ma, C. J. (2008). Analysis of influencing factors and physical health condition of migrant peasant workers in Henan province. Journal of Anhui Agriculture Science, 36, 4719-4720. Mirza, N. M., Kadow, K., Palmer, M., Solano, H., Rosche, C., & Ya- novski, J. A. (200 4 ). P revalenc e of over wei ght a mon g inn er ci t y His- panic-American children and adolescents. Obesity Resarch, 12, 1298- 1310. Morton, B., Hou, F., Hyman, I., & Tousignant, M. (2002). Poverty, family process and the mental health of immigrant children in Cana- da. American Journal of Public Healt h, 92, 220-227. http://dx.doi.org/10.2105/AJPH.92.2.220 McBride, B. A. (1990). The effects of a parent education/play group program on father involvement in child rearing. Family Relations, 39, 250-256. http://dx.doi.org/10.2307/584868  J.-K. LU ET AL. OPEN ACCE SS Mahoney, G., Kaiser, A., Girolametto, L., MacDonald, J., Robinson, C., Safford, P., & Spiker, D. (1999). Parent education in early interven- tion: A call for a renewed focus. Topics in Early Childhood Special Education, 19, 131-140. http://dx.doi.org/10.1177/027112149901900301 McLoyd, V. C. (1998). Socioeconomic disadvantage and chi ld develop- ment. American Psychologist, 53, 185-204. http://dx.doi.org/10.1037/0003-066X.53.2.185 Ma, S., Wu, S. X., & Yang, Z. (2010 ). Ana lysis of gro wth and develop- ment of urban and rural students in Beijing. Chinese Journal of Scho o l He alth, 32 , 1296-1299. Ma, D. F. (2000). Marginalized migrant peasant worker in cities . Youth Stud ies, 29 , 19-22. NICHD Early Child Care Research Network. (1998). Relations between family predictors and child outcomes: Are they weaker for children in chi l d care? Developmental Psychology, 34, 1119-1128. http://dx.doi.org/10.1037/0012-1649.34.5.1119 Ortega, A., Fang, H., Perez, V. H., Rizzo, J. A., Ca rter-Pokras, O., Wal- lace, S. P., & Gelberg, L. (20 07). Hea lth care a ccess, u se of servic es and experiences among undocumented Mexicans and other Latinos. JAMA Int ernal Medic ine, 167, 2354-2360. http://dx.doi.org/10.1001/archinte.167.21.2354 Parke, R. D., Co ltrane, S., Duffy, S., Bu riel, R., Denni s, J., P owers , J., French, S., & Widaman, K. F. (2004). Economic stress, parenting, and child adjustment in Mexican American and European American families. Child D evelopment, 75, 1632-1656. http://dx.doi.org/10.1111/j.1467-8624.2004.00807.x Rona, R. J., & Chinn, S. (1991). Father’s unemployment and height of primary school children in Britain. Annals of Human Biology, 18, 441-448. http://dx.doi.org/10.1080/03014469100001742 Solinger, D. (1999). Contesting citizenship in urban China. Peasant migrants, the state, and the logic of the market. Berkeley, CA: Uni- versity of California press. Mohanty, S. A., Woolhandler, S., Himmelstein, D. U., Pati, S., Carras- qu illo, O., & Bor, D. H. (2005). He alth care expe nditur es of im m ig r ants in the United States: A nationally repre-sentative analysis. American Journal of Public Health, 95, 1431-1438. http://dx.doi.org/10.2105/AJPH.2004.044602 Slesinger, D. P., Christenson, B. A., & Cautley, E. (1986). Health and mortality of migrant farm children. Social Science & Medicine, 23, 65-74. http://dx.doi.org/10.1016/0277-9536(86)90325-4 Stamatakis, E., Wardle, J., & Cole, T. J. (2 010). Ch ildhood obesit y and overweight prevalence trends in England: Evidence for growing so- cioecon omic dispa rities. Inte rnational Jou rnal of Obe sity, 34, 41-47. http://dx.doi.org/10.1038/ijo.2009.217 Shi, J. X. et al. (2011). Analysis on physique among aged 3 to 6 year old childrenin Xiamen City. Chinese Journal of School Health, 32, 1378-1379. State Statistic Bureau. (2010). The Monitoring Survey Report of Migrant Peasant Workers in 2009. Beijing: State Statisti c Bur e au. Thomas, D., Strauss, J., & Henriques, M. H. (1991). How does mother’s education affect child height. The Journal of Human Resources, 26, 183-211. http://dx.doi.org/10.2307/145920 uxin, et al. (2007). Analysis and forecast o n China ’ s s ocia l devel opment. Beijing: Social Sciences Academic Press. Wil l, B., Zeeb, H., & Baune, B. T. (2005). Overweight and obesity at school entry among m igrant and German children: A cross-sectional study. BMC Public H ealth, 5, 45. http://dx.doi.org/10.1186/1471-2458-5-45 Waterlow, J. C., Buzina, R., Keller , W., Lane, J. M., Nichaman, M. Z., & Tanner, J. M. (1977). The presentation and use of height and weight dat a for com parin g th e nut ri tiona l statu s of grou p s of c h ild ren under the age of 10 years. Bul letin of t he World Health Organ ization, 55, 489-498. Weinreb, L., Goldberg, R., & Perloff, J. (1998). Health characteristics and medica l services pattern s of shelt ered homel ess an d low inc ome housed mo thers . Journal of General Internal Medicine, 13, 389-397. http://dx.doi.org/10.1046/j.1525-1497.1998.00119.x Wang, F., & Zho u, X. (2012). Family—Related factors affecting child health in China. Population Research, 36, 50-59. Wang, G. X., Shen, J. F., & Liu, J. B. (2008). Citizenization of peasant migrants during urbanization in China—A case study of Shanghai. Population & Development, 15, 70-95. Xiong, Y. H. (2010). Bottom layer, the school and class reproduction. Open Times, 29, 94-110. Yan, Z. (2005). Comparison of health and behavior in migrant peasant worker’s childre n. Hangzhou: Zhejiang University. Yin, X. J. et al. (2011). C omparative study of physical fitness between migrant workers’ school children and those of the Shanghai natives. Journal of C heng d u Spor t Un i v e rs ity, 37, 66-69. Yu, S. M., Huang, Z. J., & Singh, G. K. (2004). Health status and health services utilization among US Chinese, Asian Indian, Filipino, and other Asian/Pacific Islander children. Pediatrics, 113, 101-107. http://dx.doi.org/10.1542/peds.113.1.101 Yin, X. J., Huang, C. Q., Chen, H. M., & Tanaka, T. (2005). Associa- tion s of physique with socioeconomic fa ctors of fa mily and region al origin in Chinese university students. Environmental Health and Pre- ventive Med ici n e, 10, 190-200. http://dx.doi.org/10.1007/BF02897710 Zhang, Z. S. et al. (2005). The health status and common disease among migrant peasant worker’s children in primary school of Chang Nin district in Shanghai. Shanghai Journal of Prevention Medicine, 17, 70-71. Zhou, G. M. (2009 ). A comparative study on the physiques of children in rural and urban Guiyang. Journal of Gui Zhou University for Eth- nic Minorities (Philosophy and Social Sciences), 29, 157-159. Zhang, Y. M. , & Wa ng, Z. (2006). Invest igat ion of c onstituti on stat e of three- to six-year-old children in urban and rural areas of Wei Fang city. Chinese Journal of Tissue Engineering Research, 10, 13-15.
|