 Creative Education 2014. Vol.5, No.1, 18-30 Published Online January 2014 in SciRes (http://www.scirp.org/journal/ce) http://dx.doi.org/10.4236/ce.2014.51006 OPEN ACCESS The Effect of Activity-Based Teaching on Remedying the Probability-Related Misconceptions: A Cross-Age Comparison Ramazan Gürbüz1, Emrullah E rdem1, Selçuk Fırat2 1Department of Elementary Mathematics Education, Faculty of Education, Adıyaman University, Adıyaman, Turkey 2Departme nt of Computer Education and Instructional Technology, Faculty of Education, Adıyaman University, Adıyaman, Turkey Email: rgurbuz@outlook.com, eerdem@outlook.com, sfirat02@gmail.com Received November 14th, 2013; revised December 14th, 2013; accepted December 21st, 2013 Copyright © 2014 Ramazan Gürbüz et al. This is an open access articl e d istrib uted u nd er the C reative Commons Attribution License, which pe rmits unrestricted use, distrib ution, and reprodu ction in any medium, provided the original work is properly cited. In accordance of the Creative Commons Attribution License all Copyrights © 2014 are reserved for SCIRP and the o wner of the intellectual property Ra mazan Gürbüz et al. All Copyright © 2014 are guarded by law and by SCIRP as a guardian. The aim of this paper is to compare the effect of activity-based teaching on remedying probability-related misconceptions of students at different grades. Thus, a cross-sectional/age study was conducted with a to- tal of 74 students in 6th-8th grades. Experimental instructions were given to all the groups three times/ week, 40 min/session, for 2 weeks. Students’ progress was examined by pre-test and post-test mea- surements. The results of the analysis showed that, as a result of the intervention, all graders’ post-test scores regarding all the concepts (PC: Probability Comparison, E: Equiprobability and R: Representa- tiveness) showed a significant increase when compared to pre-test scores. It was found out that this increase did not create a significant difference based on age in PC concept, but that in 8th grade students, it showed a significant difference in E and R concepts compared to 6th graders. On the other hand, it was also assessed that the increases observed between 7th and 8th graders with regard to E and R concepts were not significant. In summary, the implemented intervention can be suggested to have different effects depending on age and the concept. Keywords: Activity-Based Teaching; Misconception; Probability; Cross-Age Introduction The term “probability learning” is associated with a specific experimental paradigm within which a person is presented with a succession of trials on each of which one of two outcomes is possible and, on each trial, is required to predict which will happen before showing the outcome (Greer, 2001). Probability starts at early ages (3 - 5 ages) by comparing two events quantitatively, and at these ages children are unlikely to calcu- late the probability of an event. However, they may also reflect on some events and make some unintentional predictions, such as “highly probable” or “hardly probable”, “or not equally probable”. Fischbein (1975) suggested that “when, without special instructions, the probabilities of the responses approxi- mate the probabilities of the events, it is possible to assume that the subject possesses a particular intuition of chance and pro- bability”. Children, as they grow older, tend to carry out evalu- ations based on more scientific and numerical calculations, by putting aside intutional evaluations in calculating and compar- ing the probability of events. It is believed that during the trans- formation of these evaluations, strategies employed in teaching probability concepts are important. Activity-based strategies must be used, especially during phases when they first confront probability concepts in formal education. In this sense, Shau- ghnessy (1977) emphasizes that employing activity-based teaching is important in providing meaningful learning and in remedying the students’ misconceptions of probability. Misconceptions and Probability One of the most significant factors impeding the comprehen- sion of a subject is misconception. Misconception is defined as perceptions or conceptions which are far from the meaning agreed upon by the experts (Zembat, 2008) or as the perceptions that are diverging from the view of experts in a field or subject (Hammer, 1996). For the past 30 years or so, scholars have studied students’ misconceptions regarding mathematics. Studies have shown that students’ conceptions of scientific issues are often not in line with accepted scientific thinking; that is, they have misconceptions regarding various notions. Fast (2001), Gürbüz (2007) and Shaughnessy (1977) suggested that some misconceptions in probability stem from the nature of the subject or the pupils’ prior theoretical pro- bability knowledge. Hammer (1996) pointed out that miscon- ceptions affected students’ perceptions and understandings. Mis- conceptions make it difficult to understand the subject of prob- ability. Indeed, many studies were conducted about the mis- conceptions in teaching mathematics in general, and specifical- ly in the subject of probability (Barnes, 1998; Batanero & Ser- rano, 1999; Bezzina, 2004; Dooren, Bock, Depaepe, Janssens, & Verschaffel, 2003; Fast, 1997, 2001; Fischbein, Nello, & Marino, 1991; Fischbein & Schnarch, 1997; Garfield & Ahlgren, 1988; Kahneman & Tversky, 1972; Lecoutre, 1992; R. GÜRBÜZ ET AL. OPEN ACCESS Mevarech, 1983; Morsanyi, Primi, Chiesi, & Handley, 2009; Polaki, 2002; Shaughnessy, 1977). Some Types of Misconceptions Representativeness Heuristic When people make guesses about the outcomes of an expe- riment, they decide about the representativeness of these out- comes by examining them in certain ways. For example, when people are asked about the set of outcomes that can be obtained in an experiment of rolling a die several times successively, they’re inclined to think that the chances of heads and tails are equal and the distribution is random (Amir & Williams, 1999; Shaughnessy, 1977). Similarly, Tversky and Kahneman (2003) states that “after observing a long run of red on the roulette wheel, most people erroneously believe that black is now due, presumably because the occurrence of black will result in a more representative sequence than the occurrence of an additional red” (p. 207). They also claim that people expect that a sequence of events generated by a random process will represent the essential characteristics of that process even when the sequence is short. In considering tosses of a coin, for example, people regard the sequence HTHTTH (H: Head; T: Tail) to be more likely than the sequence HHHTTT, which does not appear random, and also HHHTTT more likely than the sequence HHHHTH, which does not represent the fairness of the coin. Positive and Negative Recency Positive recency misconception is the belief that the outcome obtained from successive experiments will re-occur in future trials. Negative recency misconception is, on the other side, the belief that the outcome obtained from successive experiments will not occur in future trials. For example, in an experiment of tossing a coin successively five times and obtaining 5 times heads repeatedly, the belief that the next trial will also result in a heads is another example for positive recency effect, just as the belief that the next trial will result in a tails is known as the negative recency effect. Equiprobability Bias This is the belief that the probabilities of the outcomes of an experiment are equal although, in fact, they are not. Jun (2000) showed a different approach and put the equiprobability bias in three categories. These categories are: a) thinking that each n different probable outcomes have 50% probability b) thinking that each outcome has a probability of 1/n c) thinking that the probabilities of n possible outcomes are all equal if they, in fact, have similar probabilities. For example, a random selection is made in a farm containing 100 sheep and 250 goats. Thinking that the probabilities of choosing a sheep or a goat are equal is an example of Type (a). In another experiment of rolling to- gether two dice designed as (123 456) and (222 333); thinking that the sum of possible outcomes would be equal is an exam- ple of Type (b). In another experiment of randomly selecting a student from a class of 20 boys and 25 girls, thinking that the probabilites of the outcome to be a girl or boy to be equal is an example of Type (c). Activity-Based Teaching (ABT) Activities are defined as tools that help in creating links be- tween mathematical structures, increasing mathematical power, and constructing mathematical knowledge and visual illustra- tions of verbal knowledge (Moyer, Bolyard, & Spikell, 2002). Piaget (1952) claims that activities should be used in teaching mathematics due to the fact that mentally immature students cannot understand mathematical concepts. The activities that are designed to concretize and present the mathematical ex- pressions clearly help students think creatively and develop their worlds of imagination (Thompson, 1992). Through activi- ties, students will have the opportunity to learn in a more flexi- ble environment, in collaboration with their peers and will be engaged in active learning. In parallel, Shaw (1999) states that he agrees with the educators who claim that students should not be passive when they build the knowledge. Using activities during the learning process necessitates active participation of students. In an activity-based learning process, students move from an understanding of getting knowledge directly towards reaching knowledge, discussing to internalize this knowledge and con- structing new knowledge through this discussion. This argu- mentation and constructing process helps students learn togeth- er, express thei r ideas easily, explain and justify their reasoni ng, and develop mathematical language. Having a learning envi- ronment where students argue with each other about valid ar- guments in mathematics could be the core of mathematics teaching (Sfard et al., 1998). Thus, it can be said that students’ argumentation plays an important role in the occurrence of such positive effects in the learning process of probability concepts. Aspinwall and Shaw (2000) state that the activities allow stu- dents to make productive arguments about the concepts such as data, chance and fair and help in developing students’ intui- tions. This process offers a learning environment where students construct the knowledge by sharing their ideas with each other. It can be said that through such a learning environment, stu- dents correct each other’s mistakes with the help of their friends and with the help of the instructor. This interaction among stu- dents shows the importance of activity-based teaching in these environments. It can also be stated that through argumentation between instructor-student and student-student, the instructor had the opportunity to learn about the students’ thinking and misconceptions. In sum, by presenting a flexible and reliable learning environment through active participation of students, activi ty-based teaching creates a practice-based discussion en- vironment, contributes to students’ math language and reason- ing skills and helps students overcome misconceptions. Literature Review Regarding Probability (Cross-Age Comparison) Since prehistoric times, people have faced random physical events, e.g. unpredictable natural events and games of chance, but the birth of probability theory and its turning into a branch of mathematics did not occur until the middle of the 17th century. Probability as a subject started to appear in school curricula after the 19th century and since then, cognitive psy- chologists and mathematics educators have examined students’ misconceptions concerning probability in different age groups (Batanero & Serrano, 1999; Bezzina, 2004; Dooren et al., 2003; Fast, 2001; Fischbein et al., 1991; Fischbein & Schnarch, 1997; Garfield, & Ahlgren, 1988; Gürbüz, Birgin, & Çatlıoğlu, 2012; Kahneman & Tversky, 1972; Konold et al., 1993; Lecoutre,  R. GÜRBÜZ ET AL. OPEN ACCESS 1992; Morsanyi et al., 2009; Offenbach, 1964; Pratt, 2000; Watson & Kelly, 2004; Watson & Moritz, 2002; Weir, 1962). For example, Weir (1962) did a study to reveal how three dif- ferent instructional practices based on the same material af- fected pupils’ learning in age groups 5 - 7 and 9 - 13. As a re- sult of the analysis, it was determined that: a) younger pupils preferred tips and encouragement more than older pupils, b) older pupils changed their initial answers after receiving tips more than younger pupils, c) different instructional practices had no effect on pupils’ selection of situations or choices on which hints were given, d) it was harder in older pupils to overcome prejudices. So, it was concluded that the pupils’ pre- judices or prior knowledge played an important role in their decisions about chance or probability concepts. Offenbach (1964), who conducted a study in order to determine the effect of carrot and stick (or reward and punishment) on a total 60 students’ (30 of preschoolers and 30 of 4th graders) guessing more frequent event, found that the correct guessing ratios of both preschoolers and 4th-graders in all groups were almost equal, and the difference was only in their strategies. As the age increased, students were observed to make rule-based predic- tions. Fischbein et al. (1991) found out that the more students’ learning level increases, the more the percentage of correct answers increases. However, it was also found that as learning level increases, concept mistakes also increase, yet in some it decreases. Fischbein and Schnarch (1997), who explored the changes in misconceptions of 5th, 6th, 7th, 9th, and 11th graders and college students who had not been educated in probability, reported that an increase in the students’ education level variably decreased or increased or did not change their misconceptions about some concepts. Batanero and Serrano (1999) conducted a study with 277 pupils aged between 14 and 17 in Spain in order to investigate how the meaning given to the concept of “randomness” by the pupils changed with age. It was revealed that age was not important in understanding the concept of “randomness”; it is a hard concept to understand and, in order to master it well, it is essential to understand many other probability concepts, such as sample space, probability of an event, probability comparisons and so on. Watson and Mo- ritz (2002) conducted a study to investigate the development of pupils in answering questions regarding the probability of a single event, compound events and conditional events. As a result of the evaluations, when the ratio of groups’ correct an- swers to the questions related to conditional probability was compared, it was found that the percentage of correct answers increased with the level of education. However, no correlation was found between the level of education and the ratio of cor- rect answers to the questions related to the probability of com- plex events. Dooren et al. (2003), who compared misconcep- tions in 10th and 12th graders, implied that there was no significant difference between the groups despite an increase in the level of education decreasing their misconceptions. Watson and Kelly (2004), who used a test based on a spinner divided into two identical parts (50 - 50) to determine 3rd, 5th, 7th and 9th graders’ understanding of statistical variation in a chance setting, identified that there was a steady increase in conceptual development in the whole process at 3rd, 5th, and 9th grades, but not for 7th grade. Gürbüz et al. (2012), who compared the probability-related misconceptions of 540 pupils in 5th-8th grades, found that the percentage of correct answers increased when the level of education increased, whereas the misconcep- tions about the concept of compound events I decreased, the percentage of correct answers decreased and the misconcep- tions about the concept of compound events II increased. It was also found that in concepts of probability of an event and probability comparisons, as the level of education increased, both the percentage of correct answers and the misconceptions increased. Probability concepts are widely used in decision-making processes related to uncertain situations we encounter in our daily lives. In spite of this importance, due to several reasons, probability concepts are not being taught as effectively in Tur- key as it is in many other countries. The most important reason that the subject of probability is not taught effectively is the existence of this subject-related misconception. The reviewed literature showed that students’ errors or misconceptions varied depending on age and level of education. This study aims at comparing and evaluating the effect of activity-based teaching on remedying the misconceptions of students at different grades (6, 7, 8) and ages (12 - 14) regarding some concepts (Probabil- ity Comprasions-PC, Representativeness-R, Equiprobability-E) in probability subject. Method Research Design To determine students’ conception in relation to their grade and understanding, cross-age and longitudinal studies are ge- nerally used. Despite the fact that the cross-age research in- volves different cohorts of students, it is more applicable than the longitudinal study when time is limited (Abraham, Wil- liamson, & Westbrook, 1994). In these types of studies, moni- tored groups are few but detailed and comprehensive know- ledge can be obtained. Also, cross-age studies do provide an opportunity to observe shifts in concept development as a consequence of students’ maturity, an increase in intellectual development, and further learning. Parti cipants This study was conducted with a total of 74 pupils (aged 12 - 14) studying in a primary school in the Southeastern Region of Turkey. The students participating in the study generally come- from low- or middle-level socio-economic classes (based on the opinions of the school principal and teachers). The school of study is located in the province center. Table 1 shows the grades, ages and class sizes of students in the study group. Procedure All of the student groups in the sample had previously been given a formal education in the subject of probability. Before the teaching intervention, the Misconception Test (MT) was Table 1. The distribution of the students in the study group according to grade and age. Grade 6th grade 7th grade 8th gra de Age 12 13 14 Class Size (n) 23 24 27 (%) 31.08 32.43 36.48 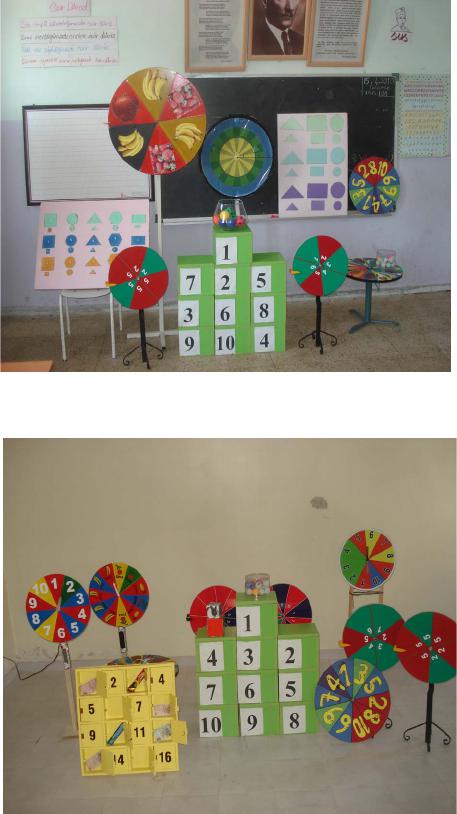 R. GÜRBÜZ ET AL. OPEN ACCESS administered to all groups as a pre-test. All groups were en- couraged to answer all questions. The subject of probability was instructed in all groups (6, 7 and 8) with the same strategy (activi ty-based teaching) and by the same instructor. The implementations were carried out with 3- or 4-student groups. Thus, more communication and discussion took place. The six sessions, each lasting 40 minutes, were planned for the instruc- tions of the concepts. During these sessions, conceptual questions that were designed to stretch students’ thinking to a higher level were asked to the students. These included ques- tions such as “What strategy did you use to obtain you’re an- swer?”, “Why, or Why not?” After the intervention, the MT was administered to all groups as a post-test. Data Collect ion In order to collect data, students’ answers to pre- and post- tests related to each concept and the argumentation among the students in groups were used. Students’ answers to pre- and post-tests were taken as a basis in order to determine whether their misconceptions regarding the concepts Probability Com- parisons (PC), Representativeness (R) and Equiprobability (E) were remedied or not. Instrumentation The MT consisting of 12 questions (sample questions are presented in Appendix) was a two-tier question that consisted of a multiple-choice portion and an open-ended response. Some of the questions were developed by the researchers, and some of them were developed with the help of related literature (Baker & Chick, 2007; Fischbein et al., 1991; Kahneman & Tversky, 1972; Nilsson, 2009; Tatsis, Kafoussi & Skoumpourdi, 2008; Watson & Kelly, 2004). This test measures students’ conceptions of three principal concepts, each of which involved 4 questions. The validity of the test was confirmed by two mathematics teachers and two mathematics educators. Further- more, the pilot test was performed with 120 6th, 7th and 8th graders who did not participate in the real study. The admini- stration of the pilot study took one class-hour (40 minutes). The pilot study revealed that questions on probability subject were understandable and clear for all grade levels. In this study, the Kuder-Richardson formula 20 (KR-20) reliability coefficient of the instrument was found as 0.85. Activitie s and Materials The activities used throughout the process of intervention were implemented in the same format and with the same strate- gies at all grade levels. The details of these activities are pre- sented below: One of the activities undertaken during the intervention process was the “Which Spinner?” activity. This activity was carried out using spinners A and B (see Figure 1). Spinner A has 4 identical red parts and 2 identical green parts. Among these six identical parts, two parts were numbered as 2 and four parts were numbered as 5. On the other hand, Spinner B has 2 identical red parts and 4 identical green parts. These identical parts are numbered as 1, 2, 3, 4, 5, and 6 respectively. Before and after the spinners were turned, the teacher asked the stu- dents questions such as, “Which of the spinners is more likely to stop in a red area?”, “What is the relationship between the probabilities of spinner A to stop in a red area and spinner B to stop in a green area?, Why?”, “Are the probabilities of both spinners A and B to stop in the area numbered as 5, equal?” The teacher tried to obtain the full participation of the students. The students turned the spinners with a variety of designs as shown in Figure 2 many times, and the teacher helped to deepen the discussion environment by directing them in similar questions as shown above. Another activity was the “Which Number” activity. In this activity, a material which had 16 tip up parts numbered from 1 to 16 respectively and each part had an area of 1 m2 was used as given in Figure 2. Different amounts and frequency of points or chocolates were hidden in some places of this material. Some places were left without any reward. The scores written on the parts of the material, the number and frequency of choc- olates and blank parts on the materials were written on the board, but these amounts were changed at the beginning of each activity. The groups were asked different questions about these materials. For example “A randomly opened box will be more likely to be full or empty?”, “In a randomly opened box, will the content more likely be a chocolate, or a score?”, “What is the Figure 1. Materials and reflections from the teaching process. Figure 2. Materials and reflections from the teaching process. 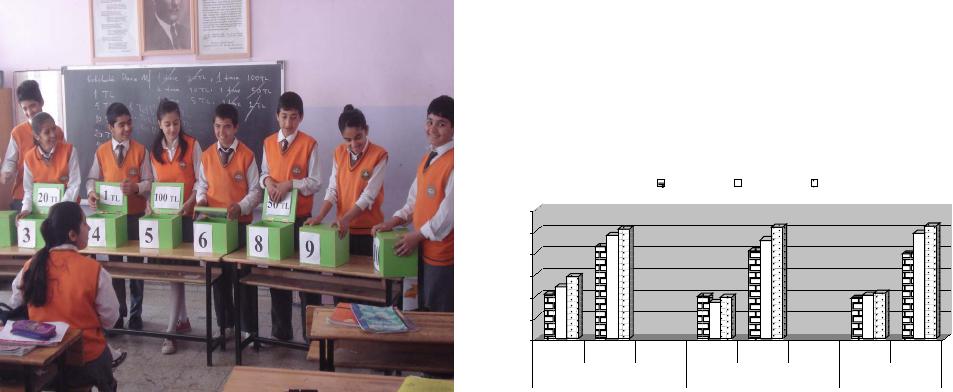 R. GÜRBÜZ ET AL. OPEN ACCESS probability of a randomly opened box to be empty?” In this pro- cess, a group receives whatever comes out from the randomly opened box, either a chocolate, or a score. However, if an emp- ty box is chosen, then this group is left out from the activity. Another activity used in this process is the activity of “Roll- ing Dice”. For this activity, the researchers brought the class several dice designed in different forms (for example; 123 456, 111 444, 44 6666, or 123 455). The instructor first distributed these dice to the students and wanted them to do many experi- ments (50, 70, 100), to note the results of these experiments and to discuss these records. Then, the teacher transferred the records of all groups onto the board and enabled them to see the results of their experiments. The groups were asked to discuss these results and their ratios among themselves and by asking questions such as, “Compare the ratios of the results obtained from the 123 456 die with those obtained from the 123 455 die”, “Compare the ratios of the results obtained from the 111 444 die with those obtained from the 44 6666 die.” The last activity was “Deal or No Deal?” activi ty. After a short question-answer episode, the content of the activity was briefly explained to the students. If we want to explain the content of the activity here briefly, there are 10 boxes labeled with numbers between (1 - 10), as in Figure 3, and different amounts of money (1 TL, 5 TL, 10 TL, 10 TL, 20 TL, 20 TL, 20 TL, 50 TL, 100 TL) were put in these boxes. The amounts of money and their frequencies were altered at the beginning of every game. These amounts of money were put in an ascending order on the board in a way all students can see, and the fre- quency of each amount was indicated on the side. When the im- plementation process initiated, students competed to participate. Although all the class participated in the process, 10 students competed on the board beside the boxes, and one student took part as the single contestant. While all boxes were closed, the contestant picked the number of the box he wanted to be opened and then wanted the help of his/her friends on predic- ting the amount of money inside the box. His/her friends tried to uncover the contestant’s thoughts by asking questions such as, “Why thi s bo x? ” After obtaining the thoughts of all the class, the contestant decided that either the box would be opened, or it Figure 3. Materials and reflections from the teaching process. would be changed. The teacher organizing this process as a conductor asked students several questions before each box was opened, for example, “Which amount of TL has the highest pro- bability as an outcome?”, “Which amount of TL has the lowest probability as an outcome?”, “What’s the probability of picking 100 TL”, “Which amounts of TL have the same probability?”, “Do you think the skills of the player have anything to do with winning the game? Why?” A similar process went on until all boxes had been opened, and from time to time, by considering the amounts of money in the unopened boxes, different offers were made to the contestant. If the contestant accepted the offer, the game ended, but if not, the game continued until all boxes were opened. The contestants beside the boxes and the single contestant were changed every time and all the class was given the opportunity to participate in the activity. Data Analysis In analyzing the data, students’ answers were classified in rega rd to the le vels in Table 2. Since two external mathematics educators who had experience in analyzing qualitative data initially categorized the data separately, they discussed the consistency of the categorization. There was high agreement, approximately 90%, in most of the categorization. All dis- agreements were resolved by negotiation. The assessment test consisted of two phases (1st phase multiple choice, 2nd phase open-ended), and, therefore, the assessment criteria also con- sisted of two phases. In this paper, the following symbolism is used for indicating the grade to which the quoted subjects belong: G6 means Grade 6, just as G followed by 7 or 8 in- dicates the respective grade. Each group’s total score was calculated and inputted into SPSS, and statistical comparisons were made in terms of the misconception level of groups. Two-way repeated measures ANOVA was employed to compare pre-test scores with post- test scores in each concept in MT. Results and Discu ssion Results of pre-test and post-test of the groups regarding MT were presented in Table 3 and Figure 4. One-way ANOVA was carried out in comparing the pre- and post-test results of the groups. The one-way ANOVA test was used to compare groups’ scores regarding MT in pretest. As shown i n Table 4 , a signifi- cant difference was found between groups’ pre-test scores rela- ted to PC [F (2 - 68) = 8.693, p < 0.01], and it was revealed that this difference was (Mean difference = 0.42572, p < 0.01) age; Figure 4. Pre-test and Post-test scores of the groups on PC, E, and R concepts. 0,00 0,50 1,00 1,50 2,00 2,50 3,00 Pre-test Post-testPre-test Post-testPre-test Post-test PC E R 6t h Grade  R. GÜRBÜZ ET AL. OPEN ACCESS Table 2. The rubric developed and used for MT and students’ sample responses to them. Comprehension Levels Explanation SCORE Assessment Criteria 1st –2nd Phase Sample Response Correct Justification Answers that encompass all aspects of the valid justification 3 Correct Answer Correct Justification 1 2 3 4 5 6 1 (1,1) (1,2) (1,3) (1,4) (1,5) (1,6) 2 (2,1) (2,2) (2,3) (2,4) (2,5) (2,6) 3 (3,1) (3,2) (3,3) (3,4) (3,5) (3,6) 4 (4,1) (4,2) (4,3) (4,4) (4,5) (4,6) 5 (5,1) (5,2) (5,3) (5,4) (5,5) (5,6) 6 (6,1) (6,2) (6,3) (6,4) (6,5) (6,6) PC 2: In the table above, there are 2 outcomes for Musa to win the game whereas there are 5 outcomes f or Meryem to win the game. Thus, Meryem’s chance to win the game is higher. E1: When two dice are rolled together, the sums “2” and “12” are obtained one time. For 2 the outcome i s t o be (1,1), and for 12 the outcome is to be (6,6). So, Choice c (see Table be l ow). + 1 2 3 4 5 6 1 2 3 4 5 6 7 2 3 4 5 6 7 8 3 4 5 6 7 8 9 4 5 6 7 8 9 10 5 6 7 8 9 10 11 6 7 8 9 10 11 12 2 Incorrect Answer-Correct Justification R1: Choice a is the correct answer. The number of elements in the sample universe of an experiment is 2. The c hances of heads a nd t ails are equal in the next toss; therefore, the outcome may be both. R3: As distributon of outcomes is more random, choic e c is more rea l i s t i c. Partially Correct Justifica- tion Answers that do not encompass all aspects of the valid justi- fication 2 Correct Answer - Partially Correct Justification E4: Choice c is the correct answ er. Because t he probabiliti es of stopping at yellow and blue colors are equal in both cases. PC 1: Choice b, because there are more green balls in the basket. 1 Incorrect Answer-Partially Correct Justification R3: The answer is choice a. According to me, the probabi l i ty of each letter on the dice is 1/6, and therefore the probability of each letter is equal. PC 4: There are equal numbers of red-coloured par t s i n both spinners. But, in spinner B, all red-coloured parts are together. Choice b. Wrong Justification Answers that contain incor- rect knowle dge 1 Correct Answer-Wrong Justification PC 2: Meryem’s chance to win is = 6/9, and Musa’s chance is = 3/9. So, Meryem’s chance is higher. E4: Since 3 people s pun Spinner A and 5 spun Spinne r B, choice c is correct. 0 Incorrect Answer-Wrong Justification E1: Chances of 2 is = 2/14 and chanc es of 12 is = 12/14 so the sum will more likely be 12. R1: Choice b, in this toss, tail comes, because all toss before are head. No Justification Correct, incorrect or blank answer s with no justifications written. 1 Correct Answer–No Justification … 0 Incorrect Answer–No Justification … 0 No Answer–No Justification … PC: Proba bility Comparisons, R: Repres entative ness, E: Equiprobability. c) between 8th and 6th graders, while it was (Mean difference = 0.26042, p < 0.05) between 8th and 7th graders. However, no significant difference was found between groups’ pre-test scores E [F (2 - 68) = 2.040, p > 0.05] ve R [F (2 - 68) = 0.943, p >.05]. Therefore, it can be said that all groups had the same level of misconceptions in E and R concepts prior to the instructional process. Moreover, when the pretest results of the groups are compared, it can be seen that the number of misconceptions changes significantly depending on age related to the concept PC. It could be noted that: a) there is better understanding of this concept depending on age; b) students have to use this concept throughout their growing by teachers  R. GÜRBÜZ ET AL. OPEN ACCESS possess affluent knowledge of this concept; d) an effective presentation of this concept in all levels was effective in the creating of such a picture related to PC concept. It could also be maintained that in E and R concepts, less use of these concepts in daily life and teachers’ lack of knowledge related to these concepts played a role. As can be observed in Figure 4 and Table 3, as a result of intervention, the number of answers with misconceptions in all groups related to PC, E and R concepts was lessened. Table 5 illustrates that intervention created a siginificant effect in remedying misconceptions related to PC, E and R concepts in all class levels. It could be understood from Table 5 that as a result of intervention, misconceptions related to PC concept in 7th grade students (Mean = 1.19) were decreased more compared to 6th grade (Mean = 1.10) and 8th grade students (Mean = 1.08). It is also shown that this effect was higher in 8th graders (Mean = 1.61) related to E concept compared to 7th (Mean = 1.43) and Table 3. Descriptive statistics. Concept Measure Grade 6 Grade 7 Grade 8 M SD M SD M SD PC Pre-test 1.03 0.35 10.19 0.34 1.45 0.35 Post-test 2.14 0.31 2.39 0.32 2.54 0.29 Improvement* 1.10 0.52 1.19 0.50 1.08 0.37 0.98 0.33 0.85 0.37 0.97 0.32 Post-test 2.03 0.32 2.29 0.29 2.59 0.33 Improvement* 1.04 0.37 1.43 0.46 1.61 0.46 0.94 0.41 1.00 0.48 1.06 0.38 Post-test 1.97 0.21 2.44 0.38 2.61 0.44 Improvement* 1.03 0.33 1.44 0.66 1.55 0.62 Table 4. The comparison of Pre-test scores of groups on MT related with the all concepts using ANOVA. Measure Sum of Squares df Mean Square F p Difference PC Between Groups 2.172 2 1.086 8.693 0.000 8th grade > 6th gr ade Within Groups 8.494 68 0.125 8th grade > 7th grade Total 10.665 70 0.269 2 0.135 1.121 0.332 no significance Within Groups 8.164 68 0.120 Total 8.433 70 0.161 2 0.080 0.436 0.648 no significance Within Groups 12.526 68 0.184 Total 12.687 70 Table 5. Groups’ paired t-test results. Grade Pre-test-Post-test Mean Difference SD t df p 1.10870 0.52671 10.095 22 0.000 E 1.04348 0.37426 13.371 22 0.000 R 1.03261 0.33966 14.580 22 0.000 1.19792 0.50529 11.614 23 0.000 E 1.43750 0.46186 15.248 23 0.000 R 1.44792 0.66340 10.692 23 0.000 1.08333 0.37349 14.210 23 0.000 E 1.61458 0.46026 17.185 23 0.000 R 1.55208 0.62978 12.073 23 0.000  R. GÜRBÜZ ET AL. OPEN ACCESS 6th graders (Mean = 1.04), that related to R concept, it was higher in 8th graders (Mean = 1.55) compared to 7th graders (Mean = 1.44) and 6th graders (Mean = 1.03). Results of one-way ANOVA and Tukey HSD test applied to assess if the intervention had a class-level significant effect in remedying misconceptions related to PC, E and R concepts are shown below. Table 6 shows that the intervention created a significant difference in terms of remedying groups’ misconeptions related to all concepts but that this effect was not significant in PC [F (2 - 68) = 0.368, p > 0.05] concept depending on age but it wa s significant in E [F (2 - 68) = 10.568, p < 0.01] and R [F (2 - 68) = 5.505, p < 0.01] concepts depending on age. According to Tukey HSD results, as shown in Table 7, misconceptions re- lated to E concept were overcome more significantly by 8th [mean difference = 0.57111, p < 0.01] and 7th [mean difference = 0.39402, p < 0.01] graders than 6th graders, but this effect was not significant in 8th graders compared to 7th [mean difference = 0.17708, p > 0.05] graders. Similarly, miscon- ceptions related to R concept were overcome more significantly by 8th [mean difference = 0.51947, p < 0.01] and 7th [mean difference = 0.41531, p < 0.01] graders than 6th graders, but this effect was not significant in 8th graders compared to 7th [mean difference = 0.10417, p > 0.05] graders. It could be s aid the fact that in removal of groups’ misconceptions at similar level in PC concept, students had a certain level of knowledge related to this concept, and understanding of this concept does not necessitate much theoretical knowledge were effective. It could also be stated that in removal of groups’ misconceptions at different levels in E and R concepts, in addition to students’ age, their knowledge about other probability concepts in understanding these concepts and the need for deeper logical reasoning were effective. It is specifically important to say that in addition to the intervention conducted, age also played a role in removal of groups’ misconceptions related to E and R concepts. In other words, it could be inferred that as age level increases, the intervention led to a greater decrease in mis- conceptions related to E and R concepts. Gürbüz et al. (2012) reached similar findings. When the answers of participants were examined, it was found that students had different justifications for their right or wrong answers in pre- and post-test. Since the research group consists of 74 students in total, all papers in pre-test and post- test could be examined in detail. However, since it was not pos- sible to transfer all answers by students to the study, some sam- ple student answers were given. For example regarding PC 1, some students were found to give incorrect answers in pre-test either because of building a relationship with general chance factor and favourite color concept or because of concentrating on the location of the balls in the basket. For example, “We can say nothing unless we know the favourite colors of the person who choses the balls (G7)”, “I can’t comment on it because it depends on chance (G6;G7)”, “Green, because they’re at the bottom and when the basket is mixed they will be at the top (G6)”. Such approaches of students who gave wrong or misconcept ional answe rs to ques- tion PC 1 are in line with the student approaches in the studies of Gürbüz (2007; 2010), Gürbüz, Çatlıoğlu, Birgin and Erdem (2010) and Jones et al. (1997). In addition, as a result of the effect of intervention, more correct answers were observed in all grade levels. Explanations related to question PC 1 made by some of the students in post-test are as follows: “Green because the number of green balls in the basket is the highest (G6; G7;G8)”, “Choice b, since the number of green balls in the bas- ket is higher than others, the probability of getting green is the highest. Numerically, P(G) = 4/9 (G7;G8)”. It was found that, regarding question PC 2, some of these students used general chance factor in probability subject, while another group used the perception that the probabilities will be the same and a small portion gave illogical justifications in pre-test. “The families of Musa and Meryem should be checked; whoever was born in a luckier family will win (G7)”, “Musa and Meryem have the same chance. Because there’s only one 3 and one 6 on the die (G6;G7;G8)”, “3 + 6 = 9: 2 = 4, 5 bot h ha ve the same chance to win (G6)”. It should be noted here that, as students’ ages and level of education increased they tended to answer the question by relating it to chance factor. Amir and Williams (1999), Baker and Chick (2007), Batanero and Serrano (1999), Fischbein et al. (1991), Lecoutre (1992) and Nilsson (2007) reported similar conclusions in their studies. Some of the students who gave misconceptional answers also used some probable outcomes as reported by Amir and Williams (1999). For example, “Musa is my favourite because Table 6. The compar ison of post-test scores of groups on MT related with all concepts using ANOVA. Variable Sum of Squares df Mean Square F p 0.173 2 0.087 0.388 0.680 Within Groups 15.184 68 0.223 Total 15.357 70 3.997 2 1.999 10.568 0.000 Within Groups 12.860 68 0.189 Total 16.857 70 3.527 2 1.764 5.505 0.006 Within Groups 21.783 68 0.320 Total 25.310 70  R. GÜRBÜZ ET AL. OPEN ACCESS Table 7. Tukey HSD results. Variable (I) grup (J) grup Mean Difference (I-J) Std. Error p 6th grade 0.39402* 0.12690 0.008 8th grade 6th grade 0.57111* 0.12690 0.000 7th grade 0.17708 0.12554 0.341 6th grade 0.41531* 0.16515 0.038 8th grade 6th grade 0.51947* 0.16515 0.007 7th grade 0.10417 0.16338 0.800 when the outcomes are (1,2) and (2,1), their sum would be three. On the other hand, in order to obtain six, there’s only (3,3) (G7)”, “Musa and Meryem have the same chance. Because for 3, (1,2), (2,1) and for 6, (1,5), (5,1) (G7;G8)”. Such miscon- ceptional answers from students can be argued to stem from students’ l ack of sufficient knowledge in sample space concept. In parallel, Baker and Chick (2007), Bezzina (2004), Chernoff (2009), Fischbein et al. (1991), Gürbüz (2007; 2010), Keren (1984), Nilsson (2007) and Polaki (2002) showed in their studies that students’ knowledge about sample space concept played an important role in their answers to questions related to probability subject. Moreover, few students gave miscon- ceptional answers by considering gender factor as reported by Amir and Williams (1999). For example, “Musa is the favourite. Becuase, males are more lucky in this kind of chance games” (G6;G7). In question PC 2, it’s understood that students’ jus- tifications are effected from their individual learning, ex- periences, cultures and beliefs. Amir and Williams (1999), Fischbein et al. (1991), Sharma (2006) and Shaughnessy (1993) reported similar results in their studies. When students’ an- swered PC 2 question in the post-test, it could be seen that a great number of answers that did not make sense were corrected. For example, “Choice b, because 6 is (G6;G7),”,”Meryem is more advantegous as the probability of total score to be 6 is high (G6;G7), “Choice b, because cases where Musa will win are (1,2) ve (2,1) but cases where Meryem will win are (1,5), (5,1), (2,4), (4,2) and (3,3). Since Meryem has more cases to win, she is more advantegous (G7;G8)”. Many students realized the importance of size in solving question PC 4, but they gave answers containing misconce- ptions because they concentrated on only one aspect of size in the pre-test. For example, some of the students gave answers such as, “Choice b, because on spinner B the red color covered more than half of the shape (G6;G7)”, “The probability of spinner B to stop on a red color is higher because there are more red areas (G7;G8)”. On the other hand, there were an- swers to question PC 4 contrary to mathematical logic such as “We can not decide at what colors the spinners will stop be- cause we don’t know at what speed they are turned (G6)”, “When looking at the direction of the arrow, both have a high chance to stop at red color (G7)”. However, though some mis- takes made related to PC 4 question in the pre-test were re- peated by a few students, most students gave correct answers in the post-test. For example, “Choice B, since red colours are gathered on spinner B (G6;G7)”, “The probability of stopping in a red area on both spinners are equal (G6;G7;G8)”, “As the areas covered by red colour on both spinners are equal, choos- ing A or B does not change my chance to win. P(A) = P(B) = 6/12 (G6;G7;G8)”. It was found that, in question E 1, some of the students couldn’t reason probabilistically, and they couldn’t think or know that there was no number greater than 6 on the faces of a traditional die in the pre-test. For example, “12 is more likely because 12 is greater than 2 (G6;G7)”, “For the sum to be 2, the dice should be (1,1); for the sum to be 12, the dice should be (8,4), (6,6), (7,5), (9,3), (10,2), (11,1). Therefore the probability of 12 is higher (G7;G8)”. Polaki (2002) names this type of thinking as subjective probabilistic thinking, and, according to him, the students reflecting at this level can not give logical or mathematical answers. On the contrary, Bezzina (2004) pointed out that the students falsely believe that a “six” is the most difficul t scor e to obt ai n whe n a die is rolled at random. It could be said that students gave more correct answers to E 1 question in the post-test. For example, “Choice C, for the sum to be 2, the dice should be (1,1); for the sum to be 12, the dice should be (6,6), thus, the probability of the total to be 2 or 12 is equal(G6;G7;G8)”, “When a die is rolled, in total, the minimum will be 2 and maximum will be 12 and there is only one case where each of these total numbers could be gathered (G7;G8), so choice C is true”. Students gave answers containing misconceptions to question E 4 by using their intuitions and informal strategies in the pre-test. For example, “I would choose spinner B because more people turn it (G6;G7;G8)”, “3 people are turning spinner A, 5 people are turning spinner B therefore in order to equalize the number of people turning each spinner, I would choose spinner A (G6;G7)”. It could be argued that the students giving such kinds of justifications have “Outcome Approach” misc on- ception. Likewise, according to Jun (2000) and Konold (1989), students who have this kind of misconception make decisions considering the results of previous outcomes. It is possible to see that students gave more correct answers in the post-test. For example, “Since the probability of A spinner to stop on yellow and of B spinner to stop on blue color are equal, it does not make a difference (G6;G7;G8)”, “Both the yellow and blue areas cover half of the circle, that is why, the answer is C (G6;G7;G8)”, “Choice C, the probability of A spinner to stop on yellow and of B spinner to stop on blue color is 50 % (G6; G7;G8)”. In question R 1, some of the students mostly showed  R. GÜRBÜZ ET AL. OPEN ACCESS misconceptions of positive and negative recency in the pre-test. For example, “The first four outcomes were heads. So, the fifth toss would more likely be tails (Negative recency) (G6;G7; G8)”, “The successive outcomes were heads. So, the next toss will more likely result in heads (Positive recency) (G6;G7; G8)”. It is expressed that children’ gender could be guessed through the same approaches. For instance, Kahneman and Tversky (1972) stated that for a family with 6 children, it’s believed that the order of the genders will more likely be MFFMFM (M:Male; F:Female) instead of MMMMMM or MMMFFF. It’s possible to find similar results in the study by Fast (1997). However, students in the post-test learnt first tosses would not affect later tosses. For example, “The pro- bability of getting heads and tails are the same because there are two faces of the coin, being heads and tails (G6;G7;G8)”, “The outcome in the previous toss does not affect the later one, thus Choice C. (G6;G7;G8)”, “Since getting heads and tails are independent events, the probability of getting either one is the same (G7;G8)”. In question R 3, only a few students at all levels gave justification in the pre-test. This concept is hard to understand and in order to understand it first other concepts (Sample Space, The Probability of an Event, Probability Comparison) should be well comprehended. Some students showed the misconception of representativeness heuristic in this question. For example, some students stated that “Choice a, because it’s more realistic that all faces come as an outcome equal times (G6;G7;G8)”, “All the outcomes have equal probability, so choice a (G6;G7;G8)”, “Choice c, in which the same order exists, is more probable (G6;G7)”.Batanero and Serrano (1999), Shaughnessy (1977) and Gürbüz and Birgin (2012) obtained results in their studies similar to these. Batanero and Serrano (1999) found that smaller children dealt more with runs, or whether heads and tails come out in an order; whereas, older students focused more on the number of heads and tails. Though it was possible to see some answers given in the post-test similar to answers with misconceptions in the pre-test, it was observed that more correct answers were given in all grade levels. For example, “Choice b, because when this die is tossed it is not realistic to get both faces equally (G6;G7; G8)”, “Since the distribution is more randomly, b is more logical (G7;G8)”, “As more regular outcomes are gathered succes- sively c is a more correct anwers (G6;G7;G8)”. In summary, it can be argued that with the implemented intervention, all graders’ scores increased and the number of misconceptions decreased. On the other hand, while there was not any singnificant relationship between age and remedying misconceptions in groups related to PC concept, it could generally be noted that, depending on age, the intervention helped students remedy more misconceptions in E and R concepts. Conclusions and Implications When the pre-test results are examined, a significant dif- ference was observed between groups’ misconceptions related to PC concept, and this difference was found between 8th and 6th graders and 8th and 7th graders. On the other hand, no significant difference was found among groups related to E and R concepts. However, as a result of the intervention, all graders’ post-test scores regarding all the concepts showed a significant increase when compared to pre-test scores. While there was no any singnificant relationship between age and remedying mis- conceptions in groups related to PC concept, it could generally be noted that, depending on age, the intervention helped stu- dents overcome more misconceptions in E and R concepts. It was determined that the intervention did not make a significant difference according to age in remedying misconceptions re- lated to PC concepts in groups, but that age had a significant ef- fect on overcoming misconceptions (more in 7th and 8th gra- ders than 6th graders) in E and R concepts. To summarize, it can be suggested that the implemented intervention has dif- ferent effects depending on age and the concept. Activity-based teaching, which contributes to remedying misconceptions and provides learning relevant to real life, should be performed in the subject of mathematics. The number of justifications related to the concepts in MT was found to increase with the increase of age when par- ticipants’ answers were examined. This could be attributed to the development of mathematical reasoning and language in addition to age factor. As a matter of fact, in learning pro- bability concepts, Fischbein et al. (1991), Offenbach (1964), Watson and Moritz (2002), and Way (2003) emphasized age, Erdem (2011), Lamprianou and Lamprianou (2003), Memnun (2008), Offenbach (1965) and Olson (2007) focused on mathe- matical reasoning, Ford and Kuhs (1991), Gibbs and Orton (1994), Kazıma (2006) and Tatsis et al. (2008) mentioned the effect of language development. In this sense, for further re- search, the relationship between age and language develop- ment, and between age and mathematical reasoning should be studied. Argumentation is an important process both in learning ma- thematical concepts and in analyzing the nature of activity wi- thin mathematics classrooms (Sfard et al., 1998). This process must be consciously made use of in the teaching of concepts that require a deeper thinking, such as probability concepts. Ac- tivities used in this study contributed to the discussion process being more consciously and productively executed. It revealed that during the process, groups consisting of more aged mem- bers had more effective discussions. It is believed that the ef- fective discussion process was effective in the development of aged groups’ learning of some probability concepts. Because of this reason, discussion environments must be created in maths teaching starting from early ages. REFERENCES Abraham, M. R., Williamson, V. M., & Westbrook, S. L. (1994). A cross-age study of the understanding five concepts. Journal of Re- search in Science Teaching, 31, 147-165. http://dx.doi.org/10.1002/tea.3660310206 Amir, G., & Willi ams, J. (1999). Cultu ral influences on children’s p ro- babilistic thinking. Journal of Mathematical Behavior, 18, 85-107. http://dx.doi.org/10.1016/S0732-3123(99)00018-8 Aspinwall, L., & Shaw, K. L. (2000). Enriching students’ matematical intuitions with probability games and tree diagrams. Mathematics Teaching in the Middle School, 6, 214-220. Baker, M., & Chick, H. L. (2007). Making the most of chance. Austra- lian Primary Mathematics Classroom, 12, 8-13. Barnes, M. (1998). Dealing with misconceptions about probability. Australian Mathematics Teacher, 54, 17-20. Batanero, C., & Serrano, L. (1999). The meaning of randomness for secondary school students. Journal for Research in Mathematics Edu- cation, 30, 558-567. http://dx.doi.org/10.2307/749774 Bezzina F. (2004). Pupils’ Understanding of Probabilistic & Statistics (14-15+) Difficulties and Insights For Instructio n. Journ al of Ma ltese  R. GÜRBÜZ ET AL. OPEN ACCESS Education Research, 2, 53-67. Chernoff, E. J. (2009). Sample space partitions: An investigative lens. Journal of Mathematical Behavi or , 28, 19-29. http://dx.doi.org/10.1016/j.jmathb.2009.03.002 Dooren, W. V., Bock, D. D ., Depaepe, F., Janssens, D., & Verschaffel, L. (2003 ). The illusion of lin earity: Expanding the evidence towards probabilistic reasoning. Educational Studies in Mathematics, 53, 113- 138. http://dx.doi.org/10.1023/A:1025516816886 Erdem, E. (2011). An investigation of the seventh grade students’ ma- thematical and probabilistic reasoning skills. M.A. Thesis, Adıya- man: Adıyaman University. Fast, G. (1997). Using analogies to overcome student teachers’ pro- bability misconceptions. Journal of Mathematical Behavior, 16, 325- 344. http://dx.doi.org/10.1016/S0732-3123(97)90011-0 Fast, G. (2001). The stability of analogically reconstructed probability knowledge among secondary mathematics students. Canadian Jour- nal of Science, Mathematics and Technology Education, 1, 193-210. http://dx.doi.org/10.1080/14926150109556461 Fischbein, E. (1975). The intuitive sources of probabilistic thinking in children. Reidel, Dordrecht, The Netherlands. http://dx.doi.org/10.1007/978-94-010-1858-6 Fischbein, E., & Schnarch, D. (1997). The evolution with age of pro- babilistic, intuitively based misconceptions. Journal of Research in Science Teaching, 28, 96-105. Fischbein, E., Nello, M. S., & Marino, M. S. (1991). Factors affecting probabilistic judgements in children and adolescents. Educational Studies in Mathematics, 22, 523-549. http://dx.doi.org/10.1007/BF00312714 Ford, M. I., & Kuhs , T. (1991). The act of in vestigating: Learning ma- thematics in the primary grades. Childhood Education, 67, 313-316. http://dx.doi.org/10.1080/00094056.1991.10520819 Garfield, J., & Ahlgren, A. (1988). Difficulties in Learn ing Basic Con- cepts in Probability an d Statistics: Imlications for Research. Journal for Research in Mathematics Education, 19, 44-63. http://dx.doi.org/10.2307/749110 Gibbs, W., & Orton, J. (1994). Language and mathematics. İn A. Orton, & G. Wain, (Eds.), Issues in teaching mathematics (pp. 95-116), London: Cassell. Greer, B. (2001). Understanding probabilistic thinking: The legacy of Efrahim Fischbein. Educational Studies in Mathematics, 45, 15-33. http://dx.doi.org/10.1023/A:1013801623755 Gürbüz, R. (2007). The effects of computer aided instruction on stu- dents’ conceptual development: A case of probability subject. Eura- sion Journal of Educational Research, 28, 75-87. Gürbüz, R., Çatlıoğlu, H., Birgin, O., & Erdem E. (2010). An inves- tigation of fifth grade students’ conceptual development of probabi- lity through activity based instruction: A quasi-experimental study. Educational Sciences: Theory & Practice, 10, 1021-1069. Gürbüz, R. (2010). The effect of activity based instruction on concep- tual development of seventh grade students in probability. Interna- tional Journal of Mathematical Education in Science and Techno- logy, 41, 743-767. http://dx.doi.org/10.1080/00207391003675158 Gürbüz, R., & Birgin, O. (2012). The effect of computer-assisted teach- ing on remedying misconceptions: The case of the subject “proba- bility”. Computers and Education, 58, 931-941. http://dx.doi.org/10.1016/j.compedu.2011.11.005 Gürbüz, R., Birgin, O., & Çatlıoğlu, H. (2012). Comparing the pro- bability-related miscon ception s of p upils at dif ferent ed ucatio n levels. Croatian Journal of Education, 14, 307-357. Hammer, D. (1996). More than misconceptions: Multiple perspectives on student knowledge and reasoning, and an appropriate role for education research. American Journal of Physics, 64, 1316-1325. http://dx.doi.org/10.1119/1.18376 Jones, G. A., Langrall, C. W., Thornton, C. A., & Timoth y Mogill, A. (1997). A framework for assessing and nurturing young children’s thinking in probability. Educa tio na l S tud ies in Ma th ematics , 32, 101- 125. Jun, L. (2000). Chinese students’ understanding of probability. Unpu- blished Doctoral Dissertartion. Singapore: National Institue of Edu- cation, Nan-yang Technological University. Kahneman, D., & Tversky, A. (1972). Subjective probability: A judg- ment of representativeness. Cognitive Psychology, 3, 430-454. http://dx.doi.org/10.1016/0010-0285(72)90016-3 Kazıma, M. (2006). Malawian students’ meanings for probability vo- cabulary. Educational Studies in Mathematics, 64, 169-189. http://dx.doi.org/10.1007/s10649-006-9032-6 Keren, G. (1984). On the importance of identifying the correct sample space. Cognition, 16, 121-128. http://dx.doi.org/10.1016/0010-0277(84)90002-7 Konold, C ., Pollatsek , A., Well, A ., Lohmeier, J ., & Lip son, A. (199 3). Inconsistencies in students’ reasoning about probability. Journal for Research in Mathematics Education, 24, 392-414. http://dx.doi.org/10.2307/749150 Konold, C. (1989). Informal conceptions of probability. Journal of Cognition and Instruction, 6, 59-98. http://dx.doi.org/10.1207/s1532690xci0601_3 Lamprianou , I., & Lampriano u, T. A. (2003). The nature of pupils’ pro- babilistic thinking in pri mary schools in Cyprus. International Group for the Psychology of Mathematics Education, 3, 173-180. Lecoutre, M. P. (1992). Cognitive models and problem spaces in “pu- rely random” situations. Educational Studies in Mathematics, 23, 557- 568. http://dx.doi.org/10.1007/BF00540060 Memnun, D. S. (2008). Olasılık kavramlarının öğrenilmesinde karşı- laşılan zorluklar, bu kavramların öğrenilememe nedenleri ve çözüm önerileri. İnönü Üniversitesi Eğitim Fakültesi Dergisi, 9, 89-101. Mevarech, Z. R. (1983). A deep structure model of students’ statistical misconceptions. Educational Studies in Mathematics, 14, 415-429. http://dx.doi.org/10.1007/BF00368237 Morsanyi, K., Primi, C., Chiesi, F., & Hand l e y , S. (2009). The effects and side-effects of statistics education: Psychology students’ (mis)conceptions of probability. Contemporary Educational Psychology, 34, 210-220. http://dx.doi.org/10.1016/j.cedpsych.2009.05.001 Moyer, P. S., Bolyard, J. J., & Spikell, M. A. (2002). What are virtual manipulatives? Teaching Children Mathematics, 8, 372-377. Nilsson, P. (2007). Different ways in which students handle chance encounters in the explorative setting of a dice game. Educational Studies in Mathematics, 66, 293-315. http://dx.doi.org/10.1007/s10649-006-9062-0 Nilsson, P. (2009). Con cep tual v ariati o n an d coo rdin ation in pro bab ility reasoning. Journal of Mathematical Behavior, 28, 247-261. http://dx.doi.org/10.1016/j.jmathb.2009.10.003 Offenbach, S. I. (1964). Studies of children’s probability learning be- havior: I. Effect of reward and punishment at two age levels. Child Development, 35, 709-715. Offenbach, S. I. (1965). Studies of children’s probability learning behavior: II. Effect of method event frequency at two age levels. Child Development, 36, 951-962. http://dx.doi.org/10.2307/1126936 Olson, J. (2007). Developing students’ mathe matical reasoning through ga mes . Teaching Children Mathematics, 13, 464-471. Piaget, J. (1952). The child’s conception of number. New York: Hu- manities Press. Polaki, M. V. (2002). Using instruction to identify key features of ba- sotho elementary students’ growth in probabilistic thinking. Mathe- matical Think ing and Learning, 4, 285-313. http://dx.doi.org/10.1207/S15327833MTL0404_01 Pratt, D. (2000). Making sense of the total of two dice. Journal for Research in Mathematics Education, 31, 602-625. http://dx.doi.org/10.2307/749889 Sfard, A., Nesher, P., Streefland, L., Cobb, P., & Mason, J. (1998). Learning mathematics throug h conversation: Is it as go od as they say? For the Learning of Mathematics, 18, 41-51. Sharma, S. (2006). How do Pas ifika Students reason about prob ability? Some findings from fiji. Waikato Journal of Education , 12, 87-100. Shaughnessy, J. M. (1993). Probability and statistics. Mathematics Teacher, 86, 244-248. Shaughnessy, J. M. (1977). Misconceptions of probability: An experi- ment with a small group, activity-based, model building approach to introductory probability at the college level. Educational Studies in Mathematics, 8, 295-316.  R. GÜRBÜZ ET AL. OPEN ACCESS http://dx.doi.org/10.1007/BF00385927 Shaw, D. (1999). Active teaching for active learners. Curriculum Ad- ministrator, 35, 37-45. Tatsis, K., Kafoussi, S., & Skoumpourdi, C. (2008). Kindergarten children discussing the fairness of probabilistic games: The creation of a primary discursive community. Early Chilhood Education Jour- nal, 36, 221-226. http://dx.doi.org/10.1007/s10643-008-0283-y Thompson, P. W. (1992). Notations, principles, and constraints: Con- tributions to the effective use of concrete manipulativ es in ele mentary mathematics. Journal for Research in Mathematics Education, 23, 123-147. Tversky, A., & Kahneman, D. (2003). Preference, belief, and similarity: Selected writings by Amos Tversky/edited by Eldar Sh af ir. Judgment under uncertainty: Heuristics and biases (p. 207). Cambridge: The MIT Press. Watson, J. M., & Mo rit z, J. B. (2002 ). Sch o o l st u d en ts ’ reasoning about conjunction and conditional events. International Journal of Mathe- matical Education in Science and Technology, 33, 59-84. http://dx.doi.org/10.1080/00207390110087615 Watson, J. M., & Kelly, B. A. (2004). Statistical variation in a chance setting: A two-year study. Educational Studies in Mathematics, 57, 121-144. http://dx.doi.org/10.1023/B:EDUC.0000047053.96987.5f Way, J. (2003). The development of young children’s notions of proba- bility. Proceedings of CERME3, Bellaria. http://www.dm.unipi.it/cluster-pages/didattica/ Weir, M. W. (1962). Effects of age and instructions on children’s probability learning. Child Development, 33, 729-735. Zembat, İ. Ö. (2008). Kavram Yanılgısı Nedir? In M. F. Özmantar, E. Bingölbali, & H. Akkoç (Eds.), Matematiksel Kavram Yanılgıları ve Çözüm Önerileri (pp. 1-8). Ankara: PegemA Yayıncılık. 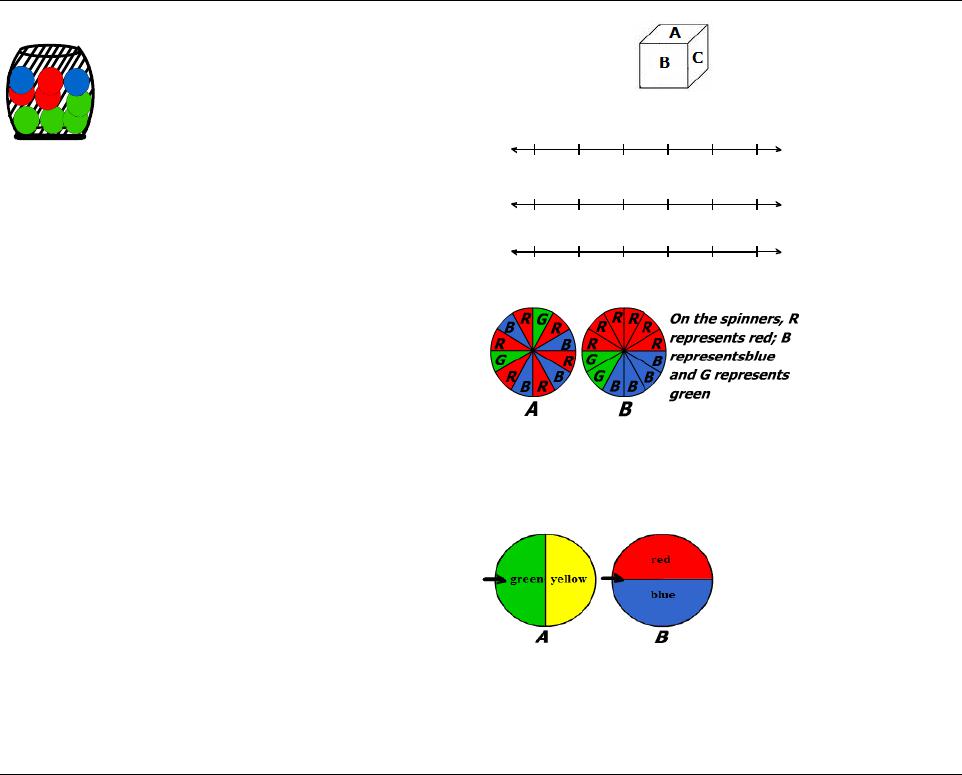 R. GÜRBÜZ ET AL. OPEN ACCESS Appendix Some Assessment Items PC 1 There are 4 gr een, 3 red and 2 blue, a tota l of 9 balls in this basket. When you close your eyes and pick out a ball after mixing all the balls in the basket, which color will this ball most likely be? Why? a) Blue b) Green c) Red R 3 A die on whose sides the letters A, B, C, D, E, and F are written is tossed 18 times. Which of the foll ow ing results is more realistical? Why? PC 2 Musa and Meryem play with a pair of dice. If the sum of the points is 3, Musa is the wi nner. If the sum of the points is 6, Meryem is the winner. Which of the f ollowing answ ers seems t o you to be the c or rect one? Why? a) Musa is the favourite b) Meryem is the favourite c) Musa and Meryem have the same chance A and B are two spinners. When these spinners are turned at the same time, which one is more likely to stop at red? Why? a) Spinner A b) Spinner B c) Both spinners have an equal chance E 1 When two dice are rolled at the same time, which outcome is mor e likely for the sum of the numbers on the upper faces of the dice, 2 or 12? Why? a) 2 is more likely b) 12 is more likely c) The probabilities of 2 or 12 are e qua l. The rule of the game dictates that when t he spinner s above are turned, if they stop on yellow or blue ar eas an MP3 player is won by the p layer. There are 50 players in the competition and the first 3 players turned the spinner A and it stopped each time on the yellow area . The next 5 people tu rned spinner B and it stopped each time on the blue area. If it were you, which spinner would you choose? Why? a) Spinner A b) Spinner B c) Both Spinners A or B are the sam e R 1 A coin is tossed four times and the resul ts are HHH H. What is more likely for the next toss, H eads or Tails? Why? (T = Tails, H= Heads) a) H is more likely b) T is more likely c) Both have equal chance R R R B G G O n the balls, “R” represents red; “B” represents blue and “G” represents green respectively. G G B b) ABCD EF a) c) x x x xx x x xx x x x x x x x x x AB C D EF x x x xx x x xx x xx x x x x x x ABCD EF x x xx x x xx x x x xx x xx x x
|