 International Journal of Geosciences, 2014, 5, 38-49 Published Online Januar y 2014 (http://www.scirp.org/journal/ijg) http://dx.doi.org/10.4236/ijg.2014.51006 A New Statistic Approach towards Landslide Hazard Risk Assessment George Gaprindashvili1,2*, Jianping Guo3, Panisara Daorueang4, Tian Xin5, Pooyan Rahimy6 1Department of Geology, National Environmental Agency, Ministry of Environment and Natural Resources Protection of Georgia, Tbilisi, Georgia 2Institute of Geo-Information Science and Earth Observation (ITC) of the University of Twente, Enschede, The Netherlands 3Institute of Atmospheric Composition, Chinese Academy of Meteorological Sciences, Beijing, China 4Department of Public Works and Town & Country Planning, Ministry of Interior, Bangkok, Thailand 5Institute of Forest Resource Information Techniques, Chinese Academy of Forestry, Beijing, China 6School of Environmental Sciences, University of Guelph, Guelph, Canada Email: *gaprinda1609@yahoo.com, *gaprindashvili.george@gmail.com Received November 13, 2013; revised December 15, 2013; accepted January 3, 2014 Copyright © 2014 George Gaprindashvili et al. This is an open access article distributed under the Creative Commons Attribution License, which p ermits unrestri cted use, distribution, and reproduction in any medium, provided the original work is properly cited. In accordance of the Creative Commons Attribution License all Copyrights © 2014 are reserved for SCIRP and the owner of the intellectual property George Gaprindashvili et al . All Copyright © 2014 are guarded by law and by SCI RP as a guardian. ABSTRACT To quantit ative ly asses s the la ndslide ha zard i n Khelva cha uri, Georgia, the statistic method of hazard index was applied. A spatial database was construc ted in Geogr aphic Information System (GIS) inc l uding topographic data, geologic maps, land-use, and active landslide events (extracted from the landslide inventory). After that, causal factors of landslides (such as slope, aspect, lithology, geomorphology, land-use and soil depth) were produced t o calculate the corresponding weights, and thereby we defined a relevant set of spatial criteria for the latter landslide ha za rd assessment. On top of that, susceptibility assess ment was performed in order to classify the area to low, moderate and high susceptible regions. Results showed that NW aspect, mountain geomorphology, pri- vate land-use, laterite loam and clay, slope between 19 to 24 degrees, and soil depth between 10 - 20 cm were found to have the largest contribution to high landslide susceptibility. The high success rate (72.35%) was ob- tained using area under the curve from the landslide susceptibility map. M eanwhile, effect analysis was carried out to assess the accuracy of the landslide susceptibility, indicating that the factor of slope played the most im- portant role in determining the occurring probability of landslide although it did not deviate as much as other factors. Finally, the vulnerability analyses were carried out by means of the Spatial Multi-Criteria Estimation model, which in turn, led to the risk assessment. It turned out that not so much of the number of buildings (~ 34.13%) was associated with high-risk zone and that governmental and private land-use almost accounted for the same risk (39.9% and 40.9%, respectively). KEYWORDS Landslide; Weight; Susce pt ibility; Vulne r ability; Statistic 1. Introduction Nowadays, quantitative landslide assessment is still in- adequate due to too limited resources available for re- search, such as historic records of landslides and detailed socio-economic elements at risk. In particular, there are no enough data available in order to construct a proba- bilistic model of landslides at different magnitudes that leads to a quantitative ris k asse ssment. Most co nvention- al landslide studies ar e descriptive and qualitati ve; there- fore, it is imperative for data-driven assessment in com- bination with in-depth knowledge o f all the causal fa ctors for landslide. The quantitative approach applied in this study, is of great importance for the benefit of the gov- ernment decision-makers, the urban planners and ulti- Corresponding author. OPEN ACCESS IJG 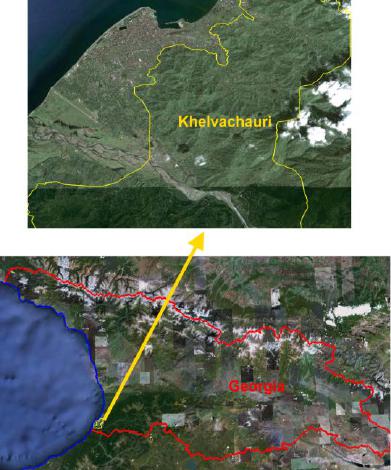 G. GAPRINDASHVILI ET AL. mately the local communities. The landslides frequently cause huge social and eco- nomical disasters, posing threat to life and livelihood all over the world. Many environmental factors related to fields of geology, geomorphology, topography, and land- use have the potential to induce landslides [1]. Tools for handling and analyzing spatial data (i.e., GIS) facilitate the application of quantitative techniques in landslide hazard assessment and mapping. In terms of methods in evaluating a landslide hazard, they can be categorized into: geological, geotechnical, hydrological, geophysical modeling, and statistical approach. The work o f Lee and Jones [2] suggests that landslide risk assessment methods should be classified as qualita- tive, semi-quantitative and quantitative. The recent trend towards the development of warning systems and land utilization regulations aimed at minimizing the loss of lives and damages to properties without investing in long-term and costly projects of slope stabilization [3,4]. As a result, nowadays landslide hazard assessment, in- cluding susceptibility and vulnerability mapping, increa- singly becomes vital. Recently, various studies have been carried out on quantitative landslide susceptibility assessment along with deterministic statistics [5-7] and even artificial in- telligence [8-13]. Unfortunately, the above-mentioned risk assessment methods are case-specific and require many types of data on landslide occurrence and impact, most of which, however, are not yet available in Georgia, our study area of this paper. To identify areas that are susceptible to future landslides, it is very important to accurately detect past landslides and to quantitatively formulate the relation between the landslide occurrence and spatial occurrence of environmental data. Therefore, this paper will present a statistical method called “hazard index” to tackle the issues of landslide susceptibility and risk analysis in Khelvachauri, Georgia. This method is mainly based on the landslides inventory map, generated by visual inter- pretation of aerial photos, satellite images, and field sur- veys. Six indicator maps contributing to the occurrence of landslides will be combined as well. Susceptibility assessment in this area was also carried out, and assessed using the effect assessment. Finally, we constructed a vulnerability map by comparing the produced landslide susceptibilit y map with available data of elements at risk. 2. Study Area The study area (Figure 1) is locat ed in Khel vachaur i, one of the five municipalities in Adjara, an autonomous re- public in the southwest Georgia, 8 km southeast from one of the major cities o f Georgia - Ba tumi. Also, it cov- ers an area of about 97.5 km2 with a population of ap- pro ximate 38 ,000 , inc ludi ng the c it y of Khel vacha uri and Figure 1. The study area of Khelvachauri, Georgia shown within t he red boundary (Source: Google Earth). Makhinjauri, as well as 30 villages. This area is bounded by the B lack Sea to the west and by Turke y to t he south. Within the study area, the most important and longest river is Chorokhi River, which flows 26 km along the region. Most of its parts pass through mountainous re- gion, which is practically inaccessible for field explora- tion. Agriculture dominates in the regional economy al- though industry has been also d eveloped. There are three tea factories, stagnant materials plant and constructing blocks workshop. However, agriculture (especially in tea and citrus production) as well as husbandry takes a lead- ing part. Landslides occur almost in all landscape - ge omor- phologic zones, which makes that there is a wide diffe- rentiation in the failure types and mecha nisms a nd in the size-frequency distribution. Negative impact of lands- lides are in the form of destruction of buildings, agricul- tural lands, roads and other infrastructure and also to considerable effect on population in the form of loss of human li fe and a significant number of eco-migrants . The relief, geology, geomorphology of the territory of Khelvachauri creates favorable conditions for the devel- opment of active geological processes, such as landslides, mudflows/d ebrisflows and rockfalls. Landslide processes affecting the social and economic development of the country are widespread in this region. 3. Data Description In order to assess the landslide hazard triggered by rain- fall i n Khel vachauri , Georgi a, we fir st have to obta in the lands lide i nvento ry map, which was limited to the per iod OPEN ACCESS IJG 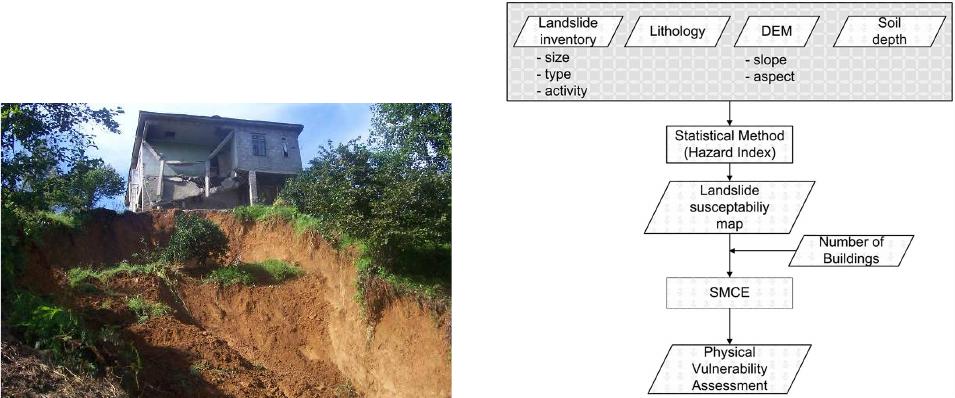 G. GAPRINDASHVILI ET AL. of 2000 to 2006, with the original landslide data from Ministry of Environmental Protection and Natural Re- sources of Georgia. The inventory recorded 45 landslides, almost belonging to the active states. Typically, land- slides were visually interpreted by comparing ortho-rec- tified aerial photographs taken before and after the oc- curring of landslides, in conjunction with high-resolution Google-Eart h i mages a nd inte nsive fiel d work ( Figure 2). Finally we derived the landslide inventory map, includ- ing all types of landslides and their corresponding infor- mation, eg. occurring time and the degree of damage. The causal factors and elements at risk are prerequi- sites for the latter risk and vulnerability assessment, which is describ e d in detail in the following sections. 3.1. Causal Factors The causes of landslides have b een classified into rainfall, earthquakes, erosion weathering, groundwater level, and human activities [14]. Even though there are always more than one single cause for the occurrence of landslides, according to the records of Ministry of Envi- ronment and Natural Resources Protection of Georgia, the active landslides in this study area, nevertheless, are mainly induced by the rainfall. In theory, the more possible causal factors considered, the more accurate landslide susceptibility and risk as- sessment. To this end, we tried our best to collect such data as topography, geotechnical and general soil mea- surements, lithology, geomorphology, and satellite im- ages. Nonetheless, the factor of rainfall, commonly thought as a main triggering factor of landslide, was ex- cluded primarily due to unavailability of enough weather stations. The above-mentioned factors used here were digitized based on the historical geological maps at the scale of 1:10,000. Factors derived from topography, such as slope gradient and slope aspect, were calculated from the topographic data, generally considered as the most influential factors. Furthermore, geomorphologic data Figure 2. Landslide in Ortabatumi (Khelvachauri Munici- pality). were collected from historical map and the land-use data were derived from parcel data of the cadastral database. Soil depth data were measured via field survey investiga- tion prior to landsl ide occurring. 3.2. Elements at Risk Identifyi ng the elements at risk of landslide and vulnera- bility assessment need the exact spatial distribution of buildings in the study ar ea, as well a s the socio -economic information like the number of stories, possession of properties, economic values etc. All of the data consi- dered as elements at risk were basically extracted from cadastral data and participatory GIS procedures. 4. Methodology 4.1. Workflow As shown in F ig ure 3, the workflow for the assessment of landslide can be roughly described as follows: The primary input data were lithology, geomorphology, land use, soil depth and topographic data. Other informa- tion (secondary data) was derived from the different in- put data (e.g., slope and aspect from topographic). The collectively called causal factors (primary and secondary data) were used as inputs into the statistic model. This was separately calculated to give the respective weight and was finally analyzed for the susceptibility assessment. Finally, the physical vulnerability was assessed by the Spatial Multi-Criteria Estimation (SMCE) method [15] and was computed through crossing the number of building and land use information. It should be noted that result s fro m the SMCE d id facilitate t he deter mination of physical vul ner a bility in this study area. Figure 3. Flowchart of susceptibility mapping and vulnera- bility a ssessment of landsli de . OPEN ACCESS IJG  G. GAPRINDASHVILI ET AL. 4.2. Hazard Index Method Due to the lack of enough landslide history and geotech- nical data, the quantitative, deterministic or probabilistic models were excluded from the study. As an alternative, bivariate statistical vulnerability assessment of landslide (a semi-quantitative approach) was applied here, just based on the active landslide events. The method expli- citly considered a number of factors influencing the sta- bility of slope [1 6] , including the follo wing 6 p ara meters: lithology, geomorphology, landuse, soil depth, slope and aspect. In order to assess the vulnerab ility of landslide hazard, landslide susceptibility map was generated using a basic statistical method, called hazard index, which was for- mulated as: () ()() ( ) Area SiArea Si Densclas lnln Area NiArea Ni Densmap i W == ∑ ∑ (1) where Wi represented weight, and subscript i indicated one of the 6 parameters: slope, aspect, lithology, geo- morphology, land use and soil depth. Densclas was the landslide density belonging to the corresponding para- meter class. Densmap represented the landslide density within the entire map. “Area (Si) “indicated area, which contained landslides, for a given parameter class. Area (Ni) referred to the total area for a given parameter class. Noted that all the processes were performed in Integrated Land and W ate r Info r mation Syst em (I LWI S), which i s a GIS and remote sensing software developed by The Fa- culty of Geo-Information Science and Earth Observation of Twente Universi ty, Netherlands. As illustrated in Figure 4, the slope was first derived from Digital Elevation Model (DEM), and then was weighted according to Equation (1 ). The other five causal factor parameters can be assigned the corresponding weight in that vein. Specifically, the method was based on map by crossing landslide map at the active state with one of the 6-parameter maps. The map crossing results were shown in a cross table, which was utilized to calcu- late the density of landslides for a given parameter class. A standardization of these density values was obtained by relating them to the overall landslide density in the entire area. Here, the landslide density in the entire map divided the landslide density per class. The natural loga- rithm was taken, so it follows that when the landslide density was lower than normal, you will get negative weights, and positive when it was highe r than normal. By mathematically adding up the weights of the 6 fac- tor maps, a susceptibility map can be created. After that, the values were classified into three classes: low, mod- erate and high susceptibilities. A cross validation tech- nique called “success rate” was performed to evaluate the performance of the model. The pixels of the sum of the 6 factor maps were arranged from high to low values based on the frequency information of the histogram and were categorized into 100 classes. Subsequently, a joint fre- quency was calculated with the overlaid active landslide map and summed 6 factor maps and was presented as a cumulative percentage of landslides and the percentage of map’s area. The area under the curve was calculated as well to assess the accurac y of the map. Effect analysis can further show how success rate changes when the input factors are changed and quanti- fies the uncertainty of each factor [17]. Effect analysis was done by excluding a single factor from the summa- tion of the other factors in such a way that for example the aspect was excluded and the weights of geomorphol- ogy, lithology, land-use, slope, and soil depth were summed up. This was repeatedly done for all the causal factors. 5. Results 5.1. Causal Factors Mapping Terrain parameters, i.e. slope and aspect were always being thought as good indicators of the spatial criteria required in SMCE-based landslide susceptibility assess- ment. They were primarily derived from DEM data. From the very beginning, we tried to derive terrain pa- rameters from two different DEM source, i.e. ASTER and topographic map. By comparing the contour line from ASTER DEM and that of the 1:50,000 topographic map, large errors were found (maximum 30 meters shift, not graphically shown here) between them. As a result, we selected DEM from topographic map as the data source for the aspect and slope factors, and cautions should be taken in the potential applications of ASTER DEM in the assessment of landslides hazard. On top of slope and aspect maps, other factors such as lithology, geomorphology, soil depth and land use were shown in Figure 5. 5.2. Active Landslide Extraction Thirty-eight active landslides were extracted and taken as the dependent variable in the model thus the susceptibil- ity assessment was performed based exactly on this type. Also, as indicated in Figure 6, the active landslides spread sporadically everywhere in the study area, which suggested that the situation in this area is very severe. Given the multi-land use types and topographic factors in this area, the assessments of landslide were getting more complicated . 5.3. Weight Assignment To identify the most influential causal parameters on active landslides in the study area and quantify their cor- OPEN ACCESS IJG 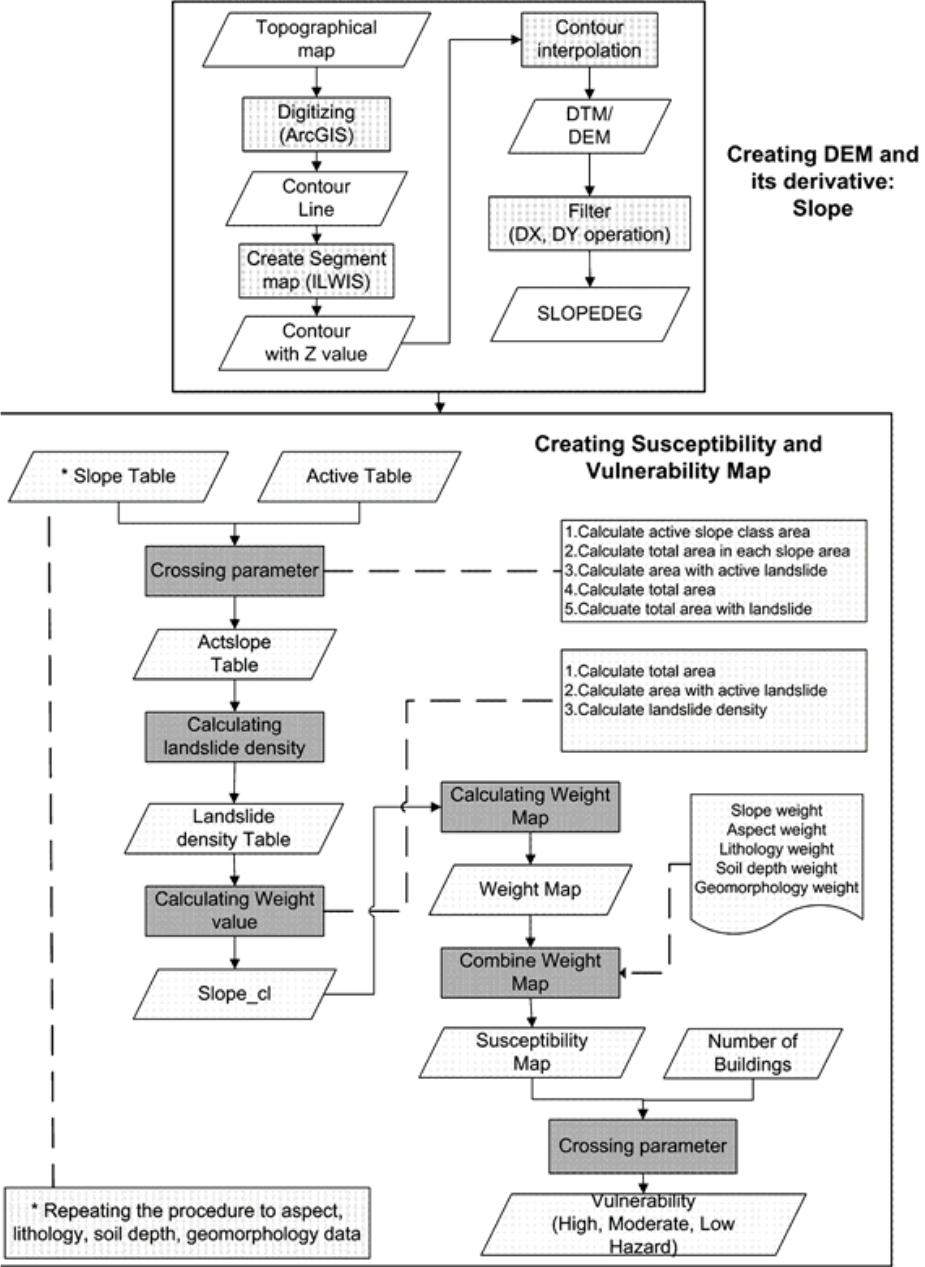 G. GAPRINDASHVILI ET AL. Figure 4 . The det a iled methodology employe d in landslide assessment. OPEN ACCESS IJG  G. GAPRINDASHVILI ET AL. OPEN ACCESS IJG 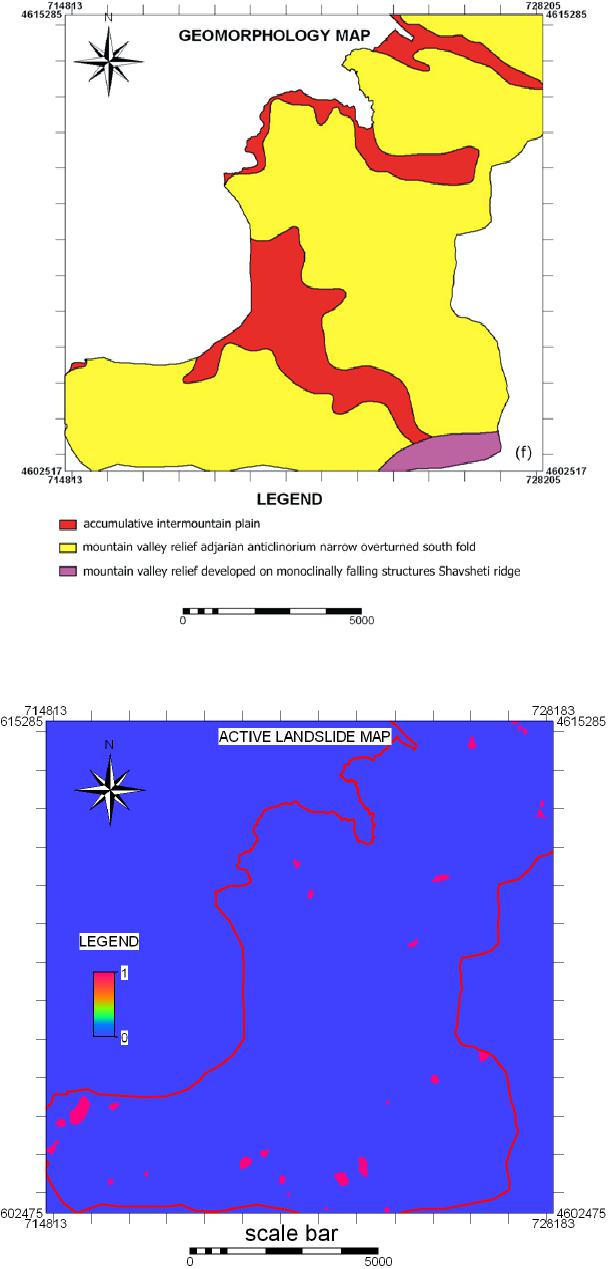 G. GAPRINDASHVILI ET AL. Figure 5 . Causal factor maps for slope (a), soil depth (b), aspect(c), land use (d), lithology (e), and geomorphology (f), respec- tively. Figure 6 . A ct ive landslide events extracted from the land- slide inventory over the study area. OPEN ACCESS IJG 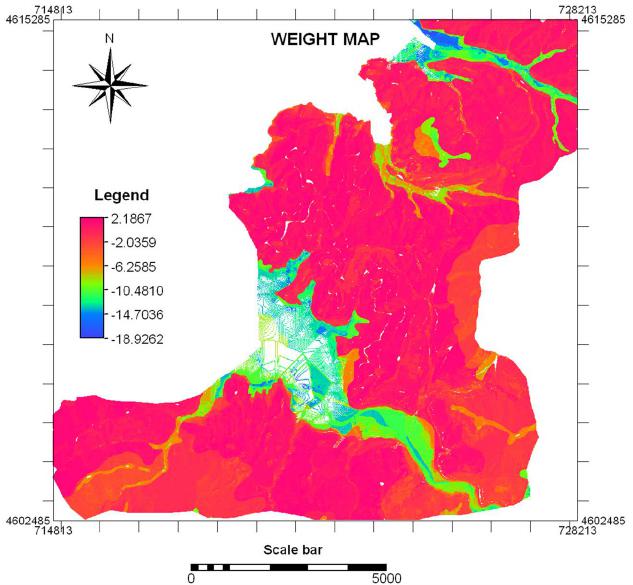 G. GAPRINDASHVILI ET AL. responding contributions, we calculated the weight of the six parameters described in Section of Methodology us- ing Equation (1). Various causal parameters had quite different influences on the landslide occurrence, either favorable or unfavorable [18]. The weight results for the six causal parameters were not shown here. B y adding up the weight of causal factors such as slope, soil depth, geomorphology, aspect, land use and lithology, we got the overall weight map, as shown in Figur e 7. From the calculated weights in Table 1, the most im- portant influe ntial s ubtypes o f causal factors related with landslide were recognized. As for the aspect factor, NW had the most important relation with landslides. The mountain class of geomorphology was more prone to landslide. Similarly, private land use and laterite loam and clay represented the highest susceptibility for landslide. The slope between 19 - 24 degrees and soil depth between 10 - 20 cm were most associated with landslide. 5.4. Susceptibility Assessment Based on the weights assignment, we carried out the susceptibility assessment. The final weights of the re- sulting map ranged from −18.9 to 2.2. Although the weight map (Figure 7) showed good indication of the quantitative landslide hazard in the study area, too wide range might make it difficult to utilize by decision mak- ers for development planning. Therefore, the hazard map was grouped into three simplified categories based on the histogram of the final weight map (Figure 7): high, moderate and low (Figure 8). Low hazard corresponded to the range o f (−18.9, −4), the moderate to (−4, 1.1) and the high one to (1.1, 2.2). The landslide susceptibility map gave the spatial dis- tribution of the relative susceptibility values for the whole area. Figure 8 indicated that the moderate and high susceptible zones had a more disperse pattern, compared with the low susceptibility zone. Based on the susceptibilit y in Figure 8, we got the statistics of area or percentage of Landslide Susceptibility Classes, which was given in Table 2. Results showed that the area of 27.7 km2 (28.4%) located in the high hazard zone, a more considerable area (53.2% of the total area) was assigned to moderate landslide susceptibility zone. 5.5. Assess ment an d Effec t Analy sis o f Model The success rate curve [19] is of importance to the veri- fication of susceptibility map of landslides, which was performed by comparing the known landslide location with the landslide susceptibility map. As such, the suc- cess rate had been applied in many previous studies [20,21] to assess landslide prediction model perfor- mance. In this paper, by assuming that the landslides were Figure 7 . The overall weig ht produced by a v eraging out the weights of six c ausal f ac tors. OPEN ACCESS IJG  G. GAPRINDASHVILI ET AL. Figure 8 . The sus cept ibi lit y ma p in our study area, which was cal culated from the haza r d index method appli ed in this s tudy. Table 1. Most infl uential type or value range versus ea ch causal factor. Causal factor Aspect Geomorphology L and-use Lithology Slope (degree) Soil depth (c m) Most influential subtypes NW mountain private use laterite loam and clay 19 - 24 10 - 20 Table 2. Area and percentage of landslide susceptibility classes. Classification Area (km2) % low hazard 18.0 18.4 mod er ate hazard 51.8 53.2 high hazard 27.7 28.4 Total area 97.5 100 linked to the causal factors (geomorphology, slope, as- pect, soil depth, land-use, and lithology) and that the ex- cessive rainfall serves as the trigger of the event, success rate allowed an estimate of a good fit of the model through statistical computations. As shown in Figure 9 (a), the obtained success rate curve was very steep in the former part, ind icative of great p redictive cap ability. Par- ticularly, roughly 82% of the pixels predicted a 100% landslide (indicated by red B in Figure 9(a)), whereas more or less 50% of the pixels with the highest weight value in the map showed 80% landslides (indicated by blue A in Figure 9(a ) ). Also, the area under the curve (AUC) was calculated to quantify the validity of the model [22,23]. Total area approaching 100 percent signifies perfect prediction while an area under 50 percent represented an invalid prediction. In this case, the area under the curve of the overall success rate curve was 72.35%, which implied that the model was valid. In this study, the effect analyses were conducted by exclusion of each factor in turn from the summation of the weight factors. Related success rates were drawn and the effect of each factor was evaluated using area under the curve calculation, which was given in F ig ure 9(b). Furthermore, there were no significant deviations of success rate curves by excluding any causal factor from the overall curve. Meanwhile, it can also be deduced from Figure 9(b) that the most important factor on landslide analysis, was the slope with AUC = 70.22%, then t he important factor is follo wed by soil dep th (AUC = 71.35%), lithology (AUC = 71.61%), land-use (71.99%), geomorphology (AUC = 72.73%), and the aspect (AUC = 72.80%). 5.6. Vulnerability Assessment Vulnerabilit y should be considered in the physical, social, environmental dimensions. However, due to the limited OPEN ACCESS IJG 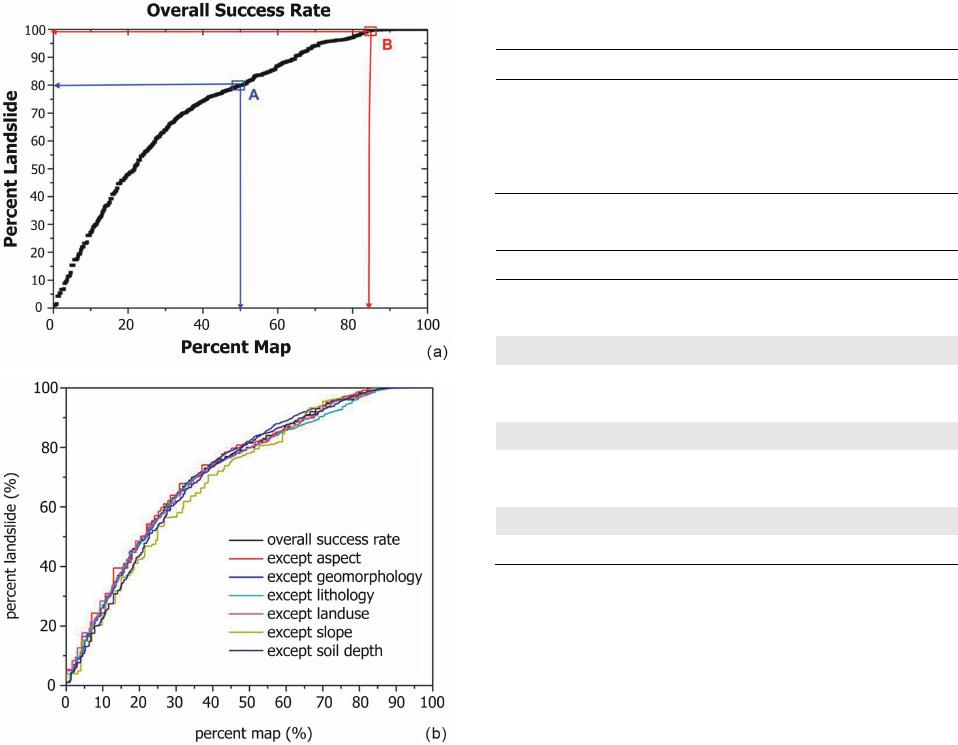 G. GAPRINDASHVILI ET AL. Figure 9 . Ca lculat e d o ver al l s uc ce ss r a te ba sed o n si x c aus al factors (a), superimposed by the effect analysis results (b), which was performed by exclusion of each factor every time. availability of da ta related to pop ulation and social p rop- erties, the physical vulnerability assessment has only been performed. The physical vulnerability was assessed based on elements at risk of building and land-use. The assessment results were given in Table 3. Within this study area, a total number of 9909 buildings were included. Amongst them, 3382 buildings (34.13%) represented high susceptibility class, followed by 4584 buildings as moderate susceptible. According to Table 4, within in study area, main land use types were categorized as either private or public owned by government. As for low susceptibility class with an area of 17.9 km2, the governmental land use ac- counts for about 26% and private about 23.3%. In mod- erate susceptibility class, with an area of 51.9 km2, the governmental land use accounts for about 26.6%, and private about 25.6%. For the high susceptibility class with an area of 27.6 km2, the governmental and private Table 3. Physical vulnerability results (number of build- ings). Susceptibil ity classificatio ns N umber of buildings Percentage High susceptibility 3382 34.13 Moderate susceptibility 4584 46.26 Low susceptibility 1943 19.61 Total 9909 100 Table 4. Physical vulnerability results (land use). Hazard * Landuse Area (km2) % Low hazard * government 4.7 26.0 Low hazard * private 4.2 23.3 Total Low susc eptibility class area 17.9 Moderate hazard * government 13.9 26.6 Moderate hazard * private 13.3 25.6 Total Moderate susceptibility class area 51.9 High hazard * government 1 1.0 39. 9 High hazard * private 11.3 40.9 Total High suscept ib il ity class area 27.7 Tot al a r e a of Khel v achauri 97.5 land use accounts for 39.9% and 40. 9 %, respectively. 6. Discussion and Conclusions The results showed that despite the operational and con- ceptual limitations, landslide hazard assessment should be a suitable, cost-effective aid to land-use planning and hazard reduction. By calculating the respective weight for six different causal factors, it was recognized the area with NW aspect, mou nt ain geomorphology, private land-use, laterite loa m and clay, 19 - 24 degree for slope and soil depth between 10 and 20 cm were among the most susceptible areas for landslide occurrence. Primarily due to the lack of reliable and high-resolution rainfall fields, few statistical models have included rainfall variables as explanatory variables. This was also the reason that this research did not take into account the rainfall as an approach for the landslide hazard and risk assessment. Moreover, the analysis was done in terms of physical vulnerability (by overlaying the number of buildings, including land-use data, in the dif- ferent hazardous areas). Landslide susceptibility maps are of great importance to planners and engineers for choosing suitable locations to implement eco-social developments. In this study, we found that about 28.4% of the area was prone to high landslide ris k. The final landslide susceptibility map, with the com- bination of all the weights, yielded a satisfactory predic- tion of the landslide with a success rate of 82%. The role OPEN ACCESS IJG  G. GAPRINDASHVILI ET AL. of geomorphology, soil depth, lithology, and slope served as very important factors for the landslide processes. The models were proven valid through the calculation of the area under the curve, i.e., all success rate curves occupy more than 72.35% of the total area. Effect analysis showed that slope played the most important role in the landslide analysis since slope bore the greatest weight. Therefore when all factor weights were added except for the weight of the slope, the resultant weight greatly di- minished which in turn reduced the percentages of landslide. Due to the lack of social, economic, environmental and physical vulnerability data, only building and land use vulnerability assessments were carried out using SMCE model in our study. We found that 34.13% of the numbers of buildings were represented as high suscepti- bility class. W e esti mated as well that i n hig h susceptib il- ity class there was 39.9% from the governmental land use and 40.9% from the private. The method presented here has a series of drawbacks, which should be taken into account. For instance, the landslide hazard map was only calculated from the oc- currence of active landslides. Other landslide activities should also be included for future research. Ho wever, the use of landslide hazar d index statistics in K helvachauri is useful for ranking them in order of importance for landslide risk reduction measures. The method allows evaluating which causal factor is responsible for high susceptible and vulnerable of landslides. I t sho uld also b e noted that the re sulting landslid e susceptibili ty value and the vulnerability were not static [15]. The landslide sus- ceptibility map and vulnerability value should therefore be updated regularly since these indicators had temporal variabilit y. For further study t o improve the v ulnerability assessment results, it is highly recommended that other factors such as river distance, number of population per household, climate data, history of landslide event, once become available, should be taken into account. This would make landslide data more reliable. This would make local (provincial and municipal) authorities accor- dingly produce logical la ndslide mitigation program. Ackno wledgements This work was car ried out under the auspices of the Min- istry of Science and Technology of China (Grant number: 2013CB733404). The authors wo uld like to thank Dr. C.J. Cees va n Westen and M s. Drs. N. C. King ma wit h Inter- national Institute for Geo-Information Science and Earth Observation (ITC), University of Twente, the Nether- lands for their kind suggestions and comments on the validation analysis. The authors would like to thank Na- tional Environmental Agency of Ministry of Environ- ment and Natural Resources Protection of Georgia for providing various datasets used in this s tudy. REFERENCES [1] A. Cleri ci, S. Perego, C. Tellini and P. Vescovi, “A Pro- cedure for Landslide Susceptibility Zonation by the Con- ditional Analysis Method,” Geomorphology, Vol. 48, No. 4, 2002, pp. 349-364. http://dx.doi.org/10.1016/S0169-555X(02)00079-X [2] E. M. Lee and D. K. C. Jones, “Landslide Risk Assess- ment,” Thomas Telford, London, 2004. http://dx.doi.org/10.1680/lra.31715 [3] W. J. Kockel man, “Some Techniques for Redu cing Land - slide Hazards,” Association of Environmental and Engi- neering Geologists, Vol. 23, No. 1, 1986, pp. 29-52 [4] UNDRO, “Mitigating Natural Disasters,” Phenomena, Effects and Options United Nations, New York, 1991. [5] C. J. Van Westen and M. T. J. Terlien, “An Approach towards Det erministic Lan dslide Hazard Anal ysis in GIS : A Case Stud y from Man izales, Col ombia,” Earth Surface Processes and Lan dforms, Vol. 21, No. 9, 1996, pp. 853- 868. [6] V. Moon and H. Blackstock, “A Methodology for As- sessing Landslide Hazard Using Deterministic Stability Models,” Natural Hazards, Vol. 32, No. 1, 2004, pp. 111- 134. http://dx.doi.org/10.1023/B:NHAZ.0000026793.49052.87 [7] J. W. Godt, R. L. Ba um, W. Z. Sava ge, D. Salciarini, W. H. Schulz and E. L. Harp, “Transient Deterministic Shal- low Landslide Modeling: Requirements for Susceptibility And Hazard Assessments in a GIS Framework,” Engi- neering Geology, Vol. 102, No. 3-4, 2008, pp. 214-226. http://dx.doi.org/10.1016/j.enggeo.2008.03.019 [8] A. Carrara, M. Cardinali, R. Detti, F. Guzetti, V. Pasqui and P. Reichenbach, “GIS Techniques and Statistical Models in Evaluating Landslide Hazard,” Earth Surface Processes and Lan dforms, Vol. 16, No. 5, 1991, pp. 427- 445. http://dx.doi.org/10.1002/esp.3290160505 [9] L. Luzi and P. Floriana, “Application of Statistical and GIS Techniques to Slope Instability Zonation (1: 50,000 Fabriano Geological Map Sheet),” Soil Dynamics and Earthquake Engineering, Vol. 15, No. 2, 1996, pp. 83-94. http://dx.doi.org/10.1016/0267-7261(95)00031-3 [10] A. Burton and J. C. Bathurst, “Physically Based Model- ing of Shallow Landslide Sediment Yield at a Catchment Scale,” Environmental Geology, Vol. 35, No. 2-3, 1998, pp. 89-99. http://dx.doi.org/10.1007/s002540050296 [11] F. Guzzetti, A. Carrarra, M. Card inali and P. Reich enbach , “Landslide Hazard Evaluation: A Review of Current Techniques an d Their Application in a Multi-Scale Study, Central Italy,” Geomorphology, Vol. 31, No. 1-4, 1999, pp. 181-216. http://dx.doi.org/10.1016/S0169-555X(99)00078-1 [12] J. Choi , H. J. Oh, J. S. Won an d S. Lee, “Validation of an Artificial Neural Network Model for Landslide Suscepti- bility Mapping,” Environmental Earth Sciences, Vol. 60, 3, 2010, pp. 473-483. http://dx.doi.org/10.1007/s12665-009-0188-0 [13] B. Pradh an and S. Lee, “Regional Landslide Susceptibility Analysis Using Back-Propagation Neural Network Model at Cameron Highland , Malaysia,” Landslides, Vol. 7, No. OPEN ACCESS IJG  G. GAPRINDASHVILI ET AL. 1, 2010, pp. 13-30. http://dx.doi.org/10.1007/s10346-009-0183-2 [14] K. Sassa, S. Tsuchiya, K. Ugai, A. Wakai and T. Uch i- mura, “Landslides: A Review of Achievements in the First 5 Years (2004-2009),” Landslides, Vol. 6, No. 4, 2009, pp. 275-286. http://dx.doi.org/10.1007/s10346-009-0172-5 [15] E. A. Castellanos Abella and C. J. V an Western, “Gener- ation of a Landslide Risk Index Map for Cuba Using Sp a- tial Multi-Criteria Evaluation,” Landslides, Vol. 4, No. 4, 2007, pp. 311-325. http://dx.doi.org/10.1007/s10346-007-0087-y [16] R. Chowdhury and P. Flentje, “Role of Slope Reliability Analysis in Lands lide Ri sk Manage ment,” Bulletin of En- gineer ing Geology and the Environment, Vol. 62, No. 1, 2003, pp. 41-46. [17] S. Lee and J. A. Talib, “Probabilistic Landslide Suscepti- bility and Factor Effect Analysis,” Environmental Geolo- gy, Vol. 47, No. 7, 2005, pp. 982-990. http://dx.doi.org/10.1007/s00254-005-1228-z [18] E. A. Castellanos Abella and C. J. Van Western, “Qualit- ative Landslide Susceptibility Assessment by Multicrite- ria Analysis: A Case Study from San Antonio del Sur, Guantánamo, Cuba,” Geomorphology, Vol. 94, No. 3-4, 2008, pp. 453-466. http://dx.doi.org/10.1016/j.geomorph.2006.10.038 [19] C. F. Chung and A. G. Fabbri, “Probabilistic Prediction Models for Landslide Hazard Mapping,” Photogramme- tric Engineering & Remote Sensing, Vol. 65, No. 12, 1999, pp. 1389-1399. [20] J. Duan and G. E. Gra nt, “Shallow Landsli de Delineation for Steep Forest Watersheds Based on Topographic At- tributes and Probability Analysis,” In : J. P. Wilson and J. C. Gallant, Ed ., Terrain Analysis—Principles and Appli- cations, John Wiley & Sons: New York, 2000, pp. 311- 329. [21] S. Lee and N. T. Dan, “Probabilistic Landslide Suscepti- bility Mapping in the Lai Chau Province o f Vietnam: Fo- cus on the Relationship between Tectonic Fractures and Landslides,” Environmental Geology, Vol. 48, No. 6, 2005, pp. 778-787. http://dx.doi.org/10.1007/s00254-005-0019-x [22] S. Lee, “Application of Likelihood Ratio and Logistic Regression Models to Landslide Susceptibility Mapping in GIS,” Environmental Management, Vol. 34, No. 2, 2004, pp. 223-232. http://dx.doi.org/10.1007/s00267-003-0077-3 [23] R. Dahal, S. Hasegawa, A. Nonomura, M. Yamanaka, T. Masuda and K. Nishino, “GIS-Based Weights-of-Evi- dence Modelling of Rainfall-Induced Landslides in Small Catchments for Landslide Susceptibility Mapping,” En- vironmental Geology, Vol. 54, No. 2, 2008, pp. 314-324. http://dx.doi.org/10.1007/s00254-007-0818-3 OPEN ACCESS IJG
|