Internationa l Journal of Geosciences, 2014, 5, 5-11
Published Online January 2014 (http://www.scirp.org/journal/ijg)
http://dx.doi.org/10.4236/ijg.2014.51002
Assessment and Evaluat ion of Band Ratios, Brovey and
HSV Techniques for Lithologic Discrimination and
Mapping Using Landsat ETM+ and SPOT-5 Data
Ahmed Madani1,2
1Water Research Center, King Abdul Aziz University, Jeddah, KSA
2Geology Department, Facult y of Science, Cairo Uni vers ity, Giza, Egypt
Email: aamad ani18 @ hotmail.com
Received June 24, 2013; revised July 23, 2013; accepted August 21, 2013
Copyright © 2014 Ahmed Madani. This is an open access article distributed under the Creative Commons Attribution License, which
permits unrestricted use, distribution, and reproduction in any medium, provided the original work is properly cited. In accordance o f
the Creative Commons Attribution License all Copyrights © 2014 are reserv ed for SCIRP and the owner o f the intell ectual propert y
Ahmed Mad ani. All Copyrig ht © 201 4 are guarded by law and by SCIRP as a guardian.
ABSTRACT
This study aims to assess and to evaluate band ratios, brovey and HSV (Hue-Saturation-Value) techniques for
discrimination and mapping the basement rock units exposed at Wadi Bulghah area, Saudi Arabia using mul-
tispec tral Landsa t E TM + and SPOT-5 pa nchro matic data. FieldSpec instrument is utilized to collect the spectral
data of diorite, marble, gossan and volcanics, the main rock units exposed at the study area. Spectral profile of
diorite exhibits very distinguished absorption features around 2.20 μm and 2.35 μm wavelength regions. These
absorption features lead to lowering the band ratio values within the band-7 wavelength region. Diorite intru-
sions appear to have grey and dark grey image signatures on 7/3 and 7/2 band ratio images respectively. On the
false color composite ratio image (7/3:R; 7/2:G and 5/2:B), diorite, marble, gossan and volcanics have very dark
brown, dark blue, white and yellowish brown image signatures respectively. Image fusion between previously
mentioned F CC ra tio image and high spatial r esolutio n ( 5 meters) SPOT-5 panchromatic image is carried out by
using brovey and HSV transformation methods. Visual and statistical assessment methods prove that HSV fused
image yields best image interpretability results rather than brovey image. It improves the spatial resolution of
the original FCC ratios image with acceptable spectral preservation.
KEYWORDS
Landsat ETM+ Data; SPOT-5 Panchromatic Image; Band Ratios-Brovey and HSV Tec hni ques
1. Introduction
The Neoproterozoic Arabian Shield is composed of five
distinct terranes separated by four ophiolite-bearing su-
ture zones: three ensimatic island arc terranes in the
western part of the shield (Asir, Hijaz and Midyan) and
Afif and Ar Rayn terranes of continental affinity further
to the east [1-3]. Wadi Bulghah area is located at the
western part of the Afif terrane to the east of the Nabita h
suture zone, approximately 520 km west-northwest of
Riyadh city, the capital of Saudi Arabia. Figure 1 shows
3D perspective view of Landsat false color composite
(FCC) image (bands 7, 4 & 2; RGB) draped over Shuttle
Radar Topography Mission (SRTM) digital elevation
model. It shows the four main different rock units ex-
posed at the study area; diorite, marble, gossan and Hu-
layfah volcanics. Hulayfah volcanics, the oldest rock
units exposed at the study area, are made up of the older
Afna Formation and the younger Nuqrah Formation, in-
truded by syn- to late-tectonic diorite intrusions. Ande-
sitic volcanic rocks and volcaniclastic derivatives com-
monly occur in the western and eastern part of the area
and may represent rocks of Afna formation. Nuqrah for-
mation is mostly represented by acidic volcaniclastic
rocks including agglomerate, fine laminated tuffs and
intercalations of jasper or cherty tuffs. Discontinuous
small lenses of gossans are mostly exposed at the western
part of the study area. Discontinuous marble bands
forming nearly N-S to NNW trending ridges were ex-
posed in the central part of the study area to the east of
OPEN ACCESS IJG
A. MADANI
6
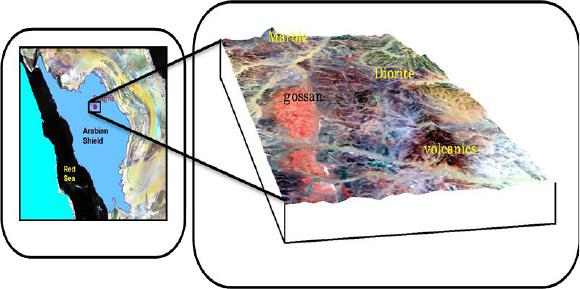
Figure 1. 3D per specti ve view of Lan dsat false color composite (FCC) image (bands 7, 4 & 2; RGB) draped over Shuttle
Radar Topography Mission (SR TM ) dig it al el ev ati o n mode l sh ow s th e dif fe re nt ro ck u nit s ex po se d at t he st udy are a.
diorite intrusions. The study area hosts mainly syn- to
late tectonic gold-bearing diorite intrusions. Gold depo-
sits at Bulghah area are considered to be mesothermal
gold deposits, a major type of gold mineralization in the
Arabian Shield, and particularly abundant in the western
part of the Afif terrane [4].
Reference [5] studied in detail the spectral characte-
ristics of the mineralized diorite intrusions exposed at
Bulghah mine area, Saudi Arabia, using FieldSpec spec-
troradiometer and Landsat ETM+ data. They categorized
the diorite intrusio ns at the study area into (group A; lo w
general reflectance values) and (group B; high reflec-
tance values with three main absorption features around
1.45 μm, 2.20 μm and 2.35 μm wavelength regions).
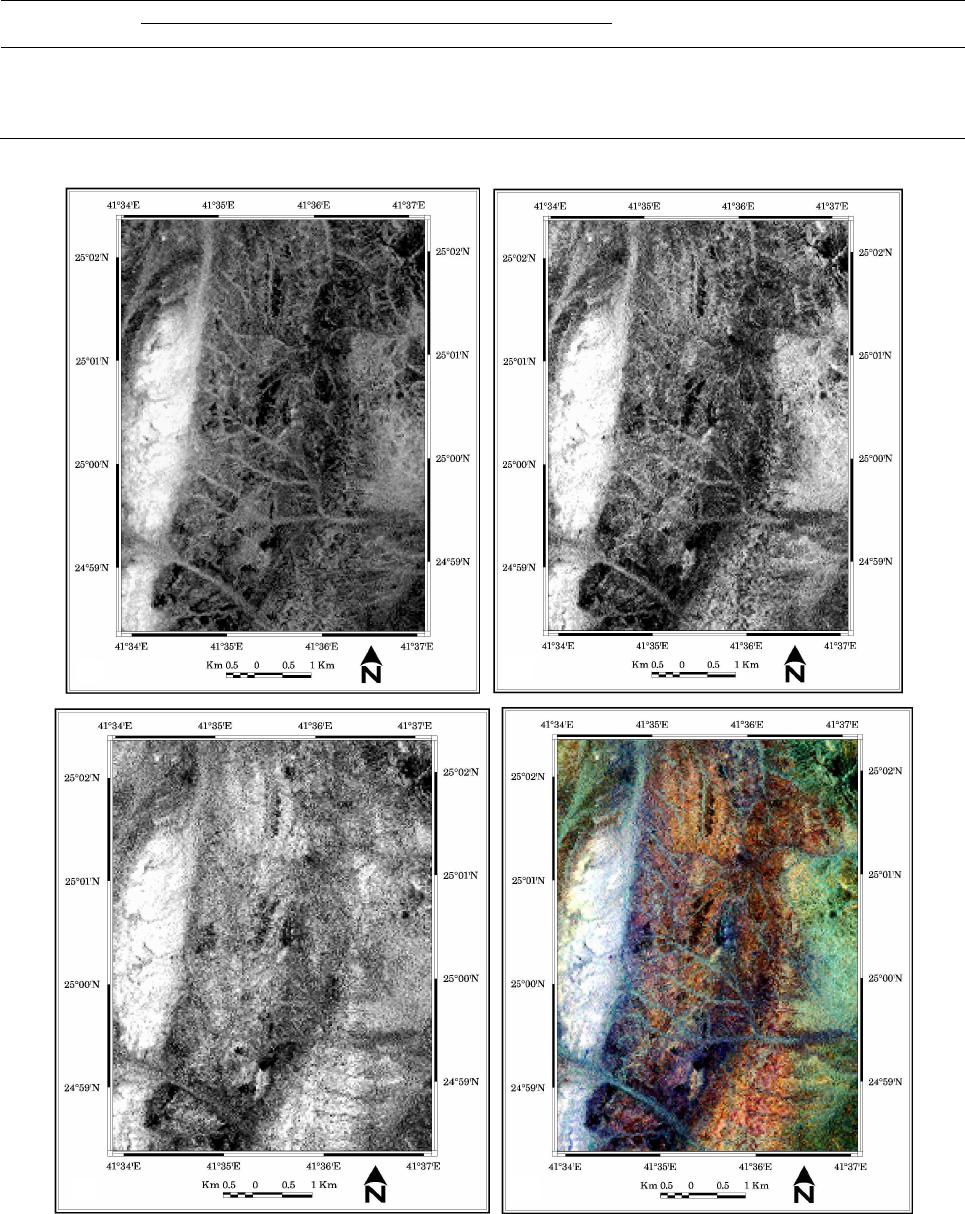
Band ratio and image fusion are the most important
techniques used for lithologic discrimination and geo-
logical mapping. Band ratio can be simply generated by
dividing the reflectance value of each pixel in one band
by the reflectance value of the same pixel in another
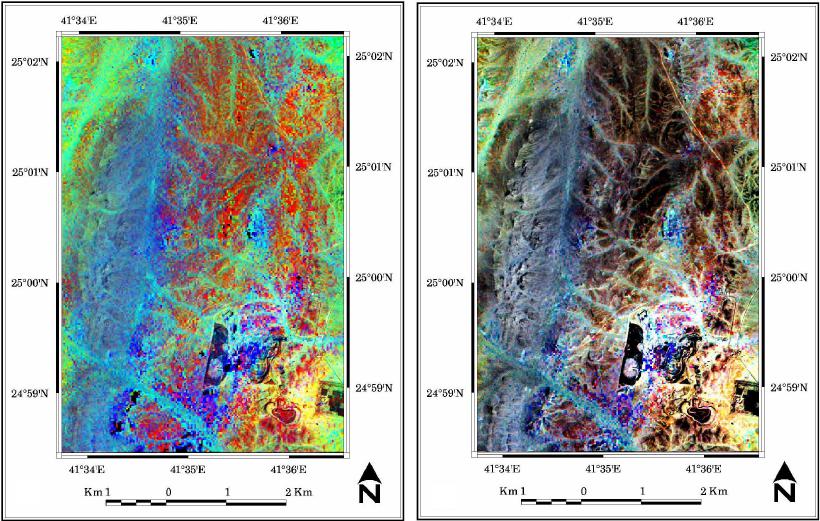
band [6]. Image fusion technique is a process of combin-
ing multi-spectral and panchromatic images to produce a
new scene which has the best of original images. Image
fusion algorithms can be categorized into low (pix-
el-level), mid (feature-level) and high (symbolic) level.
Many algorithms are developed to fuse high spectral res-
olution image with the high spatial resolution panchro-
matic image such as brovey, IHS (Intensity-Hue-Sat ura-
tion), P CA (Principal-Co mpo ne nt -Analyses), HSV (Hue-
Saturation-Value) and Wavelet transform. Merging infor-
mation from different imaging sensors involves two dis-
tinct steps [7]. First, the digital images from different
senso rs a re ge ometrically registered to one another. Next,
the information content spatial and spectral is mixed to
generate a single image that contains the best of both sets.
The merging of the three multispectral band s with another
image channel is ca rried out by inte nsity substitutio n [8].
The present study aims to: 1) understand the spectral
characteristics of diorite, gossan, marble and volcanics,
the main rock units exposed at the study area, using
FieldSpec measurements and apply the acquired know-
ledge for rock discrimination using band ratio tech-
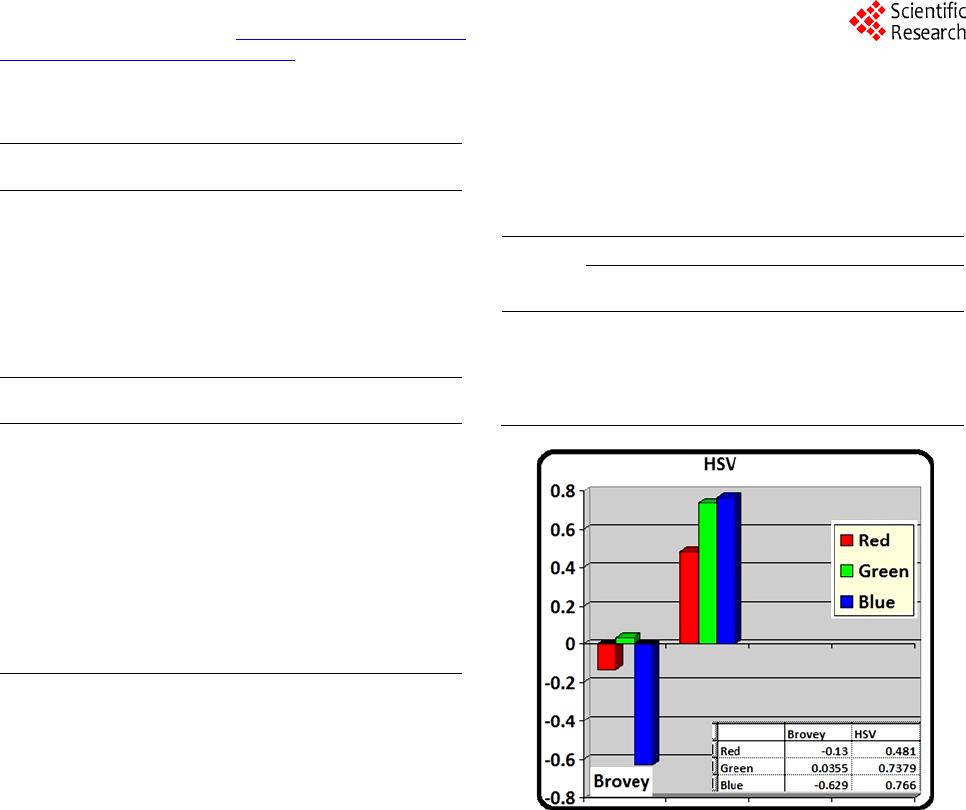
nique; 2) assess the accuracy of brovey and HSV image
fusion techniques for mapping purposes visually and
statistically.
2. Materials and Methods
Table 1; shows the technical characteristics of Landsat
ETM+ and SPOT-5 data used throughout this study.
Landsat ETM+ scene has eight broad spectral bands. Six
of these bands detect visible, Near Infrared (NIR) and
Short Wave Infrared (SWIR) radiations (0.45 μm to 2.35
μm) with 30 meters spatial resolution. Band seven de-
tects thermal radiation with 60 meters spatial resolution
whereas band eight has 15 meters spatial resolution. The
six non-thermal landsat bands are used to generate band
ratio images. SPOT 5 was launched on May 4, 2002 and
has two high resolution geometrical (HRG) instruments.
SPOT-5 records data in two different modes, low-reso-
lution multispectral mode (10 m and 20 m) and high-
resolution panchromatic mode (2.5 to 5 m). High spatial
resolution SPOT-5 panchromatic band (5 m) is used in
the pre se nt study for mergi ng pr o ce ss.
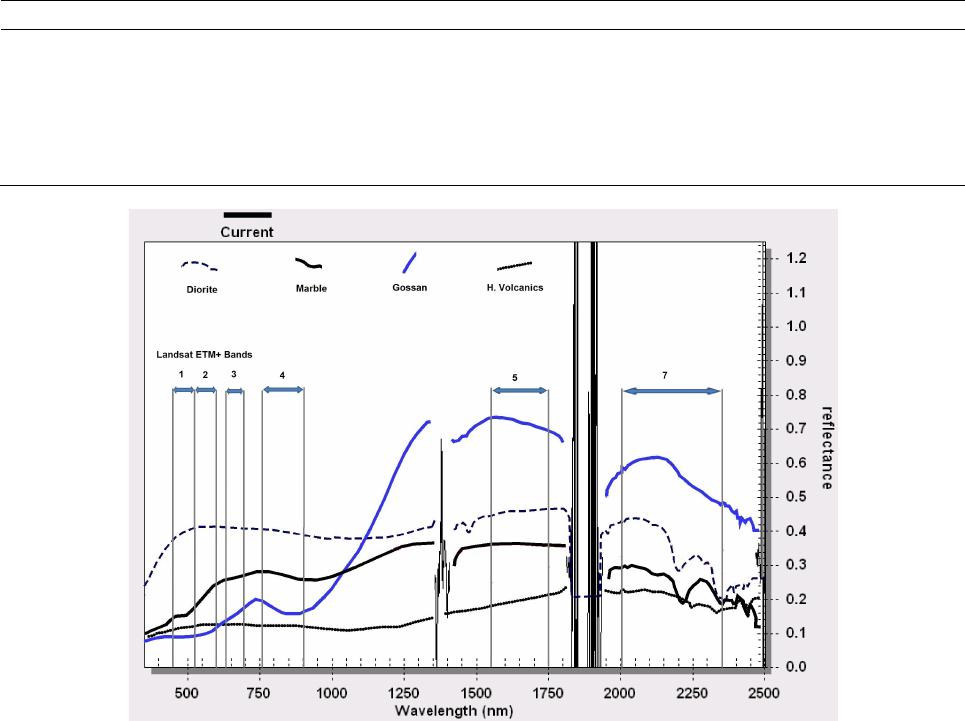
2.1. Spectral Characteristics of Ro c ks
Throughout the present study, FieldSpec spectroradi-
ometer instrument is used to collect the spectral data for
diorite, marble, gossan and volcanic rock samples. The
FieldSpec instrument is specifically designed for field
enviro nment to acquire vi sible near-infrared (VNIR) and
shortwave infrared (SWIR) spectra [9]. In the present
study, the spectral data collection took place under suita-
ble weather conditions (sunny, cloud-free day). Data
measurements should be resampled as “RTRTRTRT”
format in which “R” refers to reference spectra on a
white panel whereas “T” refers to the measured rock
sample. Figure 2 shows the compiled FieldSpec profiles
for diorite, marble, gossan and volcanics. Three main
OPEN ACCESS IJG
A. MADANI
7
Table 1. Landsat ETM+ and SPOT-5 panchromatic band technical characteristics.
Sensor/Satellite Electromagnetic Spectrum Pixel Size Spectral Bands
L andsat ET M+ Multi-sp ectral 30 m
Band 1 (0.45 - 0.52 µm)
Band 2 (0.52 - 0.60 µm)
Band 3 (0.63 - 0.69 µm)
Ban d 4 ( 0.76 - 0.90 µm)
Band 5 (1.55 - 1.75 µm)
Band 7 (2.08 - 2.35 µm)
SPOT-5 Panchromatic 5 m 0.48 - 0.71 µm
Figure 2 . Compil ed sp ectr al profiles for diorite, marble, gossan a nd Hulayfah volcanics collect ed using F ieldSpec instrument.
absorption features around 1.45, 2.20 and 2.35 μm wa-
velength regions are characterized the spectral of profile
of diorite intrusion with high reflectance values (~40%).
Marble FieldSpec spectral profile shows an open absorp-
tion feature around 0.90 μm wavelength region in addi-
tion to, broad absorption feature near 2.2 μm wavelength
region. The spectral profile of gossan is characterized b y
increased reflectance values from 10% in VNIR to 70%
around band 5 wavelength region. It shows small open
absorption feature near 0.85 μm. The FieldSpec spectral
profile of Hulayfah volcanics shows general low reflec-
tance val ue s t hr o u gho ut t he VNI R and SW I R wavel e n gt h
regions with two small absorption features around 2.25
μm and 2.35 μm wavelength regions.
2.2. Landsat Image Processing
Before performing band ratio technique, Landsat ETM+
reflectance calculations are carried out. The aim of ETM+
data reflectance calculations is to convert the DN values
of Landsat ETM+ image subset to reflectance data used
later to pe rform band ratios tec hnique [10,11].
Band Ratio Technique
In the present study, non-thermal Landsat ETM+ bands
are used to generate the ratio images using ENVI v.4.5
software. Visual inspection of the generated band ratio
images revealed that 7/3, 7/2 and 5/2 band ratio images
are the most informative ratios for rock discrimination at
the study area. Table 2; shows the reflectance and band
ratios values for diorite, marble, gossan and volcanics
calculated based on FieldSpec measurements. The bright
image signatures of gossan on 5/2, 7/2 and 7/3 (F ig ures
3(a)-(c)) are attributed to high ratios values 7.4, 4.8 &
3.2 respectively. Diorite and volcanics have low ratios
value s and the y appe ar to have gre y and da rk gre y image
signatures on the above mentioned ratio images. The
information contained in the above three band ratio im-
ages are integrated into one false color composite ratio
image (7/3:R; 7/2:G and 5/2:B; Figure 3(d)). This FCC
ratios image discrimi nates easil y gossan, dio rite, vol ca nics
OPEN ACCESS IJG
A. MADANI
8
Table 2. Reflectance and band rati o s values of different rock units calcul a ted b a sed on FieldSpec measurements .
Rock unit Refl. % (based on Fi eldSp ec data) Ratio 7/3 Ratio 7/2 Ratio 5/2
Ban d 2
Ban d 3
Ban d 5
Ban d 7
Gossan
0.10
0.15
0.74
0.48
3.2
4.8
7.4
Ma rb l e
0.23
0.26
0.36
0.18 (AF)
0.692
0.782
1.56
Diorite 0.41 0.41 0.46 0.28 (AF)
0.682
0.628
1.12
Volcanics
0.12
0.12
0.20
0.16 (AF)
1.33
1.33
1.66
AF: Values at absorption features.
(a)
(b)
(c)
(d)
Figure 3 . (a) 5/2 ban d ratio i mage ; (b) 7/ 2 band ra tio i mage; (c ) 7/ 3 band ratio i mage a nd (d) False color c omposit e band r a-
tios i mage 7 /3, 7/2 & 5/2 i n RGB respectively covering the study area.
OPEN ACCESS IJG
A. MADANI
9
and marble by white, very dark brown, yellowish brown
and dark blue image signatures, respectively.
2.3. Image Fusion Techniques
Image fusion is the process of combining information
from two or more images into a single composite image
that is more informative and is more suitable for visual
interpretation [12]. The fused images can provide infor-
mation that sometimes cannot be observed in the indi-
vidual input images. In the present study false color
composite Landsat ratios image (7/3, R; 7/2, G & 5/2, B)
is fused with the high spatial resolution (5 meters) SPOT
panchromatic image using Brovey and HSV transforma-
tion methods. Results of the two fusion transformation
methods are assessed statistically to select the most in-
terp r etable fused image used for geological mapping.
The Bro vey trans for m is the s imple st fus ion te chniq ue in
which the grey levels (GL) values for each band are di-
vided by the sum of all the color layers (Red, Green and
Blue) and then multiply by the intensity layer (SPOT-5
panchromatic image). The HSV color fusion system is
closely related to IHS fusion method, in which “H” is
hue, “S ” is s at ur at io n a nd “V” i s val ue. D ur i ng the f us io n
process the component “V” is substituted by a high spa-
tial resolution SPOT-5 panchromatic image. Reference
[13] merged a false color composite ratio image (5/7, 3/1
& 4/5) with the panchromatic high spatial resolution
scanned aerial photograph using Hue, Saturation, Value
(HSV) merger to produce 1:20,000 geological map for
the hydrothermal alteration zones along the Haimur gold
mine area, south Eastern Desert, Egypt. The merging
process was performed in three steps: 1) transformation
of the multispectral ratios image from RGB to HSV
space; 2 ) sub stit utio n o f the i nt ensi ty va lue fro m the high
spatial resolution SPOT-5 panchromatic band and 3)
back transformation to RGB.
Fusion Results and A ssessment
Several authors dealt with the assessment and evaluation
of fusi on te chnique s; [1 4-16]. Figures 4(a) and (b) show
the re s ult s of b r ovey a nd HS V fus ed i ma ge s r esp e ct i vel y.
Visual and statistical assessment methods are used to
ensure the improvement of spatial resolution and preser-
vation of spectral characteristics of the original band ra-
tios false color composite image.
Visual inspection of the brovey fused image revealed
the follo wing: 1) the majority o f the fused ima ge has lo w
spatial resolution except the gossan ridges at the western
side of the study area; 2) no preservation of the spectral
characteristics of the original FCC ratios image. These
observations are confirmed statistically using correlation
coefficient values (CC) (Table 3). The correlation coef-
ficient (CC) measures the correlation between the origi-
nal and the fused images. The ideal CC value is 1. Table
3 shows the values of the correlation coefficient for bro-
vey image are range between 0.035564 and 0.130294
(Figure 5) which indicates large loss of spectral charac-
teristics of original ratios image during brovey transfor-
(a)
(b)
Figure 4. (a) Brovey fused image displayed in the band combination: red, green & blue. (b) HSV fused image for the study
area displayed in th e band combination: red, green & blue.
OPEN ACCESS IJG
Internationa l Journal of Geosciences, 2014, 5, 5-11
Published Online January 2014 (http://www.scirp.org/journal/ijg)
http://dx.doi.org/10.4236/ijg.2014.51002
Table 3. Statistical characteristics of the fused images.
Fusion
Method Mean St.dev. Eigenvalue
Bro v ey
38.783292 13.525529 280.10 7921
34.940075 8.487679 75.304632
30.324068 12.623910 58.931181
HSV
86.404401 47.404949 4641.7 29352
81.793209 44.233003 1041.0 42568
71.131851 42.075900 291.39 7247
Fusion
Method Corre lation Coefficient (CC)
HSV
Correlation B and 1 Band 2 B and 3
Ban d 1 1.000000 0.737949 0.481477
Ban d 2 0.737949 1.000000 0.766351
Ban d 3 0.481477 0.766351 1.000000
Bro v ey
Correlation B and 1 Band 2 B and 3
Ban d 1 1.000000 0.130294 0.629071
Ban d 2 0.130294 1.000000 0.035564
Ban d 3 0.629071 0.035564 1.000000
mation.
Visual inspection of HSV fused image revealed the
following: 1) HSV improved the spatial resolution and
maintain it all over the entire image. 2) Improvement of
the spatial resolution of marble ridges. They appear to
have deep blue color trending in N-S direction. 3) There
is some loss of the spectral characteristics of rock units
e.g. gossan ridges have white image signature on the
original FCC band ratios image and grey image signature
on HSV fused image. 4) Diorite and volcanics still
maintain their o riginal color. Also these o bservations are
confirmed statistically by (CC) values (Table 3). The
values of the correlation coefficient are ranges between
0.481477 and 0.766351 (Figure 5) which indicates a
moderate corr elation to the or iginal data. Fig ure 5 shows
the correlation coefficient between the original ratio im-
age and brovey and HSV fused images. HSV fused im-
age shows the high correlation coefficient compared to
bro ve y fuse d i ma ge . It gives b est r esults for i nterp retab il-
ity than brovey image (Table 4). It preserves for large
extent the spectral characteristics of the original FCC
ratios image.
3. Conclusion
This study proved the usefulness of band ratios and HSV
fusion technique for lithologic discrimination and map-
ping the different basement rock units exposed at Wadi
Bulghah area, Saudi Arabia. FieldSpec profiles are uti-
lized to understand the spectral characteristics of diorite,
Table 4. Image interpretability of Brovey and HSV fused
i mage s .
Rock Units
Brovey HSV
Spatial
Improvement Spectral
Preserva tion
Spatial
Improvement
Spectral
Preserva tion
Diorite X X good good
Volcanics X X good good
Ma rb l e X X good good
Gossan good X good X
Figure 5. Correlation Coefficient of brovey and HSV fused
i mage s .
gossan, marble and volcanics and to select the optimum
band ratios used for lithologics discrimination. Image
fusion between F CC r atio i mage ( 7 /3, R; 7/2 , G & 5/2, B)
and high spatial resolution (5 meters) SPOT-5 panchro-
matic image is carried out by using Brovey and HSV
transfor mation methods. Visu al and statistical as ses smen t
of fusion methods revealed that HSV fused image gave
best interpre tability results. It i mproved spatial re solution
and maintained at large extent the spectral preservation
of the original F CC ra tio image.
REFERENCES
[1] A. M. Al Shanti and A. H. Mitchell, “Late Precambrian
Subduction and Collision in the Al Amar-Idsas Region,
Arabian Shield, Kingdom of Saudi Arabia,” Tectono-
physi cs , Vol. 30, 3-4, 1976, pp. 41-47.
[2] A. R. Bakor, I. G. Gass and C. Neary, “Jabal Al Wask,
Northwest Saudi Arabia, an Eocambrian Back-Arc Ophi-
olite,” Earth and Planetary Science Letters, Vol. 30, 1,
OPEN ACCESS IJG
A. MADANI
11
1976, pp. 1-9.
http://dx.doi.org/10.1016/0012-821X(76)90002-9
[3] V. E. C amp , “Isl and-Arcs and Their Role in the Evolution
of the Western Arabian Shield ,” Geological Society of
America Bulletin, Vol. 95, 8, 1984, pp. 913-921.
http://dx.doi.org/10.1130/0016-7606(1984)95<913:IAAT
RI>2.0.CO;2
[4] A. C. Barnicoat , S. R. Freeman, I. H. Henderson and G.
M. Phillips, “Structural Controls on Gold Mineralization
in the Bulgah Prospect,” Rock Deformation Research
Leeds University, Report 03, 1989, p. 101.
[5] A. Madani and H. Harbi, “Spectroscopy of the Minera-
lized Tonalite-Diorite Intrusions, Bulghah Gold Mine
Area, Saudi Arabia: Effects of Opaques and Alteration
Products on Fieldspec Data,” Ore Geology Reviews, Vol.
44, 2012, pp. 148-157.
http://dx.doi.org/10.1016/j.oregeorev.2011.09.013
[6] S. Drury, “Image Interpretation in Geology,” 2nd Edition,
Chapman and Hall, London, 1993.
[7] P. S. Chavez and J. Bowell, “Comparison of the Spectral
Information Content of Landsat Thematic Mapper and
SPOT for Three Different Sites in the Phoenix, Arizona
Region,” Photogrammetric Engineering & Remote Sens-
ing, Vol. 54, No. 12, 1988, pp. 1699-1708.
[8] V. K. Schettigara, “A Generalized Component Substitu-
tion Technique for Spatial Enhancement of Multispectral
Mages Using Higher Reso lution Data,Photogrammetric
Engineering & Remote Sensing, Vol. 58, No. 5, 1992, pp.
561-567.
[9] ASD, “FieldSpec® 3 User Manual,” ASD Inc., Boulder,
2007.
[10] P. Curran, “Principles of Remote Sensing,” Longman
Scient ific & Technical, Harlow, 1985.
[11] W. G. Rees, “Physical Principles of Remote Sensing,”
Cambridge University Press, Cambridge, 1990.
[12] A. Pohl and L. Van Genderen, “Review Article Multi-
sensory Image Fusion in Remote Sensing: Concepts, Me-
thods and Applications,” International Journal or Remote
Sensing, Vol. 19, No. 5, 1998, pp. 823-854.
http://dx.doi.org/10.1080/014311698215748
[13] A. Madani, E. Abdel Rahman, K. Fawzy and A. Ema m,
Mapping of the Hydrothermal Alteration Zones at Hai-
mur Gold Mine Area, So uth Eastern Desert, Egypt Using
Remote Sensing Techniques,” The Egyptian Journal of
Remote Sensing & Space Sciences, Vol. 6, 2003, pp. 47-
60.
[14] E. Marcelino, A. Formaggio and E. Maeda, “Landslide
Inventory Using Image Fusion Techniques in Brazil,” In-
ternational Journal of Applied Earth Observation and
Geoinformation, Vol. 11, 3, 2009, pp. 181-191.
[15] S. Klonus and M. Ehlers , “Performance of Evaluation
Methods in Image Fusion,” 12th International Confe-
rence on Information Fusion, Seattle, 6-9 July 2009, pp.
1409-1416.
[16] M. Yakhdani, and A. Azizi, “Quality Assessment of Im-
age Fusion Techniques for Multisensory High Resolution
Satellite Images (Case Study: IRS-P5 and IRS-P6 Satel-
lite Images),” ISPRS TC VII Symposium, Vol. 39, 2010,
pp. 204-209.
OPEN ACCESS IJG