 Journal of Computer and Communications, 2014, 2, 20-24 Published Online January 2014 (http://www.scirp.org/journal/jcc) http://dx.doi.org/10.4236/jcc.2014.22004 OPEN ACCESS JCC Characteristic Analysis of White Gaussian Noise in S-Transformation Domain Xinliang Zhang1, Yue Qi1, Mingzhe Zhu1,2 1Department of Electronic Engineering, Xidian University, Xi’an, China; 2The Ministry Key Laboratory of Electronic Information Countermeasure and Simulation, Xidian University, Xi’an, China. Email: zxl_xddc@foxmail.com Received October 2013 ABSTRACT The characteristic property of white Gaussian noise (WGN) is derived in S-transformation domain. The results show that the distribution of normalized S-spectrum of WGN follows distribution with two degrees of free- dom. The conclusion has been confirmed through both theoretical derivations and numerical simulations. Com- bined with different criteria, an effective signal detection in S-transformation can be realized. KEYWORDS Signal Detection; S-Transform; White Gaussian Noise; Distribution 1. Introduction THE S-transform(ST) has been well studied since it was proposed by R. G. Stockwell in 1996 [1] and has already found applications in many fields such as geophysics [2], mechanical systems [3] and medical signal analyses [4]. The signal processing framework in S-transformation domain is under building and more and more ST based methods are proposed. The most contributive works among them were conducted by C. R. Pinnegar who ex- tended the original ST to generalized ST [2] and pre- sented several kinds of useful STs for specific conditions, such as the asymmetric ST [2], the bi-Gaussian ST [5] and the complex ST [6]. Other outstanding works were concentrated on ST based time-frequency filtering [7], the side effects of inverse ST [8], ST based instantaneous frequency estimation [9] and ST based pattern recog- nition [10,11]. However, the noise analysis in S-trans - formation domain, which is the essential problem for signal detection, has not been well studied yet. [11] pre- sented an illuminating idea for noise distribution in a specific generalized ST domain but didn’t prove it theo- retically. In this paper, the characteristic property of WGN in original ST domain is derived theoretically and the conclusion is further verified by Monte Carlo method. Its application in nonstationary signal detection is also illustrated. The rest of this paper is organized into as follows: In Section 2, the proposition of WGN distribution followed by its theoretical derivation is given. Section 3 verifies the proposition by Monte Carlo method. In Section 4, the performance of signal detection is illustrated by detecting transient sinusoid signals under the constant-false-alarm- rate (CFAR) criterion. Finally, conclusions are drawn in Section 5. 2. Characteristic Property of WGN in ST Domain 2.1. Proposition The S-transform of a signal is defined by [1] 1 (, )()exp(2)(, ) 2 x St fxjfwtfd τπττ τ π ∞ −∞ = −− ∫ (1) where the window function is (2 ) And the characteristic and the advantage of ST has been sufficiently described by previous literature [2-6]. Let be the S-spectrum of and white Gaussian noise ; then the normalized S-spectrum of , 22 2(, ) /(, ) nn S tfE S tf (de- noted as ), follows distribution with two degree of freedom.  Characteristic Analysis of White Gaussian Noise in S-Transformation Domain OPEN ACCESS JCC 2.2. Proof Step.1: Derive the distribution of and Im[( ,)] n S tf and prove that they follow the identical Gaussian distribution. By definition, the S-spectrum of can be expressed as ( ) 222 ,Re[( ,)]Im[(,)] n nn StfS tfS tf= + (3) Before further proceeding, let us analyze the distri- bution of Re[( ,)] n S tf and Im[( ,)] n S tf, respectively. The real part of is given by 22 () Re[(,)]()exp()cos(2) 2 2 n ftf S tfnfd τ τπτ τ π ∞ −∞ −− = ∫ (4) is the integral of multiplied by deterministic signals, thus the distribution of Re[( ,)] n S tf is the same as with zero mean and its variance 2 Rt σ expressed as 22 21 1 11 22 2 2 22 222 1 12 22 212 12 2 () ( )()exp()cos(2) 2 2 () ( )exp()cos(2) 2 2 () ( )()exp() 2 2 () exp() cos(2) cos(2) 2 2 R ftf tEnfd ftf n fd ftf En n tf ff dd f τ στπτ τ π τ τπτ τ π τ ττ π τπτπτ ττ σ ∞ −∞ ∞∗ −∞ ∞∞ ∗ −∞ −∞ −− = −− ⋅ −− = ⋅ −− ⋅ ⋅⋅ = ∫ ∫ ∫∫ ( ) 2 22 2 2 2 22 2 2 22 22 22 exp(())cos (2) cos(4)1 exp(())2 2 1exp(()) cos(4) 22 exp(()) 1exp( 4)cos(4)1 22 t ffd ff tf d ft ffd t fd fft τπτ τ π πτ στ τ π στπτ τ π ττ σ ππ π ∞ −∞ ∞ −∞ ∞ −∞ ∞ −∞ −− + =−− ⋅ = ⋅−−⋅ + −− =⋅− + ∫ ∫ ∫ ∫ (5) Similarly, the imaginary part Im[( ,)] n S tf follows the Gaussian distribution with 2 Im[(,)](0,( )) nI S tfNt σ , where ( ) 22 2 1 ( )1exp(4)cos(4) 22 I f t ft σ σππ π = ⋅−− (6 ) In Equation (5) and Equation (6), the constant term, , is of very small value which can approximately equal to zero, thus can be regarded as having identically distributed real and im- aginary parts, that is, and . Step.2: Derive the expression of the average S-spec- trum of , , and Prove that and follow identical standard normal distribution. The normalized S-spectrum of can be written as 22 2 22 22 Re[(, )]Im[(,)] (, )2(,)(, ) Re[( ,)]Im[( ,)] nn n nn nn S tfS tf NSt fE S tfE Stf NSt fNSt f =⋅+ = + (7) Since the average S-spectrum of , , is given by 2 121 21 212 2 (,)[()()]( ,) (,)exp( 2()) 2 n E S tfEnnwtf wt ffjdd f τττ τπ τ τττ σ π ∗ ∞ = − ⋅−− − = ∫∫ (8) then the distribution of and can be obtained as Re[(,)] ~(0,1);Im[(,)] ~(0,1) nn NSt fNNSt fN (9) Step.3: Prove that and are independent. To determine the distribution of , the cor- relation of and need to be analyzed. The correlation function is { } 121222 11 12 2 22 22 12 12 2222 12 ( ,)Re[( ,)]Im[(,)] () 2[ ()()]exp2 () expcos(2)sin(2) 2 () () 2 expexp 22 cos(2 ) RIn n RttENStfNStf fft En n ft ffdd fft ft f τ ττ σπ τπτπτ ττ ττ π πτ ∞∞ ∗ −∞ −∞ ∞ −∞ = ⋅ −− = ⋅ −− ⋅ ⋅⋅ −− −− =⋅⋅ ⋅⋅ ∫∫ ∫ ( ) ( ) ( ) ( ) ()() ( ) ( ) 2222 12 22 22 121 2 22 212 12 212 sin(2 ) () () expexpsin 4 22 exp2 2 2 2exp 4exp4 () 1exp(4) expexp2() 24 exp 2 fd fft ftfd ffttt t jjfjf d ft tjftt j ftt f πτ τ ττ πτ τ π ττ π πτπτ τ ππ τ π ∞ −∞ ∞ −∞ −− −− = ⋅⋅ − =−++ + ⋅ −− −− =⋅− ⋅⋅+ + ⋅⋅− − ∫ ∫ ( ) ( ) 2 22 212 12 2 212 22 212 12 2 () 1exp(4) expexp2() 24 2 exp 2 () exp(4) expsin2()0 4 jd f ft tjft t j ftt f jd f ft tftt πτ ππ π ττ π ππ ∞ −∞ ∞ −∞ + −− −⋅ −⋅⋅−+ + ⋅⋅− −− −− = −⋅⋅+≈ ∫ ∫ (10)  Characteristic Analysis of White Gaussian Noise in S-Transformation Domain OPEN ACCESS JCC Since both and follow Gaussian distribution, Equation (10) means they are inde- pendent. This concludes the proof that (, ) n NSt f has independent and identical distributed real and imaginary parts of standard normal distribution, thus follows distribution with two degrees of freedom. 3. Numerical Simulations In this section, Monte Carlo methods are used to demon- strate the rationalities of above derivations. The variance of WGN is set to be zero mean and with 512 data points. The results are shown in Table 1, where the theoretical values are obtained by distribu- tion table according to , is the degree of freedom, is the times of Monte Carlo methods and the simulation results are obtained by realizations. A good agreement between the theoretical values and the simulation results can be observed. And as the times of Monte Carlo experiments increase, the simulation re- sults become closer to their theoretical values. Hence, we have proved our proposition and obtained the distribution of WGN in S transformation domain. 4. Signal Detection in ST Domain In this section, the task of ST based detector is to provide time -varying information in addition to detecting whe- ther a transient signal is present or absent. We use the concept of frame detection which is similar to the com- mon method in voice activity detection (VAD) and no cumulation operator is used. The time slice of S-spec- trum is employed as the frame and the decision function is 0 1 :()() :()() () Hxt ntl Hxtst ntl = <Γ = +≥Γ (11) where is the observed signal, is the signal to be detected and is WGN at the time (also the frame index). is the detection threshold and its value can be calculated as (12) where the value of can be determined by 2 χ distri- bution table according to the specific false alarm proba- bility FA P and the value of can be es- timated under the assumption that the initialization of is the noise only. The detection statistic can be expressed as (13 ) where is the time slice of at the time . The constant-false-alarm-rate(CFAR) cr iterion is employed in our detector. The probability of detection is used as the performance variable and its value can be numerically expressed as H1|H1 H1 1 (1 /)() k Di P kNN = =∑ (14) where is the time of Monte Carlo realizations, is the number of the transient signal frames and is that of the correct detection frames. In the analysis, a transient sinusoid signal under WGN environment is used to illustrate the performance of sig- nal detection in ST domain. The simulation signal is of 500 data points with 150 points pure noise at the begin- ning segment and the end segment, respectively. Figure 1 shows an example of frame detection at . In this simulation, 4 different frames are selected and it is obvious that the frame at is the signal frame while others are noise ones. In Figure 2, the de- tector performance is shown in terms of versus SNR curves according to three different FA under CFAR criteria. The results show that the proposed detector can achieve reliable detection at the noise level higher than . Figure 3 depicts the performance comparison of pro- posed detector with the same frame detector which uses STFT instead of ST. The threshold corresponding to spe- cific of STFT based detector is obtained by Monte Carlo method of 10000 realizations. The sup eriority of frame detection is to provide time-varying information. Thus in Figure 4, the initiation time detection result of the transient sinusoid signal is shown under the error tolerance of 1 frame. The simulation result essentially means that this linear time-frequency representation could be potentially used for accurate estimation of the time -varying parameters for nonstationary signals. 5. Conclusion In this paper, the characteristic analysis of white Gaussian Table 1. Simulation results of according to by realizations. 0.025 0.05 0.1 0.25 0.75 theoretical 7.378 5.991 4.605 2.773 0.575 7.4969 6.0005 4.6058 2.7514 0.5640 7.3757 5.9915 4.6036 2.7628 0.5732 0.90 0.95 0.975 0.99 0.995 theoretical 0.211 0.103 0.051 0.020 0.010 0.2079 0.1006 0.0500 0.0218 0.0108 0.2096 0.1025 0.0504 0.0203 0.0102 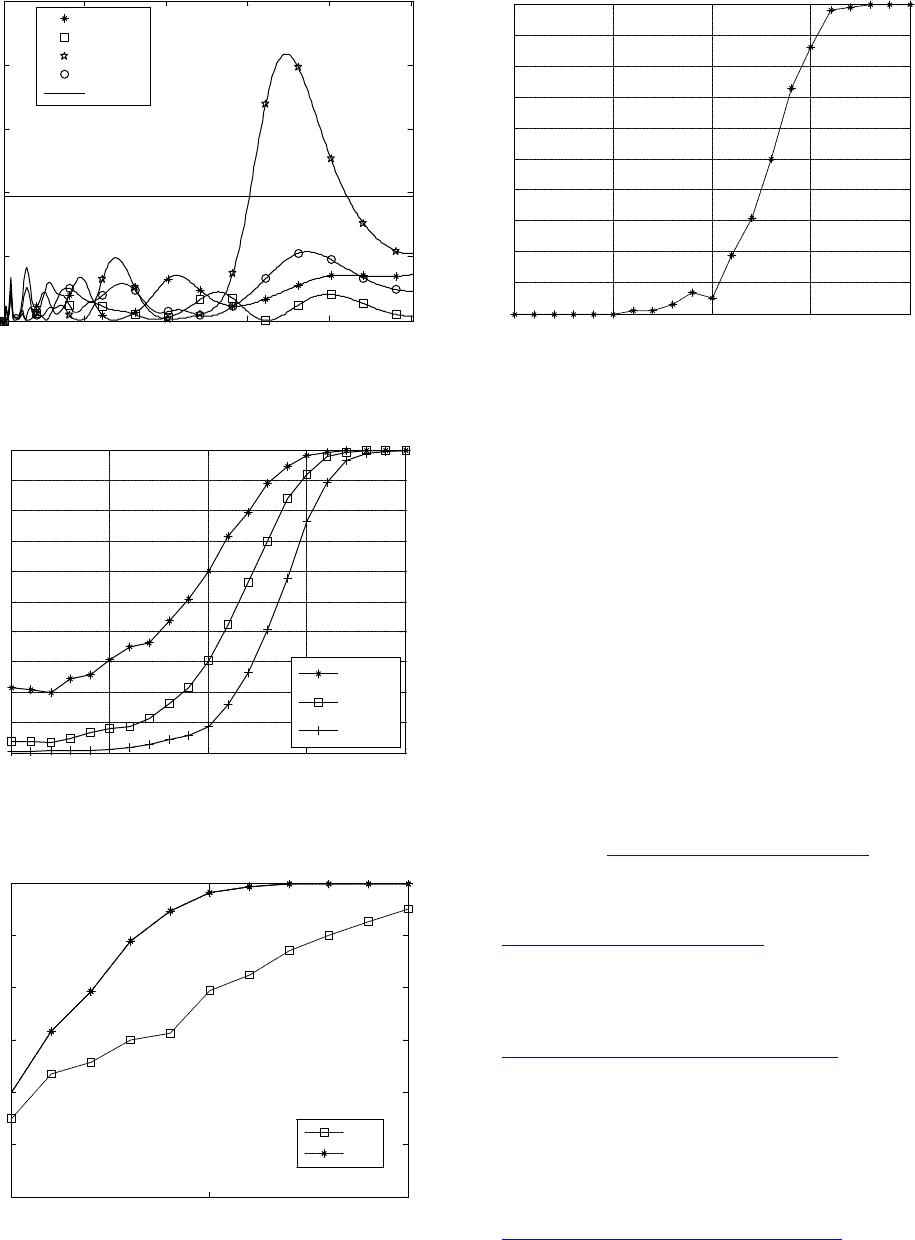 Characteristic Analysis of White Gaussian Noise in S-Transformation Domain OPEN ACCESS JCC Figure 1. Frame detection results at four different indexes under the noise level of . Figure 2. curve for presented detector under three different false alarm probabilities. Figure 3. Detection performance of frame detector based on ST and STFT at . Figure 4. Initiation time detection results of transient sinu- soid signals using frame detection. noise in S transformation domain has been performed. Accurate distribution of WGN has been analytically de- rived and been further verified through numerical analy- sis. This result could be useful in signal detection and ST-based signal processing scheme. Acknowledgments This research was supported in part by a National Natural Science Foundation of China (61301286, 61201287) and a Fundamental Research Funds for the Central Universi- ties (K50511020022). REFERENCES [1] R. G. Stockwell, L. Mansinha and R. P. Lowe, “Localiza- tion of the Complex Spectrum: The S-Transform,” IEEE Transactions on Signal Processing, Vol. 44, No. 4, 1996, pp. 998-1001. http://dx.doi.org/10.1109/78.492555 [2] C. R. Pinnegar and L. Mansinha, “The S-Transform with Windows of Arbitrary and Varying Shape,” Geophysics, Vol. 68, No. 1, 2003, pp. 381-385 . http://dx.doi.org/10.1190/1.1543223 [3] A. G. Rehorn, E. Sejdic and J. Jiang, “Fault Diagnosis in Machine Tools Using Selective Regional Correlation,” Mechanical Systems and Signal Processing, Vol. 20, No. 5, 2006, pp. 1221-1238. http://dx.doi.org/10.1016/j.ymssp.2005.01.010 [4] G. Livanos, N. Ranganathan and J. Jiang, “Heart Sound Analysis Using the S-Transform,” Proceedings of Com- puters in Cardiology, Cambridge, 24-27 September 2000, 587-590. [5] C. R. Pinnegar and L. Mansinha, “The Bi-Gaussian S- Transform,” SIAM: SIAM Journal on Scientific Compu- ting, Vol. 24, No. 5, 2003, pp. 1678-1692. http://dx.doi.org/10.1137/S1064827500369803 [6] C.R. Pinnegar, L. Mansinha, “Time-Local Fourier Analy- sis with a Scalable, Phase-Modulated Analyzing Function: 0.2 0.40.60.81 0 5 10 15 20 25 Normalized Frequency A m pl i t ude t =100 t =125 t =175 t =400 Threshol d -15 -10 -5 05 0 0. 1 0. 2 0. 3 0. 4 0. 5 0. 6 0. 7 0. 8 0. 9 1 S NR( d B) P d P FA = 10 -2 P FA = 10 -3 P FA = 10 -4 -5 0 5 0. 4 0. 5 0. 6 0. 7 0. 8 0. 9 1 SNR(dB) P d STFT ST -15 -10 -505 0 0. 1 0. 2 0. 3 0. 4 0. 5 0. 6 0. 7 0. 8 0. 9 1 S NR(d B ) P d  Characteristic Analysis of White Gaussian Noise in S-Transformation Domain OPEN ACCESS JCC The S-Transform with a Complex Window,” Signal Process, Vol. 84, No. 7, 2004, pp. 1167-1176. http://dx.doi.org/10.1016/j.sigpro.2004.03.015 [7] M. Schimmel and J. Gallart, “The Inverse S-Transform in Filters with T ime-Frequency Localization,” IEEE Trans- actions on Signal Process, Vol. 53, No. 11, 2005, pp. 4417-4422. http://dx.doi.org/10.1109/TSP.2005.857065 [8] C. Simon, S. Ventosa, M. Schimmel, A. Heldring, J. J. Dañobeitia, J. Gallart and A. Mànuel, “The S-Transform and Its Inverses: Side Effects of Discretizing and Filter- ing,” IEEE Transactions on Signal Processing, Vol. 55, No. 10, 2007, pp. 4928-4937. http://dx.doi.org/10.1109/TSP.2007.897893 [9] E. Sejdic, L. Stankovic, M. Dakovic and J. Jiang, “In- stantaneous Frequency Estimation Using the S-Trans- form,” IEEE Signal Processing Letters, Vol. 15, 2008, pp. 309-312. http://dx.doi.org/10.1109/LSP.2008.917014 [10] E. Sejdic and J. Jiang, “Selective Regional Correlation for Pattern Recognition,” IEEE Transactions on Systems, Man, and Cybernetics, Vol. 37, No. 1, 2007, pp. 82-93. [11] J. H. Gao, W. S. Man and S. M. Chen, “Recognition of Signals from Colored Noise Background in Generalized S-Transformation Domain,” Chinese Journal of Geo- physics, Vol. 47, No. 5, 2004, pp. 869-875. http://dx.doi.org/10.1002/cjg2.576
|