 Journal of Service Science and Management, 2011, 4, 97-109 doi:10.4236/jssm.2011.41013 Published Online March 2011 (http://www.SciRP.org/journal/jssm) Copyright © 2011 SciRes. JSSM 97 An Empirical Study of Container Terminal’s Service Attributes Jing Lu, Xiaoxing Gong, Lei Wang Transportation and Management College, Dalian Maritime University, Dalian, China. Email: gongxiaoxing@hotmail.com Received September 28th, 2010; revised November 4th, 2010; accepted November 7th, 2010. ABSTRACT This paper empirically evaluates container terminal service attributes from shipping lines and shipping agencies’ per- spective. Some methods are applied for study, such as Internal-Consistency Reliab ility, Factor Analysis, Cluster Analy- sis, Importance-Satisfaction Analysis and analysis of variance. The results suggest that customers perceive reliability of the agreed vessel sailin g time to b e the most important conta iner terminal service attribute fo llowed by custom declara- tion efficiency, loading and discharging efficiency, port cost and berth availability. While quality of port facility is the most satisfactory service attribute. Ba sed on the concept of market segmen tation, we employed cluster analysis to clas- sify customers of container terminal into three segments, namely port cost oriented firms, port facilities and equipments oriented firms, and service efficiency and IT service oriented firms. Theoretical and practical implications of the re- search findings are discussed. Keywords: Cluster Analysis, Container Terminal s , Market Segmentation 1. Introduction Thanks to the great performance of its container termi- nals, China has now reached a world-class position for container traffic. All the ports are experiencing a great increase in container throughput, which aiming at devel- oping not only the infrastructures but also the container terminal service. However, this led to high competitive- ness of container terminals across the country, due to a large number of new ones entering this market. The importance of customer service in competitive strategy has long been recognized [1,2]. There is a reali- zation that markets should be segmented based on cus- tomer service requirements [3-5]. If container terminals are able to identify the exact service needs of their target customers, it is possible to segment the user groups on the basis of their differing service requirements. To do so, distinctly different service requirements must first be understood. To this end, the paper presents a methodol- ogy for evaluating the importance and satisfaction that container terminal customers in Shenzhen, PRC attach to service attributes, both in aggregate and by service di- mensions. Further, it develops market segments for con- tainer terminals based on shipping lines and shipping agencies’ attitudes, and addresses their implications for container terminals operators’ marketing activities. The container terminal service variables were extracted from the previous relevant research and studies in the con- tainer terminals industry. Nowadays, more and more factors of container termi- nal are considered by shipping lines when they decide the ports to call. And service attributes are the most impor- tant factors, such as port facility enlargement measures, modernization of stevedoring equipment, development of feeder route, decreasing tariffs, providing enough storage hours, optimizing line-haul truck operations, speedy and safe handling of special cargoes, etc. The following are some reviews of previous foreign studies on the extraction of the container terminal service attributes. French [6] suggested terminal facilities, tariffs, port congestion, service level, and port operators as im- portant components. Peters [7] put emphasis on the ser- vice level, available facility capacity, status of the facility, and port operation. In Kim’s [8] study, important service attributes contained navigation facilities and equipment holding status, port productivity, price competition, and port service quality. Gi-Tae YEO and Dong-Wook SONG [9] investigated Korean ports and listed several container terminal service attributes: application of EDI 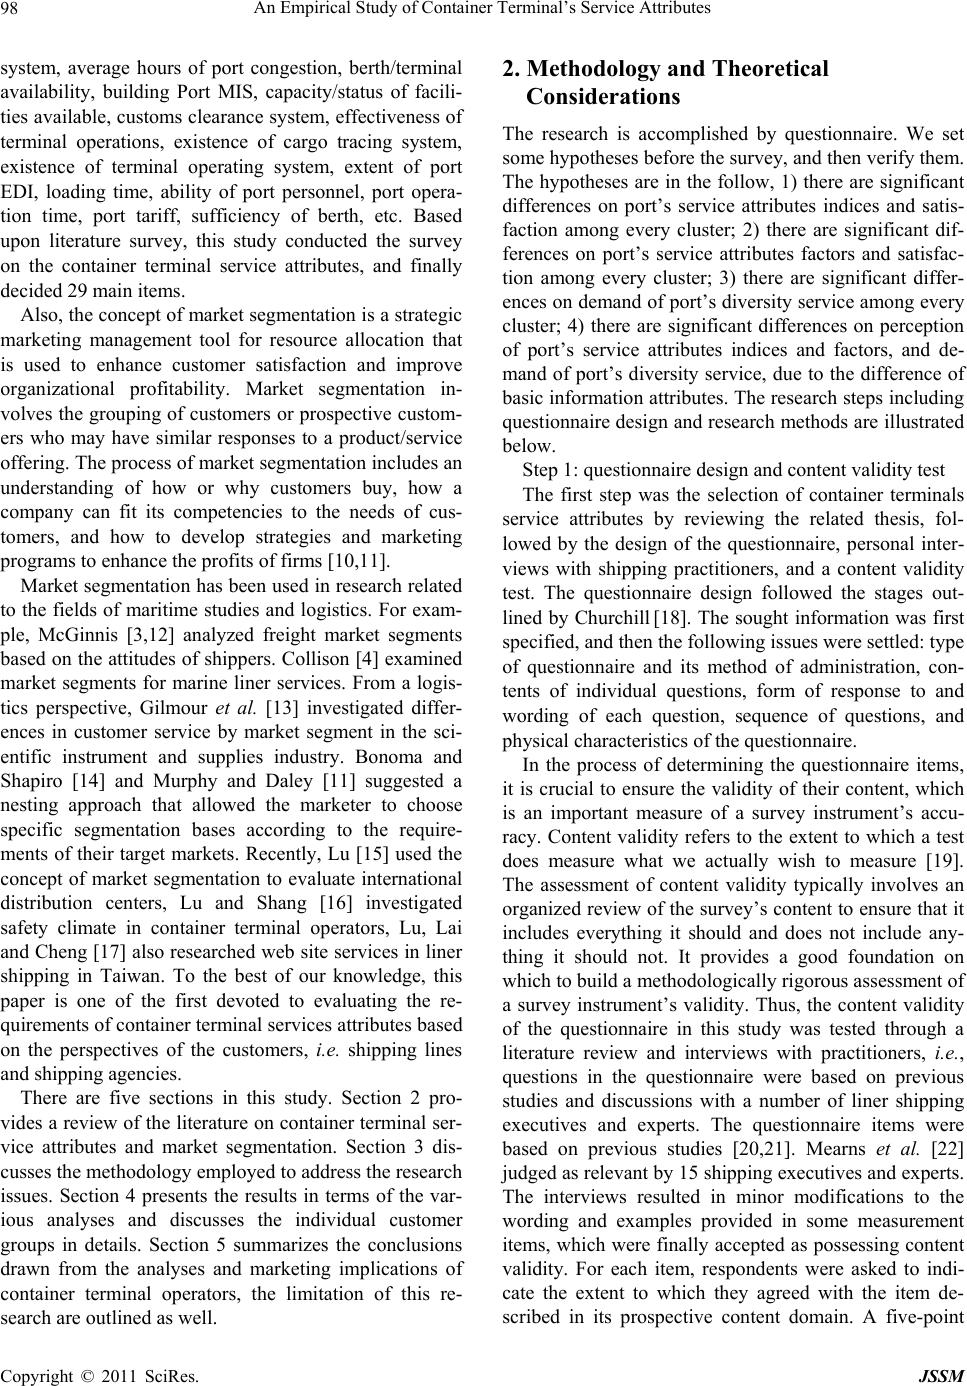 An Empirical Study of Container Terminal’s Service Attributes 98 system, average hours of port congestion, berth/terminal availability, building Port MIS, capacity/status of facili- ties available, customs clearance system, effectiveness of terminal operations, existence of cargo tracing system, existence of terminal operating system, extent of port EDI, loading time, ability of port personnel, port opera- tion time, port tariff, sufficiency of berth, etc. Based upon literature survey, this study conducted the survey on the container terminal service attributes, and finally decided 29 main items. Also, the concept of market segmentation is a strategic marketing management tool for resource allocation that is used to enhance customer satisfaction and improve organizational profitability. Market segmentation in- volves the grouping of customers or prospective custom- ers who may have similar responses to a product/service offering. The process of market segmentation includes an understanding of how or why customers buy, how a company can fit its competencies to the needs of cus- tomers, and how to develop strategies and marketing programs to enhance the profits of firms [10,11]. Market segmentation has been used in research related to the fields of maritime studies and logistics. For exam- ple, McGinnis [3,12] analyzed freight market segments based on the attitudes of shippers. Collison [4] examined market segments for marine liner services. From a logis- tics perspective, Gilmour et al. [13] investigated differ- ences in customer service by market segment in the sci- entific instrument and supplies industry. Bonoma and Shapiro [14] and Murphy and Daley [11] suggested a nesting approach that allowed the marketer to choose specific segmentation bases according to the require- ments of their target markets. Recently, Lu [15] used the concept of market segmentation to evaluate international distribution centers, Lu and Shang [16] investigated safety climate in container terminal operators, Lu, Lai and Cheng [17] also researched web site services in liner shipping in Taiwan. To the best of our knowledge, this paper is one of the first devoted to evaluating the re- quirements of container terminal services attributes based on the perspectives of the customers, i.e. shipping lines and shipping agencies. There are five sections in this study. Section 2 pro- vides a review of the literature on container terminal ser- vice attributes and market segmentation. Section 3 dis- cusses the methodology employed to address the research issues. Section 4 presents the results in terms of the var- ious analyses and discusses the individual customer groups in details. Section 5 summarizes the conclusions drawn from the analyses and marketing implications of container terminal operators, the limitation of this re- search are outlined as well. 2. Methodology and Theoretical Considerations The research is accomplished by questionnaire. We set some hypotheses before the survey, and then verify them. The hypotheses are in the follow, 1) there are significant differences on port’s service attributes indices and satis- faction among every cluster; 2) there are significant dif- ferences on port’s service attributes factors and satisfac- tion among every cluster; 3) there are significant differ- ences on demand of port’s diversity service among every cluster; 4) there are significant differences on perception of port’s service attributes indices and factors, and de- mand of port’s diversity service, due to the difference of basic information attributes. The research steps including questionnaire design and research methods are illustrated below. Step 1: questionnaire design and content validity test The first step was the selection of container terminals service attributes by reviewing the related thesis, fol- lowed by the design of the questionnaire, personal inter- views with shipping practitioners, and a content validity test. The questionnaire design followed the stages out- lined by Churchill [18]. The sought information was first specified, and then the following issues were settled: type of questionnaire and its method of administration, con- tents of individual questions, form of response to and wording of each question, sequence of questions, and physical characteristics of the questionnaire. In the process of determining the questionnaire items, it is crucial to ensure the validity of their content, which is an important measure of a survey instrument’s accu- racy. Content validity refers to the extent to which a test does measure what we actually wish to measure [19]. The assessment of content validity typically involves an organized review of the survey’s content to ensure that it includes everything it should and does not include any- thing it should not. It provides a good foundation on which to build a methodologically rigorous assessment of a survey instrument’s validity. Thus, the content validity of the questionnaire in this study was tested through a literature review and interviews with practitioners, i.e., questions in the questionnaire were based on previous studies and discussions with a number of liner shipping executives and experts. The questionnaire items were based on previous studies [20,21]. Mearns et al. [22] judged as relevant by 15 shipping executives and experts. The interviews resulted in minor modifications to the wording and examples provided in some measurement items, which were finally accepted as possessing content validity. For each item, respondents were asked to indi- cate the extent to which they agreed with the item de- scribed in its prospective content domain. A five-point Copyright © 2011 SciRes. JSSM 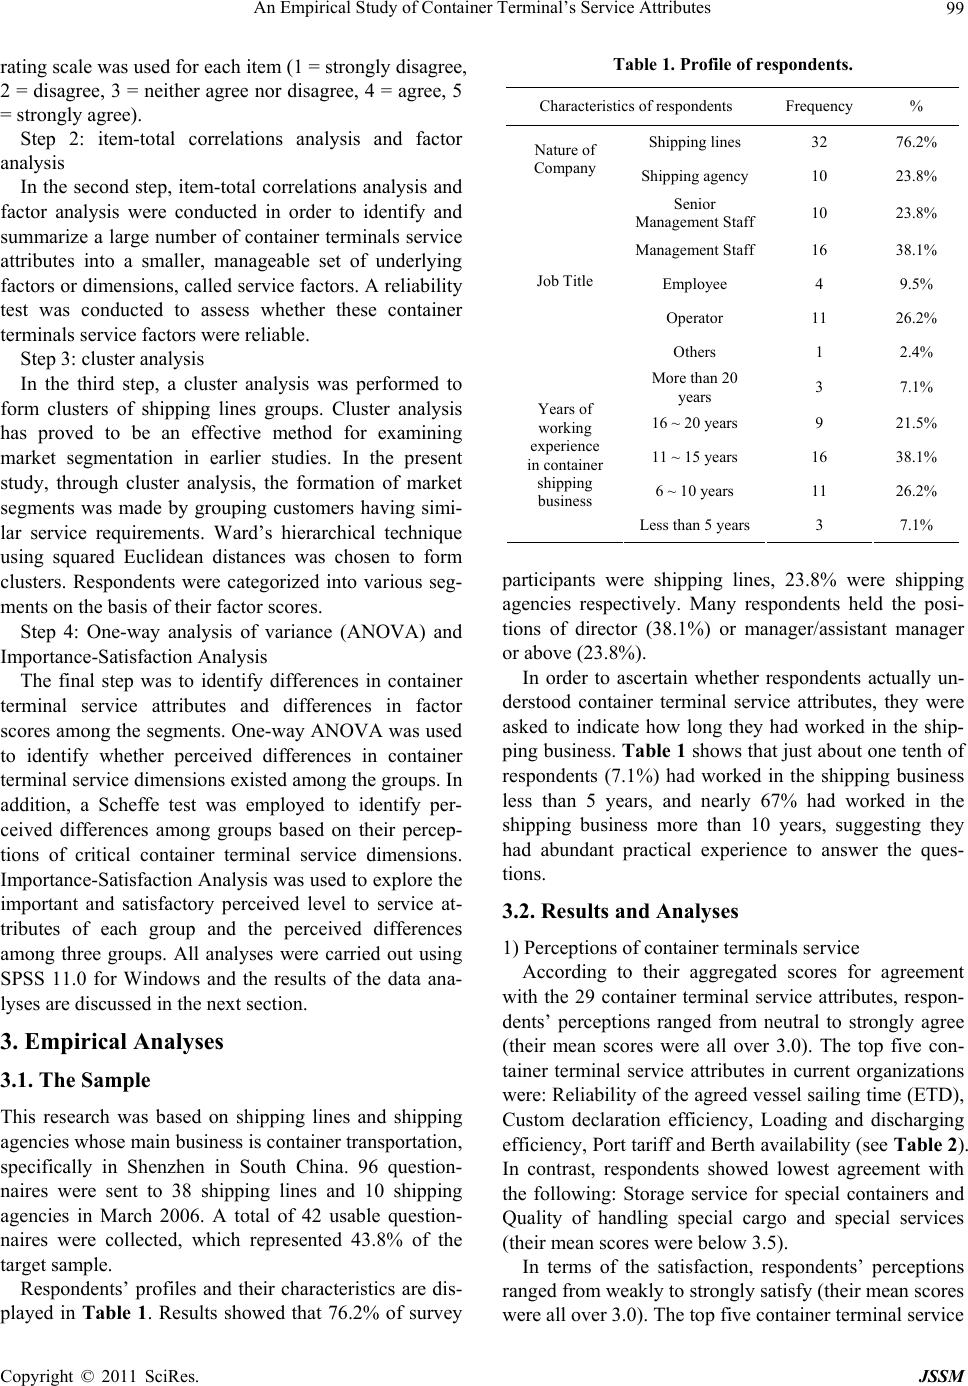 An Empirical Study of Container Terminal’s Service Attributes 99 rating scale was used for each item (1 = strongly disagree, 2 = disagree, 3 = neither agree nor disagree, 4 = agree, 5 = strongly agree). Step 2: item-total correlations analysis and factor analysis In the second step, item-total correlations analysis and factor analysis were conducted in order to identify and summarize a large number of container terminals service attributes into a smaller, manageable set of underlying factors or dimensions, called service factors. A reliability test was conducted to assess whether these container terminals service factors were reliable. Step 3: cluster analysis In the third step, a cluster analysis was performed to form clusters of shipping lines groups. Cluster analysis has proved to be an effective method for examining market segmentation in earlier studies. In the present study, through cluster analysis, the formation of market segments was made by grouping customers having simi- lar service requirements. Ward’s hierarchical technique using squared Euclidean distances was chosen to form clusters. Respondents were categorized into various seg- ments on the basis of their factor scores. Step 4: One-way analysis of variance (ANOVA) and Importance-Satisfaction Analysis The final step was to identify differences in container terminal service attributes and differences in factor scores among the segments. One-way ANOVA was used to identify whether perceived differences in container terminal service dimensions existed among the groups. In addition, a Scheffe test was employed to identify per- ceived differences among groups based on their percep- tions of critical container terminal service dimensions. Importance-Satisfaction Analysis was used to explore the important and satisfactory perceived level to service at- tributes of each group and the perceived differences among three groups. All analyses were carried out using SPSS 11.0 for Windows and the results of the data ana- lyses are discussed in the next section. 3. Empirical Analyses 3.1. The Sample This research was based on shipping lines and shipping agencies whose main business is container transportation, specifically in Shenzhen in South China. 96 question- naires were sent to 38 shipping lines and 10 shipping agencies in March 2006. A total of 42 usable question- naires were collected, which represented 43.8% of the target sample. Respondents’ profiles and their characteristics are dis- played in Table 1. Results showed that 76.2% of survey Table 1. Profile of respondents. Characteristics of respondents Frequency % Shipping lines 32 76.2% Nature of Company Shipping agency 10 23.8% Senior Management Staff 10 23.8% Management Staff 16 38.1% Employee 4 9.5% Operator 11 26.2% Job Title Others 1 2.4% More than 20 years 3 7.1% 16 ~ 20 years 9 21.5% 11 ~ 15 years 16 38.1% 6 ~ 10 years 11 26.2% Years of working experience in container shipping business Less than 5 years 3 7.1% participants were shipping lines, 23.8% were shipping agencies respectively. Many respondents held the posi- tions of director (38.1%) or manager/assistant manager or above (23.8%). In order to ascertain whether respondents actually un- derstood container terminal service attributes, they were asked to indicate how long they had worked in the ship- ping business. Table 1 shows that just about one tenth of respondents (7.1%) had worked in the shipping business less than 5 years, and nearly 67% had worked in the shipping business more than 10 years, suggesting they had abundant practical experience to answer the ques- tions. 3.2. Results and Analyses 1) Perceptions of container terminals service According to their aggregated scores for agreement with the 29 container terminal service attributes, respon- dents’ perceptions ranged from neutral to strongly agree (their mean scores were all over 3.0). The top five con- tainer terminal service attributes in current organizations were: Reliability of the agreed vessel sailing time (ETD), Custom declaration efficiency, Loading and discharging efficiency, Port tariff and Berth availability (see Tab l e 2 ). In contrast, respondents showed lowest agreement with the following: Storage service for special containers and Quality of handling special cargo and special services (their mean scores were below 3.5). In terms of the satisfaction, respondents’ perceptions ranged from weakly to strongly satisfy (their mean scores were all over 3.0). The top five container terminal service Copyright © 2011 SciRes. JSSM 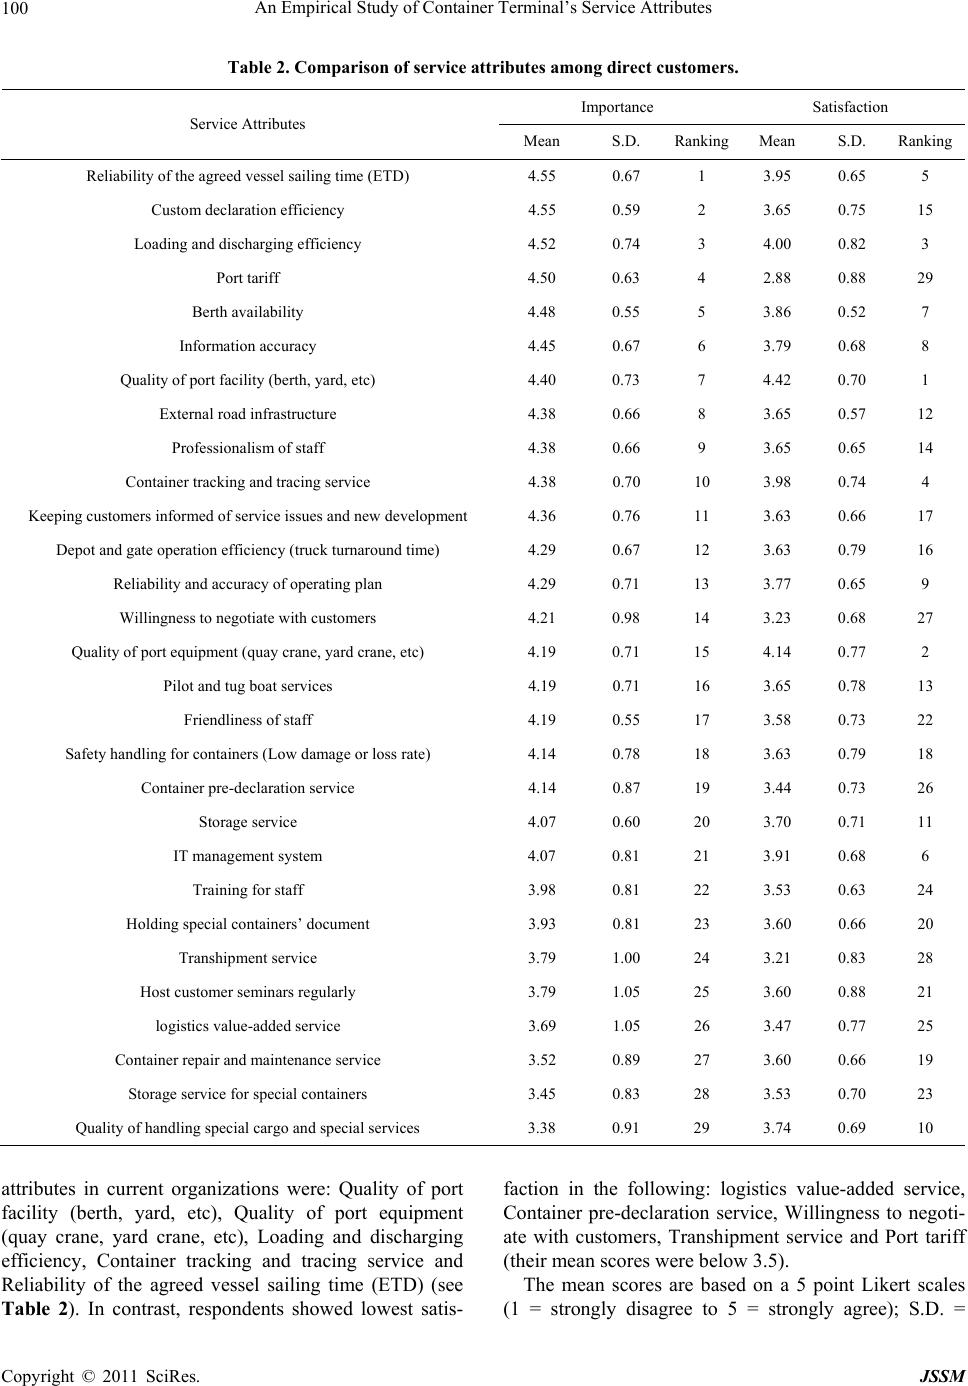 An Empirical Study of Container Terminal’s Service Attributes Copyright © 2011 SciRes. JSSM 100 Table 2. Comparison of service attributes among direct customers. Importance Satisfaction Service Attributes Mean S.D. Ranking Mean S.D. Ranking Reliability of the agreed vessel sailing time (ETD) 4.55 0.67 1 3.95 0.65 5 Custom declaration efficiency 4.55 0.59 2 3.65 0.75 15 Loading and discharging efficiency 4.52 0.74 3 4.00 0.82 3 Port tariff 4.50 0.63 4 2.88 0.88 29 Berth availability 4.48 0.55 5 3.86 0.52 7 Information accuracy 4.45 0.67 6 3.79 0.68 8 Quality of port facility (berth, yard, etc) 4.40 0.73 7 4.42 0.70 1 External road infrastructure 4.38 0.66 8 3.65 0.57 12 Professionalism of staff 4.38 0.66 9 3.65 0.65 14 Container tracking and tracing service 4.38 0.70 10 3.98 0.74 4 Keeping customers informed of service issues and new development 4.36 0.76 11 3.63 0.66 17 Depot and gate operation efficiency (truck turnaround time) 4.29 0.67 12 3.63 0.79 16 Reliability and accuracy of operating plan 4.29 0.71 13 3.77 0.65 9 Willingness to negotiate with customers 4.21 0.98 14 3.23 0.68 27 Quality of port equipment (quay crane, yard crane, etc) 4.19 0.71 15 4.14 0.77 2 Pilot and tug boat services 4.19 0.71 16 3.65 0.78 13 Friendliness of staff 4.19 0.55 17 3.58 0.73 22 Safety handling for containers (Low damage or loss rate) 4.14 0.78 18 3.63 0.79 18 Container pre-declaration service 4.14 0.87 19 3.44 0.73 26 Storage service 4.07 0.60 20 3.70 0.71 11 IT management system 4.07 0.81 21 3.91 0.68 6 Training for staff 3.98 0.81 22 3.53 0.63 24 Holding special containers’ document 3.93 0.81 23 3.60 0.66 20 Transhipment service 3.79 1.00 24 3.21 0.83 28 Host customer seminars regularly 3.79 1.05 25 3.60 0.88 21 logistics value-added service 3.69 1.05 26 3.47 0.77 25 Container repair and maintenance service 3.52 0.89 27 3.60 0.66 19 Storage service for special containers 3.45 0.83 28 3.53 0.70 23 Quality of handling special cargo and special services 3.38 0.91 29 3.74 0.69 10 attributes in current organizations were: Quality of port facility (berth, yard, etc), Quality of port equipment (quay crane, yard crane, etc), Loading and discharging efficiency, Container tracking and tracing service and Reliability of the agreed vessel sailing time (ETD) (see Table 2). In contrast, respondents showed lowest satis- faction in the following: logistics value-added service, Container pre-declaration service, Willingness to negoti- ate with customers, Transhipment service and Port tariff (their mean scores were below 3.5). The mean scores are based on a 5 point Likert scales (1 = strongly disagree to 5 = strongly agree); S.D. = 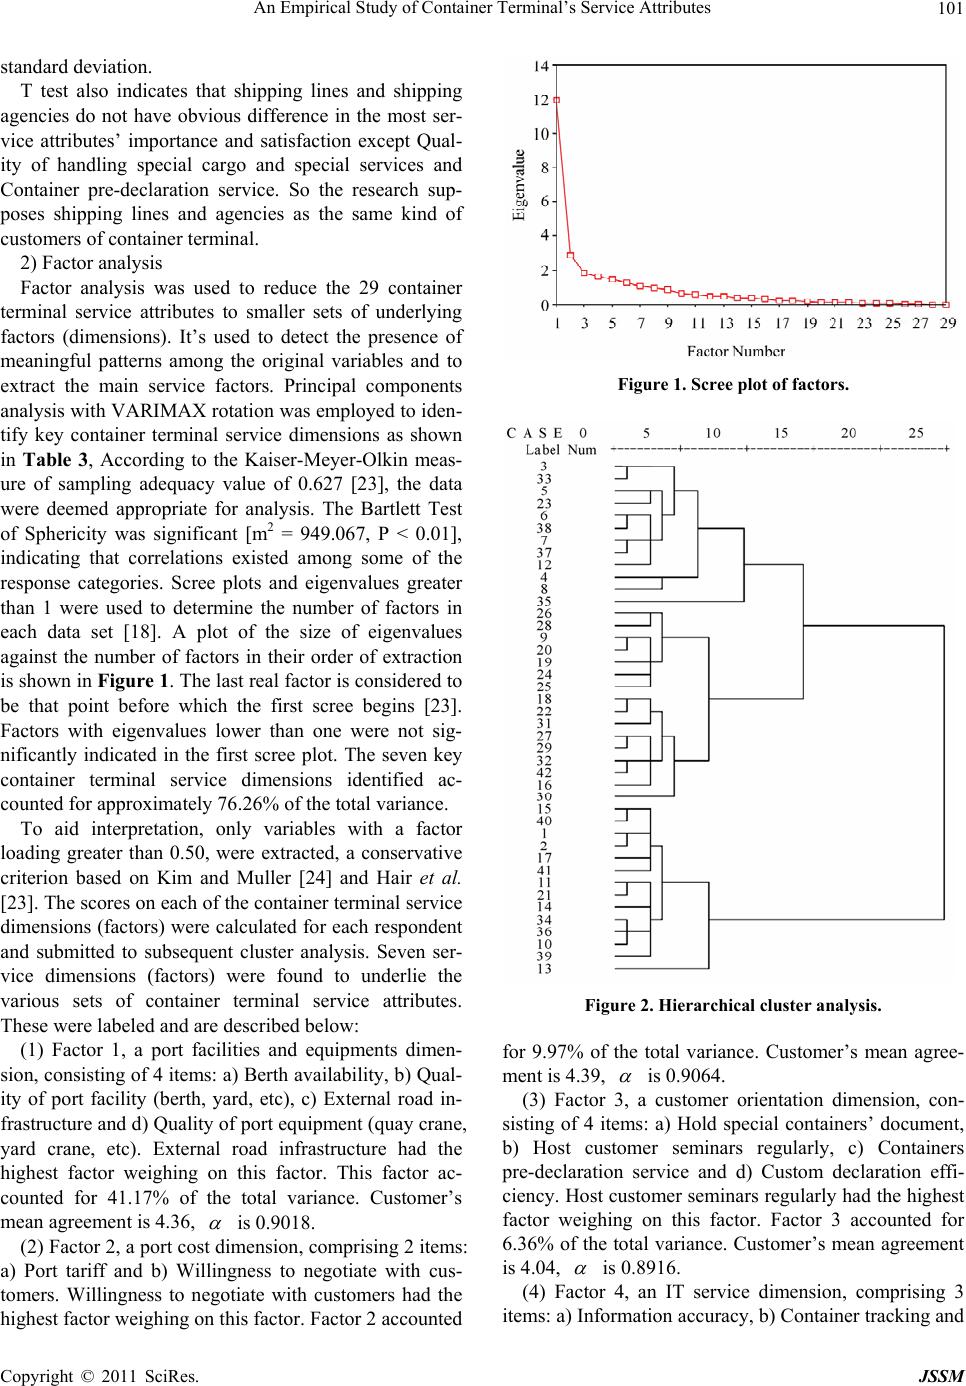 An Empirical Study of Container Terminal’s Service Attributes 101 standard deviation. T test also indicates that shipping lines and shipping agencies do not have obvious difference in the most ser- vice attributes’ importance and satisfaction except Qual- ity of handling special cargo and special services and Container pre-declaration service. So the research sup- poses shipping lines and agencies as the same kind of customers of container terminal. 2) Factor analysis Factor analysis was used to reduce the 29 container terminal service attributes to smaller sets of underlying factors (dimensions). It’s used to detect the presence of meaningful patterns among the original variables and to extract the main service factors. Principal components analysis with VARIMAX rotation was employed to iden- tify key container terminal service dimensions as shown in Table 3, According to the Kaiser-Meyer-Olkin meas- ure of sampling adequacy value of 0.627 [23], the data were deemed appropriate for analysis. The Bartlett Test of Sphericity was significant [m2 = 949.067, P < 0.01], indicating that correlations existed among some of the response categories. Scree plots and eigenvalues greater than 1 were used to determine the number of factors in each data set [18]. A plot of the size of eigenvalues against the number of factors in their order of extraction is shown in Figure 1. The last real factor is considered to be that point before which the first scree begins [23]. Factors with eigenvalues lower than one were not sig- nificantly indicated in the first scree plot. The seven key container terminal service dimensions identified ac- counted for approximately 76.26% of the total variance. To aid interpretation, only variables with a factor loading greater than 0.50, were extracted, a conservative criterion based on Kim and Muller [24] and Hair et al. [23]. The scores on each of the container terminal service dimensions (factors) were calculated for each respondent and submitted to subsequent cluster analysis. Seven ser- vice dimensions (factors) were found to underlie the various sets of container terminal service attributes. These were labeled and are described below: (1) Factor 1, a port facilities and equipments dimen- sion, consisting of 4 items: a) Berth availability, b) Qual- ity of port facility (berth, yard, etc), c) External road in- frastructure and d) Quality of port equipment (quay crane, yard crane, etc). External road infrastructure had the highest factor weighing on this factor. This factor ac- counted for 41.17% of the total variance. Customer’s mean agreement is 4.36, is 0.9018. (2) Factor 2, a port cost dimension, comprising 2 items: a) Port tariff and b) Willingness to negotiate with cus- tomers. Willingness to negotiate with customers had the highest factor weighing on this factor. Factor 2 accounted Figure 1. Scree plot of factors. Figure 2. Hierarchical cluster analysis. for 9.97% of the total variance. Customer’s mean agree- ment is 4.39, is 0.9064. (3) Factor 3, a customer orientation dimension, con- sisting of 4 items: a) Hold special containers’ document, b) Host customer seminars regularly, c) Containers pre-declaration service and d) Custom declaration effi- ciency. Host customer seminars regularly had the highest factor weighing on this factor. Factor 3 accounted for 6.36% of the total variance. Customer’s mean agreement is 4.04, is 0.8916. (4) Factor 4, an IT service dimension, comprising 3 items: a) Information accuracy, b) Container tracking and Copyright © 2011 SciRes. JSSM  An Empirical Study of Container Terminal’s Service Attributes Copyright © 2011 SciRes. JSSM 102 Table 3. Factor Analysis for container terminal service attributes. Factor 1Factor 2Factor 3Factor 4Factor 5 Factor 6 Factor 7 Berth availability 0.83 0.01 0.11 −0.02 0.01 0.12 0.08 Quality of port facility (berth, yard, etc) 0.60 0.18 0.14 0.21 0.22 0.17 0.38 External road infrastructure 0.84 0.06 0.04 −0.06 −0.01 0.06 0.19 Quality of port equipment (quay crane, yard crane, etc) 0.69 0.03 0.18 0.10 0.02 0.48 0.13 Storage service 0.51 −0.28 0.12 −0.10 0.03 0.08 0.60 Storage service for special containers 0.06 0.16 −0.04 0.02 0.11 −0.02 0.84 Pilot and tug boat services −0.11 0.54 0.11 −0.10 −0.19 −0.33 0.57 Quality of handling special cargo and special services −0.03 0.15 0.28 0.01 -0.10 −0.09 0.83 Transhipment service 0.33 0.19 0.30 -0.19 0.25 −0.38 0.50 Container repair and maintenance service 0.34 0.39 0.29 0.13 0.14 −0.33 −0.53 logistics value-added service 0.20 0.00 −0.02 0.33 −0.02 −0.06 0.87 Port tariff 0.16 0.62 0.16 0.39 −0.15 −0.12 0.13 Willingness to negotiate with customers 0.06 0.80 0.22 0.19 0.18 0.06 0.01 Reliability of the agreed vessel sailing time (ETD) 0.53 0.00 0.14 0.08 0.17 0.65 0.21 Loading and discharging efficiency 0.08 0.08 0.39 0.14 0.19 0.73 0.28 Depot and gate operation efficiency (truck turnaround time) 0.43 0.40 0.31 0.00 0.18 0.52 0.07 Keeping customers informed of service issues and new development 0.22 0.51 0.37 0.08 0.26 0.52 0.13 Reliability and accuracy of operating plan 0.39 0.10 0.41 0.08 0.40 0.55 0.40 Safety handling for containers (Low damage or loss rate)0.18 0.19 0.07 0.14 0.02 0.82 0.04 Friendliness of staff 0.48 0.08 0.17 0.18 0.60 0.35 −0.15 Professionalism of staff 0.28 0.32 0.17 0.09 0.67 −0.08 0.26 Training for staff 0.32 0.05 0.08 0.16 0.82 0.07 −0.09 Hold special containers’ document 0.29 0.44 0.64 0.18 −0.27 0.04 −0.05 Host customer seminars regularly 0.25 0.00 0.77 0.06 0.14 0.00 0.00 Container pre-declaration service 0.32 −0.11 0.51 0.48 0.23 −0.29 −0.18 Custom declaration efficiency 0.39 0.14 0.69 0.17 0.16 −0.08 0.05 Information accuracy 0.46 0.44 0.26 0.50 0.09 −0.03 0.25 Container tracking and tracing service 0.01 0.33 0.17 0.74 0.16 0.16 −0.14 IT management system 0.13 0.53 0.06 0.61 0.10 0.05 0.20 Eigenvalue 11.94 2.89 1.84 1.64 1.48 1.25 1.07 Percentage variance 41.17 9.97 6.36 5.64 5.11 4.33 3.69 Cumulative Percentage variance 41.17 51.14 57.49 63.13 66.24 72.56 76.26  An Empirical Study of Container Terminal’s Service Attributes 103 tracing service and c) IT management system. Container tracking and tracing service had the highest factor weighing on this dimension. Factor 4 accounted for 5.64 % of the total variance. Customer’s mean agreement is 4.25, is 0.8705. (5) Factor 5, a staff service ability dimension, consist- ing of 3 items: a) Friendliness of staff, b) Professionalism of staff and c) Training for staff. Training for staff had the highest factor weighing on this dimension. Factor 5 accounted for 5.11% of the total variance. Customer’s mean agreement is 4.09, is 0.8761. (6) Factor 6, a service efficiency dimension, compris- ing 6 items: a) Reliability of the agreed vessel sailing time (ETD), b) Loading and discharging efficiency, c) Depot and gate operation efficiency (truck turnaround time), d) Keeping customers informed of service issues and new development, e) Reliability and accuracy of operating plan and f) Safety handling for containers (Low damage or loss rate). Safety handling for containers (Low damage or loss rate) had the highest factor weigh- ing on this dimension. Factor 6 accounted for 4.33% of the total variance. Customer’s mean agreement is 4.31, is 0.8767. (7) Factor 7, a general service dimension, consisting of 7 attributes: a) Storage service, b) Storage service for special containers, c) Pilot and tug boat services, d) Quality of handling special cargo and special services, e) Transhipment service, f) Container repair and mainte- nance service and g) logistics value-added service. Lo- gistics value-added service had the highest factor weigh- ing on this dimension. Factor 7 accounted for 3.69% of the total variance. Customer’s mean agreement is 3.63, is 0.8964. (3) Reliability test A reliability test based on a Cronbach Alpha statistic was used to test whether these factors were consistent and reliable in measuring the research variables. Cron- bach Alpha values for each dimension are shown in Ta- ble 4. The reliability value of each factor was well above 0.87, indicating adequate internal consistency [18,25,26]. Table 4 also shows shipping lines’ agreement level as to the importance of each container terminal service di- mension in the current situation. The results indicate that they considered Port cost dimension as the most impor- tant one (factor 2), followed by Port facilities and equipments dimension (factor 1), Service efficiency di- mension (factor 6), IT service dimension (factor 4), Staff service ability dimension (factor 5), Customer orientation dimension (factor 3), and General service dimension (factor 7). 4) Cluster analysis results In addition to identifying whether perceived differences Table 4. Cronbach alpha values for each service dimension. Service factor Mean S.D. Crobach Alpha 1. Port facilities and equipments4.36 0.50 0.90 2. Port cost 4.39 0.74 0.91 3. Customer orientation 4.04 0.66 0.89 4. IT service 4.25 0.69 0.87 5. Staff service ability 4.09 0.62 0.88 6. Service efficiency 4.31 0.65 0.88 7. General service 3.63 0.60 0.90 existed among groups based on respondents’ characteris- tics, the 42 respondents were categorized into three groups on the basis of their factor scores in container terminal service dimensions. Twelve were assigned to Group 1, sixteen to Group 2, and fourteen to Group 3. Figure 2 presents the centroids of the three segments to visually illustrate their differences. Dendrogram used the Ward Method Rescaled Distance Cluster Combine. 5) Discriminant analysis results A classification matrix was used to test the accuracy of the classification. Table 5 shows the percentage of cor- rect classifications and the number of incorrect predic- tions. The overall classification accuracy is approxi- mately 92.86% (sum of correct predictions, 39, divided by total predictions of ‘known’ cases, 42). The errors stemmed from one case of Group 1 having been incor- rectly assigned to Group 2, two cases of Group 2 incor- rectly assigned to Group 1. More details about wrong grouping items can be found in Table 6. 6) One-way analysis of variance (ANOVA) results A one-way analysis of variance (ANOVA) was used to test the differences in a specific strategic dimension among strategic groups. Table 7 shows the results of ANOVA in the terms of factor scores. All seven strategic dimensions were significantly different among the three groups. A comparison of the factor scores shows that Group 1 has its highest mean score on factor 2 (port cost), but it has a much lower score on factor 7 (general service). Group 2 particularly emphasizes factor 1 (port facilities and equipments), followed by factor 2 (port cost) and factor 6 (service efficiency). Group 3 displays high scores for most strategic dimensions, exhibiting the highest mean score for the factor 6 (service efficiency) and factor 4 (IT service). In addition, ANOVA analysis was used to test the dif- ferences of service dimension among different job titles and shipping experience groups. Unfortunately, the result Copyright © 2011 SciRes. JSSM  An Empirical Study of Container Terminal’s Service Attributes 104 Table 5. Classification matrix. Classification Results Predicted Group Membership Actual Group Number of Case 1 2 3 12 11 1 0 Group 1 91.7% 8.3% 0 16 2 14 0 Group 2 12.5% 87.5% 0 14 0 0 14 Group 3 0 0 100.0% Average percent of “Group” cases correctly classified: 92.86% (=39/42). Table 6. Wrong grouping items table. Company No. Actual Group Predicted Group 4 1 2 17 2 1 26 2 1 indicated that most importance and satisfaction of service dimension were not significantly different among job titles and shipping experience groups except factor 2 and factor 7 (see Table 8). This implies that the job titles and shipping business experience are not the important fac- tors influencing the importance and satisfaction agree- ment of container terminal service factors. Three groups were identified by the above analyses. Strategic Group 1: port cost oriented firms (Twelve responding firms, 28.57% of total). The main distin- guishing feature of this group is ‘port cost’. As it is showed in Table 7, members of this group consider the ‘port cost’ to be more important factor influencing them whether choose the container terminal than do the other responding firms. Additionally, firms in this group were composed of small size companies. Strategic Group 2: port facilities and equipments ori- ented firms (Sixteen responding firms, 38.10% of total). Group 2 appears to consist of a group of firms empha- sizing port facilities. Thus, this group was defined as port facilities and equipments oriented firms. Additionally, firms in this group were composed of middle size com- panies. Strategic Group 3: service efficiency and IT service oriented firms (Fourteen responding firms, 33.33% of total). Upon inspection of the attitudes in this group, as shown in Table 7 , most strategic dimensions were found to be significantly more important. Based on the mean scores, this group particularly emphasizes factor 6 (ser- vice efficiency) and factor 4 (IT service). Hence, this group is identified as service efficiency and IT service oriented firms. Additionally, this group includes large size shipping companies and terminal’s VIP customers. About satisfaction ANOVA, three groups show con- sistent agreement to port facilities and equipments (factor 1), port cost (factor 2), IT service (factor 4) and general service (factor 7). Three groups’ most dissatisfied di- mension is port cost, while group 1 displays less satisfac- tion to all seven service dimensions than other two groups (see Table 9). 7) Importance-Satisfaction Analysis results The Importance-Satisfaction Analysis results also in- dicate that group 1 shows lower apperception in most of container terminals service attributes, while group 2 and group 3 show more satisfaction in the service attributes (Figures 3-5). 4. Conclusions This study emphasizes the importance and satisfaction of identifying market segments of container terminal based Table 7. AVOVA analysis between importance agreement of service dimensions and groups. Group (Mean) Service Factor 1 2 3 F ratio Duncan test 1. Port facilities and equipments 3.75 4.53 4.59 24.056 (1), (2,3) 2. Port cost 3.83 4.41 4.57 3.988 (1), (2,3) 3. Customer orientation 3.54 4.02 4.46 8.575 (1), (2), (3) 4. IT service 3.53 4.21 4.86 27.076 (1), (2), (3) 5. Staff service ability 3.56 4.02 4.69 22.509 (1), (2), (3) 6. Service efficiency 3.53 4.33 4.88 41.626 (1), (2), (3) 7. General service 3.25 3.47 4.24 19.622 (1,2), (3) Copyright © 2011 SciRes. JSSM 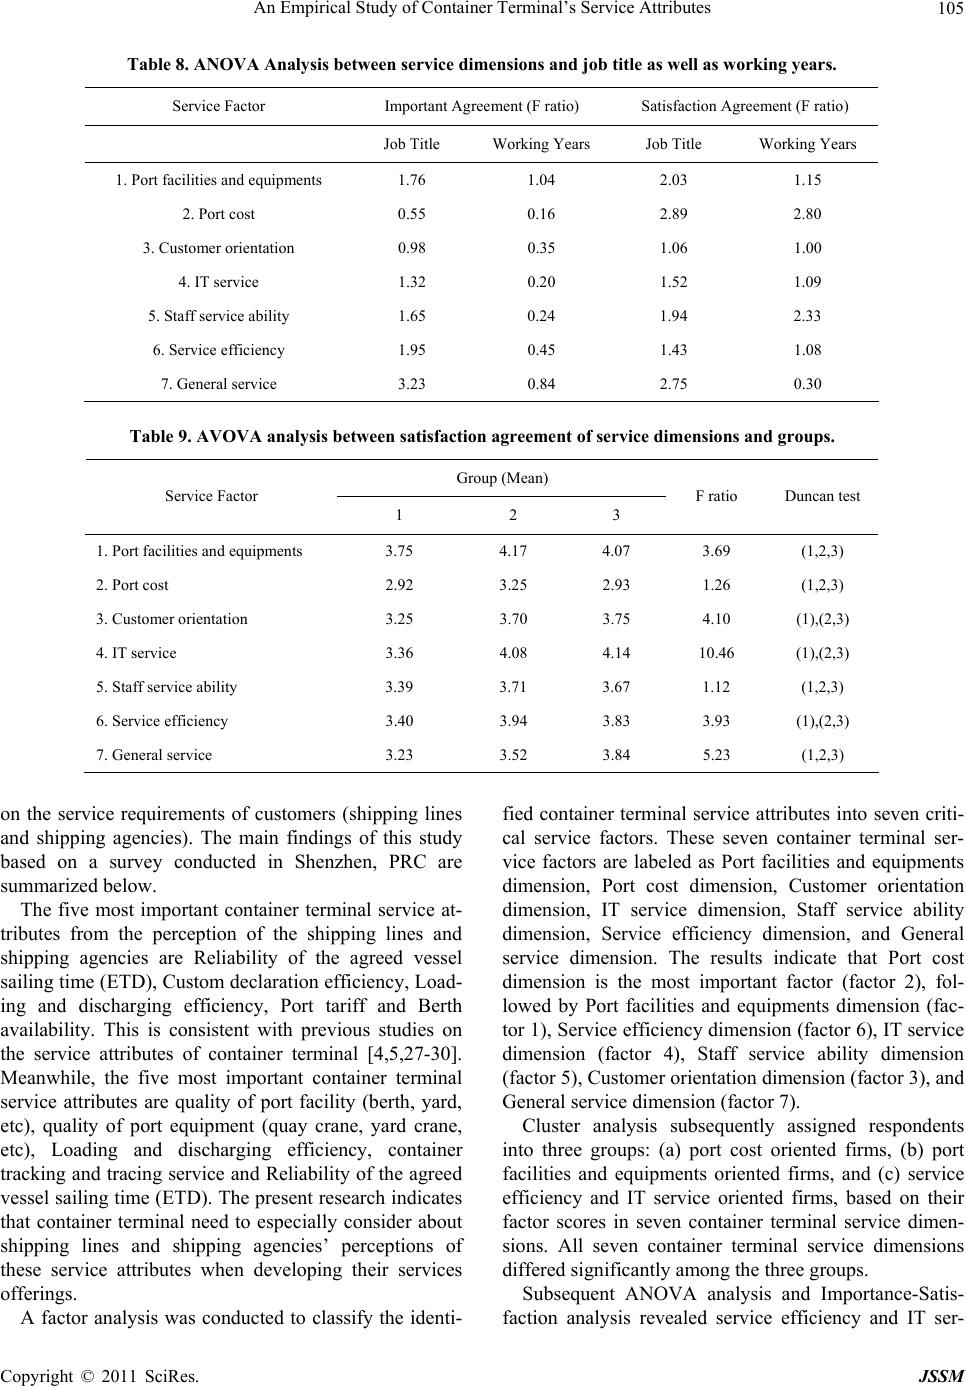 An Empirical Study of Container Terminal’s Service Attributes 105 Table 8. ANOVA Analysis betwee n se rvice dimensions and j o b title as well as working years. Service Factor Important Agreement (F ratio) Satisfaction Agreement (F ratio) Job Title Working Years Job Title Working Years 1. Port facilities and equipments 1.76 1.04 2.03 1.15 2. Port cost 0.55 0.16 2.89 2.80 3. Customer orientation 0.98 0.35 1.06 1.00 4. IT service 1.32 0.20 1.52 1.09 5. Staff service ability 1.65 0.24 1.94 2.33 6. Service efficiency 1.95 0.45 1.43 1.08 7. General service 3.23 0.84 2.75 0.30 Table 9. AVOVA analysis between satisfaction agreement of service dimensions and groups. Group (Mean) Service Factor 1 2 3 F ratio Duncan test 1. Port facilities and equipments 3.75 4.17 4.07 3.69 (1,2,3) 2. Port cost 2.92 3.25 2.93 1.26 (1,2,3) 3. Customer orientation 3.25 3.70 3.75 4.10 (1),(2,3) 4. IT service 3.36 4.08 4.14 10.46 (1),(2,3) 5. Staff service ability 3.39 3.71 3.67 1.12 (1,2,3) 6. Service efficiency 3.40 3.94 3.83 3.93 (1),(2,3) 7. General service 3.23 3.52 3.84 5.23 (1,2,3) on the service requirements of customers (shipping lines and shipping agencies). The main findings of this study based on a survey conducted in Shenzhen, PRC are summarized below. The five most important container terminal service at- tributes from the perception of the shipping lines and shipping agencies are Reliability of the agreed vessel sailing time (ETD), Custom declaration efficiency, Load- ing and discharging efficiency, Port tariff and Berth availability. This is consistent with previous studies on the service attributes of container terminal [4,5,27-30]. Meanwhile, the five most important container terminal service attributes are quality of port facility (berth, yard, etc), quality of port equipment (quay crane, yard crane, etc), Loading and discharging efficiency, container tracking and tracing service and Reliability of the agreed vessel sailing time (ETD). The present research indicates that container terminal need to especially consider about shipping lines and shipping agencies’ perceptions of these service attributes when developing their services offerings. A factor analysis was conducted to classify the identi- fied container terminal service attributes into seven criti- cal service factors. These seven container terminal ser- vice factors are labeled as Port facilities and equipments dimension, Port cost dimension, Customer orientation dimension, IT service dimension, Staff service ability dimension, Service efficiency dimension, and General service dimension. The results indicate that Port cost dimension is the most important factor (factor 2), fol- lowed by Port facilities and equipments dimension (fac- tor 1), Service efficiency dimension (factor 6), IT service dimension (factor 4), Staff service ability dimension (factor 5), Customer orientation dimension (factor 3), and General service dimension (factor 7). Cluster analysis subsequently assigned respondents into three groups: (a) port cost oriented firms, (b) port facilities and equipments oriented firms, and (c) service efficiency and IT service oriented firms, based on their factor scores in seven container terminal service dimen- sions. All seven container terminal service dimensions differed significantly among the three groups. Subsequent ANOVA analysis and Importance-Satis- faction analysis revealed service efficiency and IT ser- Copyright © 2011 SciRes. JSSM 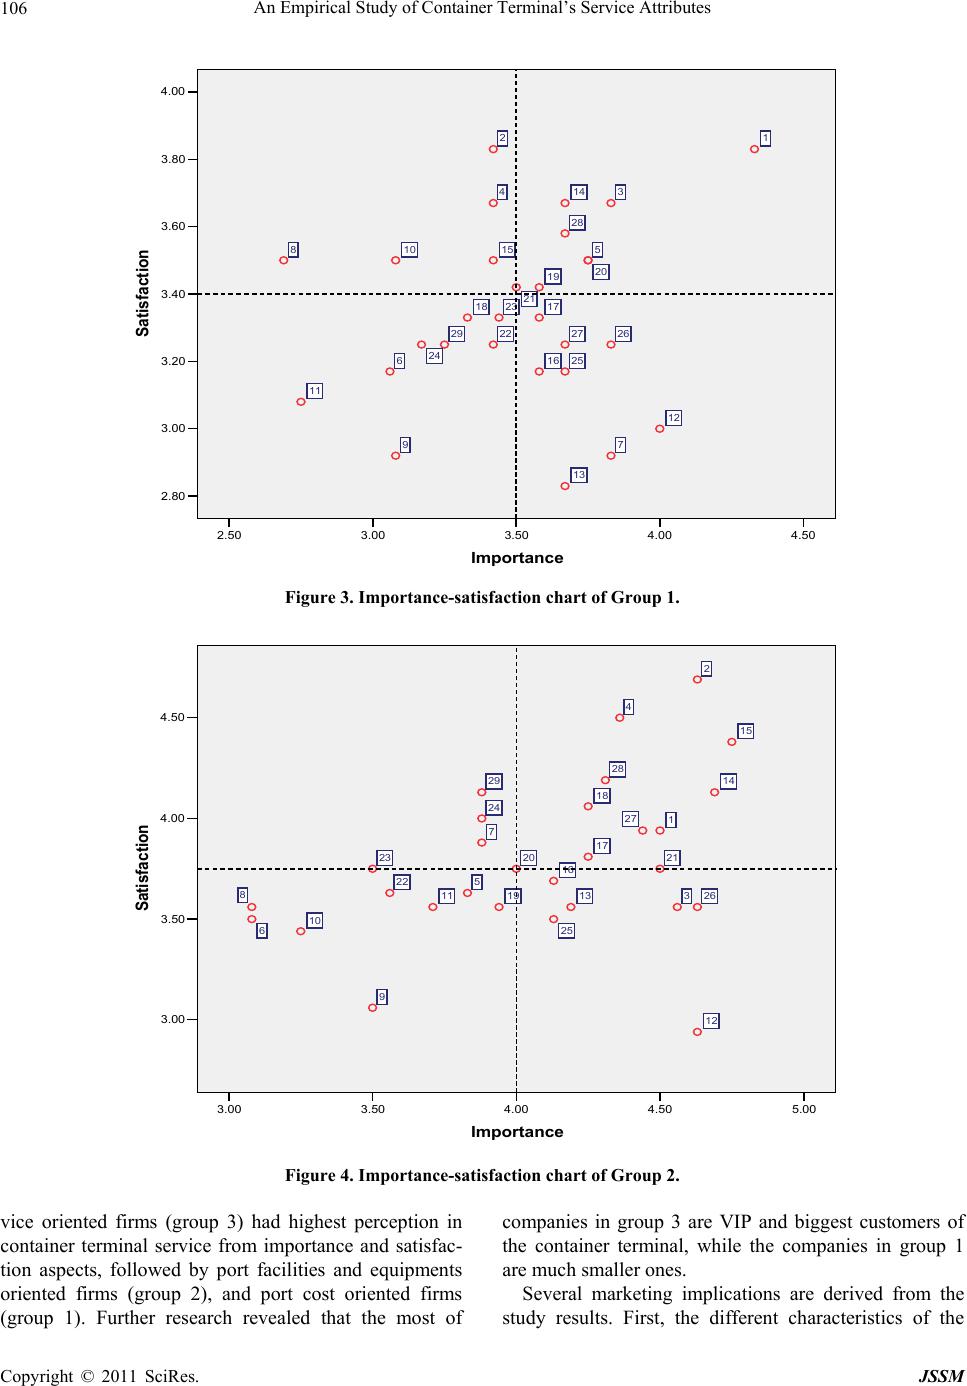 An Empirical Study of Container Terminal’s Service Attributes 106 4.504.003.503.002.50 Importance 4.00 3.80 3.60 3.40 3.20 3.00 2.80 Satisfaction 29 28 27 26 25 24 23 22 21 20 19 18 17 16 15 14 13 12 11 10 9 8 7 6 5 4 3 2 1 Figure 3. Importance-satisfaction chart of Group 1. 5.004.504.003.503.00 Importance 4.50 4.00 3.50 3.00 Satisfaction 29 28 27 26 25 24 23 22 2120 19 18 17 16 15 14 13 12 11 10 9 8 7 6 5 4 3 2 1 Figure 4. Importance-satisfaction chart of Group 2. vice oriented firms (group 3) had highest perception in container terminal service from importance and satisfac- tion aspects, followed by port facilities and equipments oriented firms (group 2), and port cost oriented firms (group 1). Further research revealed that the most of companies in group 3 are VIP and biggest customers of the container terminal, while the companies in group 1 are much smaller ones. Several marketing implications are derived from the study results. First, the different characteristics of the Copyright © 2011 SciRes. JSSM  An Empirical Study of Container Terminal’s Service Attributes 107 5.004.804.604.404.204.00 Importance 5.00 4.50 4.00 3.50 3.00 2.50 Satisfaction 29 28 27 26 25 24 23 22 21 20 19 18 17 16 15 14 13 12 11 10 9 87 6 5 4 3 2 1 Figure 5. Importance-satisfaction chart of Group 3. three groups emphasize container terminal to be ac- quainted with the market. While a strategy of appealing to all customer groups usually results in presenting a fuzzy image in the marketplace, and careful analysis of the various customer groups may enable container ter- minal to appeal to more than one group if the needs of the various customer groups are not in conflict, and the service can be differentiated to meet the needs of various customer groups. For example, the container terminal might emphasize its ability to satisfy the port facilities and equipments of an account perceived as being in the group of port facilities and equipments oriented firms, while stressing special services to another shipping lines and shipping agencies perceived as being a port cost ori- ented firms and emphasizing service efficiency and IT service stability to a third customer that is perceived as being service efficiency and IT service oriented firms. A second implication is that competition among con- tainer terminals will vary from customer group to cus- tomer group. This means that container terminal should think of competition in terms of their customer markets. Marketing activities for each customer group should emphasize the container terminal advantages relative to the needs of each group, the strengths and weaknesses of likely competitors in each customer group as well. Fi- nally, container terminal should not neglect the useful- ness of customer market segmentation and service dif- ferentiation in competition. The ability of the container terminal to detect subtle differences between customers and tailor-made services to the needs of each customer should improve its ability to gain competitive advantage in a competitive environment. One of the major contributions of this study is the use of shipping lines and shipping agencies’ perceptions as data for developing container terminal service segments. This approach has the potential to improve the under- standing of marketing strategies for developing container terminal services or related studies. From a theoretical perspective, this study is the first of its kind in evaluating service attributes and identifying different customer groups for container terminal services. It provides a framework for understanding container terminal services requirements from the shipping lines and shipping agen- cies’ perspective. However, it suffers from several limitations. Firstly, this research was limited to examining service attributes within the particular container terminal in PRC. There exists a wide scope for future research on container ter- minal services issues in a multi-national context. Secondly, though this study was population based, it was cross-sectional in design. Container terminal opera- tors’ perceptions of service attributes were not tested across time. Therefore, future research could usefully identify the levels of importance and the performance of container terminal service attributes from the container terminal operators’ point of view, since this could con- Copyright © 2011 SciRes. JSSM  An Empirical Study of Container Terminal’s Service Attributes 108 ceivably help the container terminal operators better to identify its market segments, differentiate its services, and gain a competitive advantage. Thirdly, the study does not address the issue of cause and effect. The analysis of variance was adequate to ac- knowledge a significant relationship among the various variables. Possibly, the use of ‘structural equation mod- eling’ applications will be necessary to determine if there are any cause and effect relationships between the strate- gic dimensions and performance. Finally, this study was undertaken within a 1 year pe- riod to explore the customer groups. To understand the changes of market groups, it would be helpful to examine a longitudinal period and hence to make comparisons over time. REFERENCES [1] T. A. Oliva, R. L. Oliver and L. C. MacMillan, “A Catas- trophe Model for Developing Service Satisfaction Strate- gies,” Journal of Marketing, Vol. 56, No. 3, 1992, pp. 83-95. doi:10.2307/1252298 [2] C. Homburg, W. D. Hoyer and M. Fassnacht, “Service Orientation of a Retailer’s Business Strategy: Dimensions, Antecedents, and Performance Outcomes,” Journal of Marketing, Vol. 66, No. 4, 2002, pp. 86-101. doi:10.1509/jmkg.66.4.86.18511 [3] M. A. McGinnis, “Shipper Attitudes towards Freight Transport Choice: A Factor Analytical Study,” Interna- tional Journal of Physical Distribution and Materials Management, Vol. 10, No. 1, 1979, pp. 25-34. [4] F. M. Collison, “Market Segments for Marine Liner Ser- vice,” Transportation, Vol. 24, No. 2, 1984, pp. 40-54. [5] T. J. Mahmud, “Marketing of Freight Liner Shipping Services with Reference to the Far East-Europe Trade: A Malaysian Perspective,” Ph.D. Dissertation, Department of Maritime Studies and International Transport, Univer- sity of Wales College of Cardiff, UK, 1995. [6] R. A. French, “Competition among Selected Eastern Ca- nadian Ports for Foreign Cargo,” Maritime Policy and Management, Vol. 6, No. 1, 1979, pp. 5-14. doi:10.1080/03088837900000042 [7] H. J. Peters, “Structural Changes in International Trade and Transport Markets: The Importance of Markets,” The 2nd KMI International Symposium, Seoul, 1990. [8] H. S. Kim, “A Study on the Decision Components of Shippers’ Port Choice in Korea,” Korea Maritime Insti- tute, Seoul, 1993. [9] G.-T. Yeo and D.-W. Song, “The Hierarchical Analysis of Perceived Competitive: An Application to Korean Container Ports,” Journal of the Eastern Asia Society for Transportation Studies, Vol. 6, No. 1, 2005, pp. 866-880. [10] M. Christopher, “Creating Effective Policies for Cus- tomer Service,” International Journal of Physical distri- bution and Materials Management, Vol. 13, No. 2, 1983, pp. 3-24. [11] P. R. Murphy and J. M. Daley, “A Framework for Ap- plying Logistical Segmentation,” International Journal of Physical Distribution and Logistics Management, Vol. 24, No. 10, 1994, pp. 13-19. doi:10.1108/09600039410074764 [12] M. A. McGinnis, “Segmenting Freight Markets,” Trans- portation, Vol. 18, No. 1, 1978, pp. 58-68. [13] P. Gilmour, G. Borg, P. A. Duffy, et al., “Customer Ser- vice: Differentiating by Market Segment,” International Journal of Physical Distribution and Logistics manage- ment, Vol. 24, No. 4, 1995, pp.18-23. doi:10.1108/09600039410757603 [14] T. V. Bonoma and B. P. Shapiro, “Segmenting the Indus- trial Market,” Lexington Books, Lexington, 1983. [15] C.-S. Lu, “Market Segment Evaluation and International Distribution Centers,” Transportation Research Part E, Vol. 39, No. 1, 2003, pp. 49-60. doi:10.1016/S1366-5545(02)00022-4 [16] C.-S. Lu and K.-C. Shang, “An Empirical Investigation of Safety Climate in Container Terminal Operators,” Jour- nal of Safety Research, Vol. 36, No. 3, 2005, pp. 297-308. doi:10.1016/j.jsr.2005.05.002 [17] C.-S. Lu, K.-H. Lai and T. C. E. Cheng, “An Evaluation of Web Site Services in Liner Shipping in Taiwan,” Transportation, Vol. 32, No. 3, 2005, pp. 293-318. doi:10.1007/s11116-004-8245-8 [18] G. A. Churchill, “Marketing Research: Methodological Foundation,” 5th Edition, Dryden Press, New York, 1991. [19] D. R. Cooper, C. W. Emory, “Business Research Meth- ods,” 5th Edition, Irwin, 1995. [20] A. I. Glendon and D. K. Litherland, “Safety Climate Fac- tors, Group Differences and Safety Behavior in Road Construction,” Safety Science, Vol. 39, No. 2, 2001, pp. 157-188. doi:10.1016/S0925-7535(01)00006-6 [21] B. E. Hayes, J. Perander and T. Smecko, “Measuring Perceptions of Workplace Safety: Development and Validation of the Work Safety Scale,” Journal of Safety Research, Vol. 29, No. 3, 1998, pp. 145-161. doi:10.1016/S0022-4375(98)00011-5 [22] K. Mearns, S. M. Whitaker and R. Flin, “Safety Climate, safety Management Practice and Safety Performance in Offshore Environments,” Safety Science, Vol. 41, No. 3, 2003, pp. 641-680. doi:10.1016/S0925-7535(02)00011-5 [23] J. Hair, R. Anderson and R. Tatham, “Multivariate Data Analysis with Readings,” 4th Edition, Prentice Hall In- ternational, Englewood Chiffs, 1995. [24] J. O. Kim and C. W. Muller, “Introduction to Factor Analysis What It is and How to Do It,” Quantitative Ap- plications in the Social Sciences University Paper, 1978. [25] J. C. Nunnally, “Psychometric Theory,” 2nd Edition, McGraw-Hill, New York, 1978. [26] U. Sekaran, “Research Methods for Business,” 2nd Edi- tion, John Wiley & Sons, New York, 1992. Copyright © 2011 SciRes. JSSM  An Empirical Study of Container Terminal’s Service Attributes Copyright © 2011 SciRes. JSSM 109 [27] M. R. Brooks, “Ocean Carrier Selection Criteria in a New Environment,” Logistics and Transportation Review, Vol. 26, No. 4, 1990, pp. 339-356. [28] S. M. Matear and R. Gray, “Factors Influencing Freight Service Choice for Shippers and Freight Suppliers,” In- ternational Journal of Physical Distribution and Logistics Management, Vol. 23, No. 3, 1993, pp. 25-35. [29] R. H. Chiu, “Logistics Performance of Liner Shipping in Taiwan,” Ph.D. Dissertation, Department of Maritime Studies and International Transport, College of Cardiff, University of Wales, 1996. [30] C.-S. Lu, “Logistics Services in Taiwanese Maritime Firms,” Transportation Research Part E: Logistics and Transportation Review, Vol. 36, No. 2, 2000, pp. 79-96. doi:10.1016/S1366-5545(99)00022-8
|