Paper Menu >>
Journal Menu >>
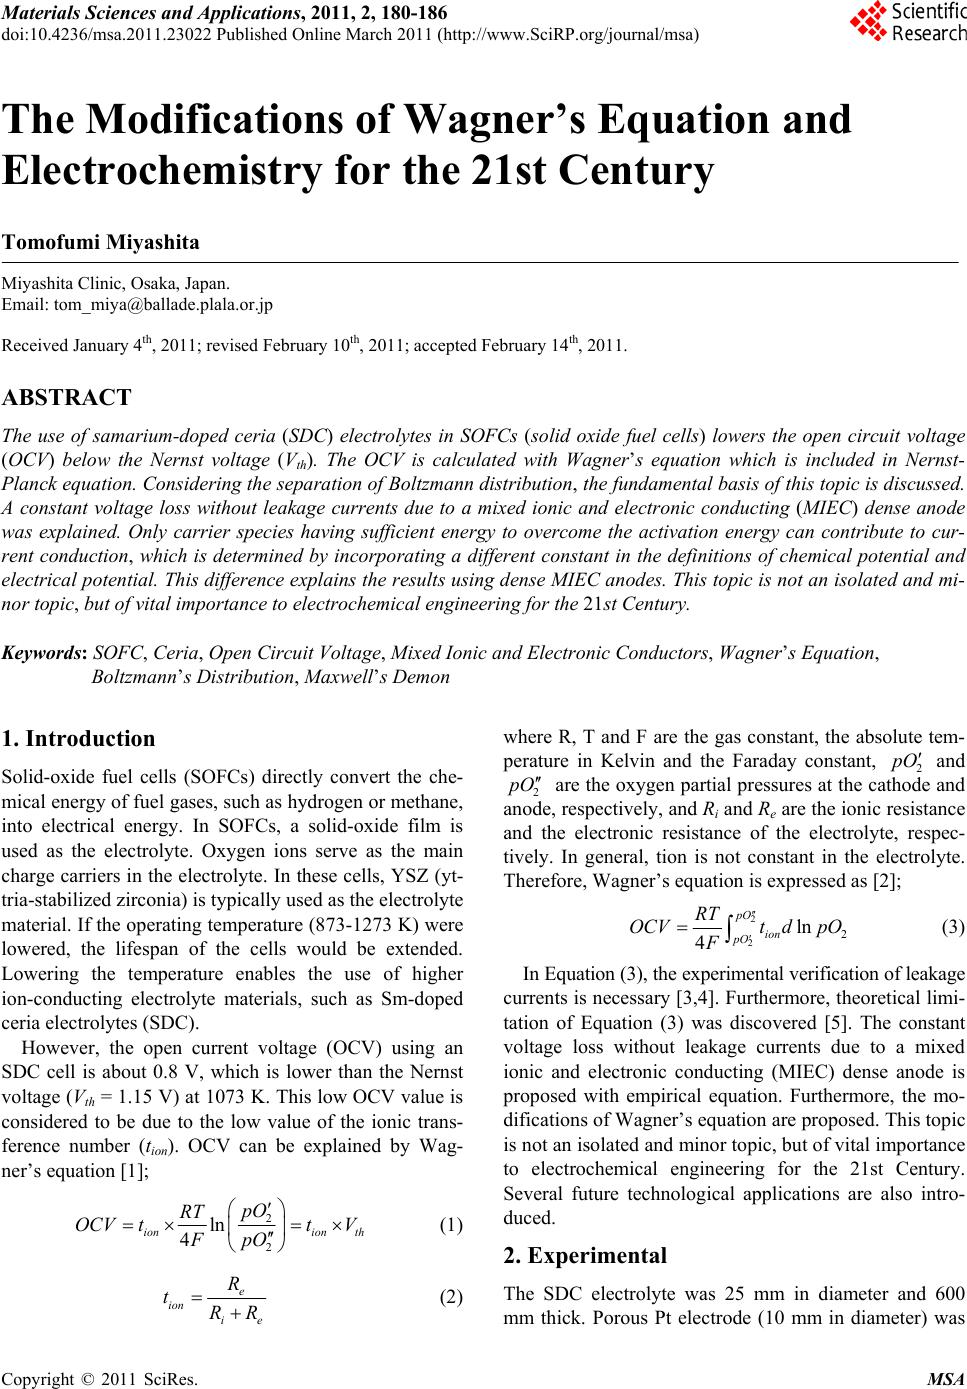 Materials Sciences and Applications, 2011, 2, 180-186 doi:10.4236/msa.2011.23022 Published Online March 2011 (http://www.SciRP.org/journal/msa) Copyright © 2011 SciRes. MSA The Modifications of Wagner’s Equation and Electrochemistry for the 21st Century Tomofumi Miyashita Miyashita Clinic, Osaka, Japan. Email: tom_miya@ballade.plala.or.jp Received January 4th, 2011; revised February 10th, 2011; accepted February 14th, 2011. ABSTRACT The use of samarium-doped ceria (SDC) electrolytes in SOFCs (solid oxide fuel cells) lowers the open circuit voltage (OCV) below the Nernst voltage (Vth). The OCV is calculated with Wagner’s equation which is included in Nernst- Planck equation. Considering the separation of Boltzmann distribution, the fundamental basis of this topic is discussed. A constant voltage loss without leakage currents due to a mixed ionic and electronic conducting (MIEC) dense anode was explained. Only carrier species having sufficient energy to overcome the activation energy can contribute to cur- rent conduction, which is determined by incorporating a different constant in the definitions of chemical potential and electrical potential. This difference explains the results using dense MIEC anodes. This topic is not an isolated and mi- nor topic, but of vital importance to electrochemical engineering for the 21st Century. Keywords: SOFC, Ceria, Open Circuit Voltage, Mixed Ionic and Electronic Conductors, Wagner’s Equation, Boltzmann’s Distribution, Maxwell’s Demon 1. Introduction Solid-oxide fuel cells (SOFCs) directly convert the che- mical energy of fuel gases, such as hydrogen or methane, into electrical energy. In SOFCs, a solid-oxide film is used as the electrolyte. Oxygen ions serve as the main charge carriers in the electrolyte. In these cells, YSZ (yt- tria-stabilized zirconia) is typically used as the electrolyte material. If the operating temperature (873-1273 K) were lowered, the lifespan of the cells would be extended. Lowering the temperature enables the use of higher ion-conducting electrolyte materials, such as Sm-doped ceria electrolytes (SDC). However, the open current voltage (OCV) using an SDC cell is about 0.8 V, which is lower than the Nernst voltage (Vth = 1.15 V) at 1073 K. This low OCV value is considered to be due to the low value of the ionic trans- ference number (tion). OCV can be explained by Wag- ner’s equation [1]; 2 2 ln 4 ionion th pO RT OCV ttV FpO (1) e ion ie R tRR (2) where R, T and F are the gas constant, the absolute tem- perature in Kelvin and the Faraday constant, 2 pO and 2 pO are the oxygen partial pressures at the cathode and anode, respectively, and Ri and Re are the ionic resistance and the electronic resistance of the electrolyte, respec- tively. In general, tion is not constant in the electrolyte. Therefore, Wagner’s equation is expressed as [2]; 2 22 ln 4 pO ion pO RT OCVt dpO F (3) In Equation (3), the experimental verification of leakage currents is necessary [3,4]. Furthermore, theoretical limi- tation of Equation (3) was discovered [5]. The constant voltage loss without leakage currents due to a mixed ionic and electronic conducting (MIEC) dense anode is proposed with empirical equation. Furthermore, the mo- difications of Wagner’s equation are proposed. This topic is not an isolated and minor topic, but of vital importance to electrochemical engineering for the 21st Century. Several future technological applications are also intro- duced. 2. Experimental The SDC electrolyte was 25 mm in diameter and 600 mm thick. Porous Pt electrode (10 mm in diameter) was 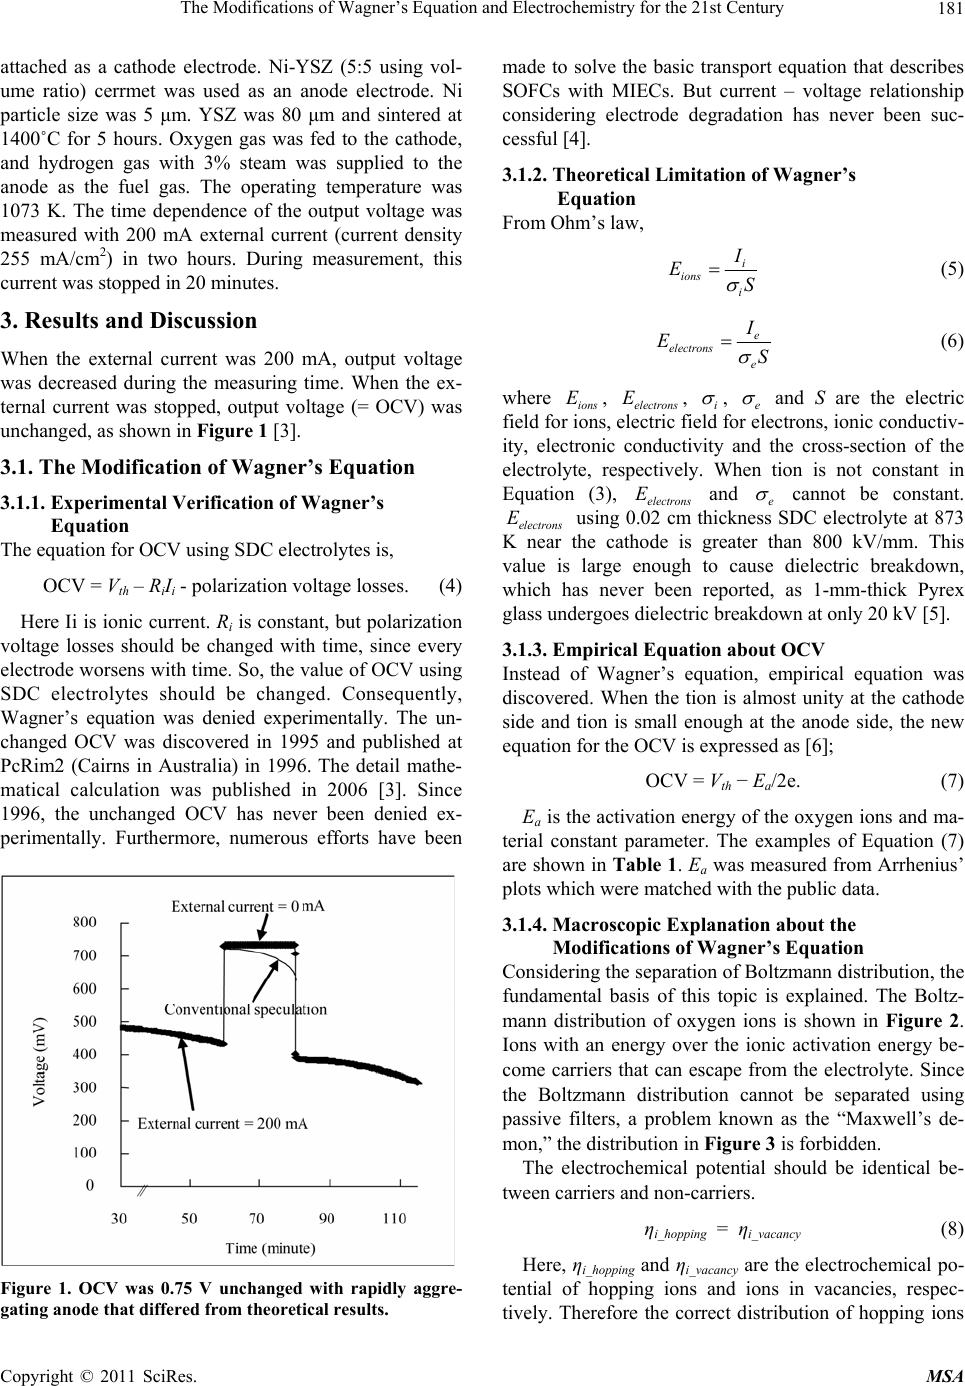 The Modifications of Wagner’s Equation and Electrochemistry for the 21st Century Copyright © 2011 SciRes. MSA 181 attached as a cathode electrode. Ni-YSZ (5:5 using vol- ume ratio) cerrmet was used as an anode electrode. Ni particle size was 5 μm. YSZ was 80 μm and sintered at 1400˚C for 5 hours. Oxygen gas was fed to the cathode, and hydrogen gas with 3% steam was supplied to the anode as the fuel gas. The operating temperature was 1073 K. The time dependence of the output voltage was measured with 200 mA external current (current density 255 mA/cm2) in two hours. During measurement, this current was stopped in 20 minutes. 3. Results and Discussion When the external current was 200 mA, output voltage was decreased during the measuring time. When the ex- ternal current was stopped, output voltage (= OCV) was unchanged, as shown in Figure 1 [3]. 3.1. The Modification of Wagner’s Equation 3.1.1. Experimental Verification of Wagner’s Equation The equation for OCV using SDC electrolytes is, OCV = Vth – RiIi - polarization voltage losses. (4) Here Ii is ionic current. Ri is constant, but polarization voltage losses should be changed with time, since every electrode worsens with time. So, the value of OCV using SDC electrolytes should be changed. Consequently, Wagner’s equation was denied experimentally. The un- changed OCV was discovered in 1995 and published at PcRim2 (Cairns in Australia) in 1996. The detail mathe- matical calculation was published in 2006 [3]. Since 1996, the unchanged OCV has never been denied ex- perimentally. Furthermore, numerous efforts have been Figure 1. OCV was 0.75 V unchanged with rapidly aggre- gating anode that differed from theoretical results. made to solve the basic transport equation that describes SOFCs with MIECs. But current – voltage relationship considering electrode degradation has never been suc- cessful [4]. 3.1.2. Theoretical Limitation of Wagner’s Equation From Ohm’s law, i ions i I ES (5) e electrons e I ES (6) where ions E, electrons E, i , e and S are the electric field for ions, electric field for electrons, ionic conductiv- ity, electronic conductivity and the cross-section of the electrolyte, respectively. When tion is not constant in Equation (3), electrons E and e cannot be constant. electrons E using 0.02 cm thickness SDC electrolyte at 873 K near the cathode is greater than 800 kV/mm. This value is large enough to cause dielectric breakdown, which has never been reported, as 1-mm-thick Pyrex glass undergoes dielectric breakdown at only 20 kV [5]. 3.1.3. Empirical Equation about OCV Instead of Wagner’s equation, empirical equation was discovered. When the tion is almost unity at the cathode side and tion is small enough at the anode side, the new equation for the OCV is expressed as [6]; OCV = Vth − Ea/2e. (7) Ea is the activation energy of the oxygen ions and ma- terial constant parameter. The examples of Equation (7) are shown in Table 1. Ea was measured from Arrhenius’ plots which were matched with the public data. 3.1.4. Macroscopic Explanation about the Modificati o ns of Wagner’s Equation Considering the separation of Boltzmann distribution, the fundamental basis of this topic is explained. The Boltz- mann distribution of oxygen ions is shown in Figure 2. Ions with an energy over the ionic activation energy be- come carriers that can escape from the electrolyte. Since the Boltzmann distribution cannot be separated using passive filters, a problem known as the “Maxwell’s de- mon,” the distribution in Figure 3 is forbidden. The electrochemical potential should be identical be- tween carriers and non-carriers. ηi_hopping = ηi_vacancy (8) Here, ηi_hopping and ηi_vacancy are the electrochemical po- tential of hopping ions and ions in vacancies, respec- tively. Therefore the correct distribution of hopping ions 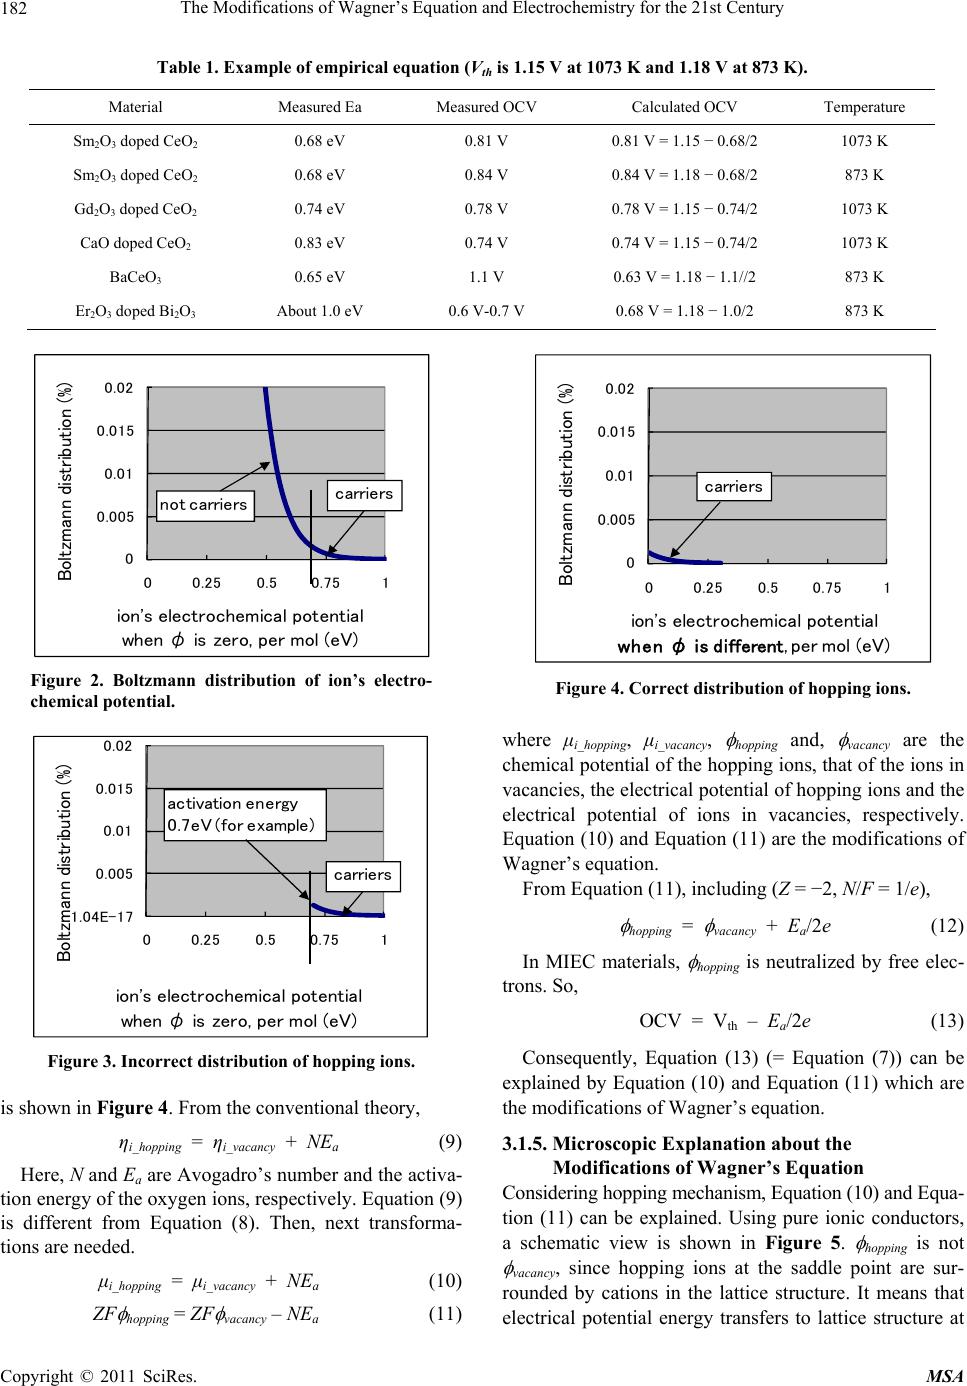 The Modifications of Wagner’s Equation and Electrochemistry for the 21st Century Copyright © 2011 SciRes. MSA 182 Table 1. Example of empirical equation (Vth is 1.15 V at 1073 K and 1.18 V at 873 K). Material Measured Ea Measured OCV Calculated OCV Temperature Sm2O3 doped CeO2 0.68 eV 0.81 V 0.81 V = 1.15 − 0.68/2 1073 K Sm2O3 doped CeO2 0.68 eV 0.84 V 0.84 V = 1.18 − 0.68/2 873 K Gd2O3 doped CeO2 0.74 eV 0.78 V 0.78 V = 1.15 − 0.74/2 1073 K CaO doped CeO2 0.83 eV 0.74 V 0.74 V = 1.15 − 0.74/2 1073 K BaCeO3 0.65 eV 1.1 V 0.63 V = 1.18 − 1.1//2 873 K Er2O3 doped Bi2O3 About 1.0 eV 0.6 V-0.7 V 0.68 V = 1.18 − 1.0/2 873 K 0 0.005 0.01 0.015 0.02 00.250.5 0.751 Boltzmann distribution (%) ion's electrochemical potential when φ is zero, per mol (eV) carriers not carriers Figure 2. Boltzmann distribution of ion’s electro- chemical potential. -1.04E-17 0.005 0.01 0.015 0.02 00.250.5 0.751 Boltzmann distribution (%) ion's electrochemical potential when φ is zero, per mol(eV) carriers activation energy 0.7eV (for example) Figure 3. Incorrect distribution of hopping ions. is shown in Figure 4. From the conventional theory, ηi_hopping = ηi_vacancy + NEa (9) Here, N and Ea are Avogadro’s number and the activa- tion energy of the oxygen ions, respectively. Equation (9) is different from Equation (8). Then, next transforma- tions are needed. μi_hopping = μi_vacancy + NEa (10) ZF hopping = ZF vacancy – NEa (11) 0 0.005 0.01 0.015 0.02 00.250.5 0.751 Boltzmann distribution (%) ion's electrochemical potential when φ is different, per mol(eV) carriers Figure 4. Correct distribution of hopping ions. where μi_hopping, μi_vacancy, hopping and, vacancy are the chemical potential of the hopping ions, that of the ions in vacancies, the electrical potential of hopping ions and the electrical potential of ions in vacancies, respectively. Equation (10) and Equation (11) are the modifications of Wagner’s equation. From Equation (11), including (Z = −2, N/F = 1/e), hopping = vacancy + Ea/2e (12) In MIEC materials, hopping is neutralized by free elec- trons. So, OCV = Vth – Ea/2e (13) Consequently, Equation (13) (= Equation (7)) can be explained by Equation (10) and Equation (11) which are the modifications of Wagner’s equation. 3.1.5. Microsc opi c Expl a na t i on ab out the Modificati o ns of Wagner’s Equation Considering hopping mechanism, Equation (10) and Equa- tion (11) can be explained. Using pure ionic conductors, a schematic view is shown in Figure 5. hopping is not vacancy, since hopping ions at the saddle point are sur- rounded by cations in the lattice structure. It means that electrical potential energy transfers to lattice structure at 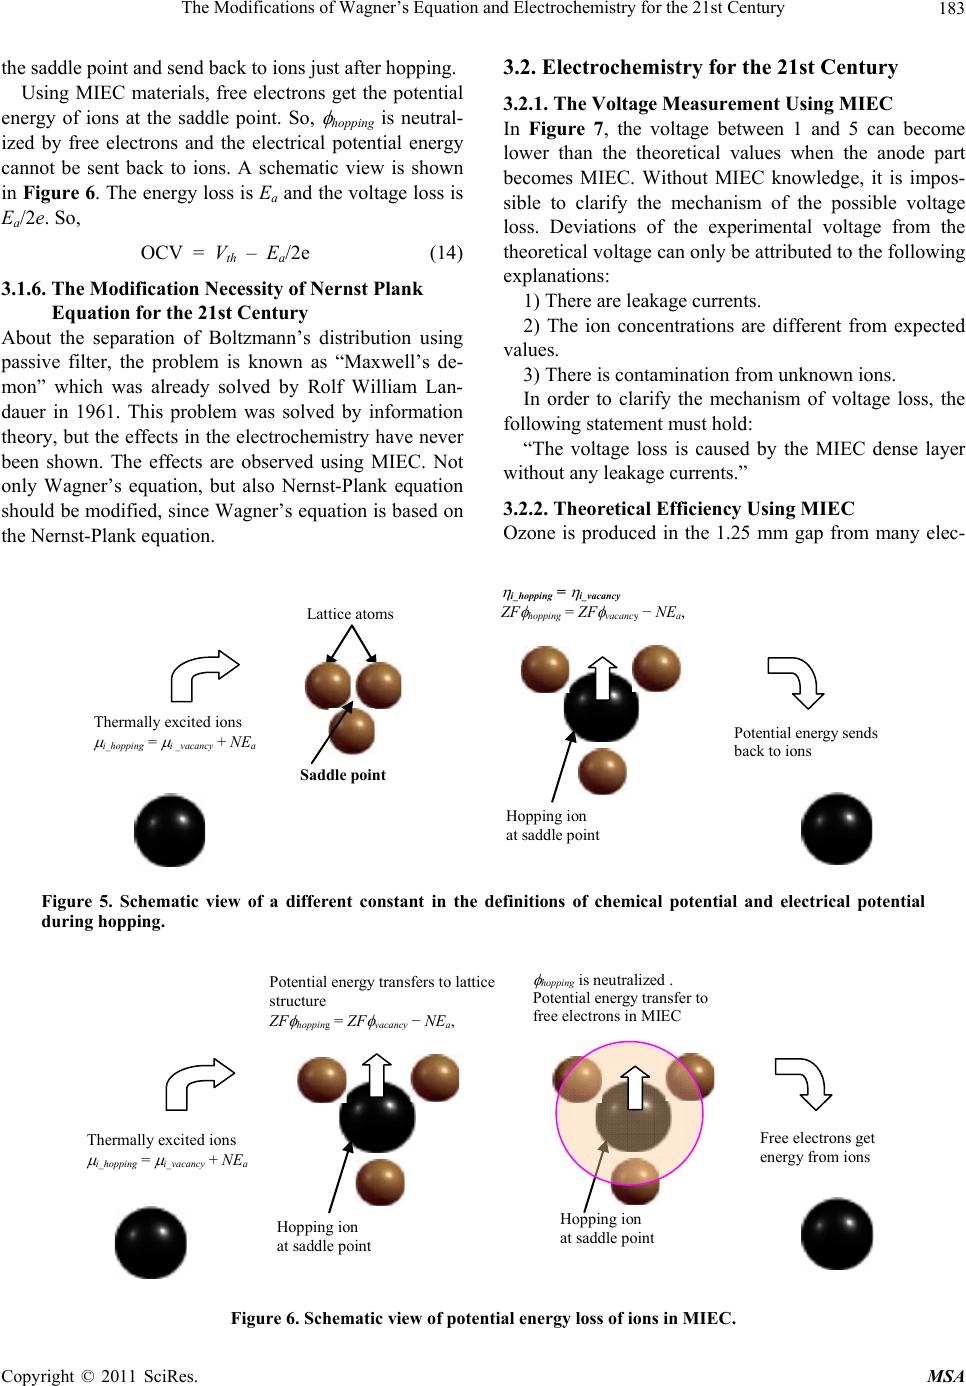 The Modifications of Wagner’s Equation and Electrochemistry for the 21st Century Copyright © 2011 SciRes. MSA 183 the saddle point and send back to ions just after hopping. Using MIEC materials, free electrons get the potential energy of ions at the saddle point. So, hopping is neutral- ized by free electrons and the electrical potential energy cannot be sent back to ions. A schematic view is shown in Figure 6. The energy loss is Ea and the voltage loss is Ea/2e. So, OCV = Vth – Ea/2e (14) 3.1.6. The Modi fi cation Necessity of Nern st Pl ank Equation for the 21st Century About the separation of Boltzmann’s distribution using passive filter, the problem is known as “Maxwell’s de- mon” which was already solved by Rolf William Lan- dauer in 1961. This problem was solved by information theory, but the effects in the electrochemistry have never been shown. The effects are observed using MIEC. Not only Wagner’s equation, but also Nernst-Plank equation should be modified, since Wagner’s equation is based on the Nernst-Plank equation. 3.2. Electrochemistry for the 21st Century 3.2.1. The Vol ta ge Me asurement Using MIE C In Figure 7, the voltage between 1 and 5 can become lower than the theoretical values when the anode part becomes MIEC. Without MIEC knowledge, it is impos- sible to clarify the mechanism of the possible voltage loss. Deviations of the experimental voltage from the theoretical voltage can only be attributed to the following explanations: 1) There are leakage currents. 2) The ion concentrations are different from expected values. 3) There is contamination from unknown ions. In order to clarify the mechanism of voltage loss, the following statement must hold: “The voltage loss is caused by the MIEC dense layer without any leakage currents.” 3.2.2. Theoretical Efficiency Using MIEC Ozone is produced in the 1.25 mm gap from many elec- Lattice atoms Saddle poin t Hopping ion at saddle point Thermally excited ions i_hopping = i _vacancy + NE a i_hopping = i_vacancy ZF hopping = ZF vacancy − NE a , Potential energy sends back to ions Figure 5. Schematic view of a different constant in the definitions of chemical potential and electrical potential during hopping. Thermally excited ions i_hopping = i_vacancy + NE a Hopping ion at saddle point hopping is neutralized . Potential energy transfer to free electrons in MIEC Free electrons get energy from ions Hopping ion at saddle point Potential energy transfers to lattice structure ZF hopping = ZF vacancy − NE a , Figure 6. Schematic view of potential energy loss of ions in MIEC.  The Modifications of Wagner’s Equation and Electrochemistry for the 21st Century Copyright © 2011 SciRes. MSA 184 trical discharges reacting with oxygen gas shown in Fig- ure 8: O2 + electron (electrical discharges) → 2 O (15) O + O2 → O 3 (16) The technological efficiency is only 7% of the theo- Damaged area to be MIEC Figure 7. Schematic diagram of an ion channel (from free Wikipedia, http://en.wikipe dia.org/wiki/Ion_channel) 1: Channel domains (typically four per channel), 2: Outer vestibule, 3: Selectivity filter, 4: Diameter of selectivity filter, 5: Phosphorylation site, 6: Cell membrane. Figure 8. The structure of ozone generator. Figure 9. Sludge concentration measurement using micro- wave. Figure 10. OCV is larger than a single SDC. Figure11. OCV is smaller than Nernst voltage. Figure 12. Explanation of rectification between two electro- lytes. 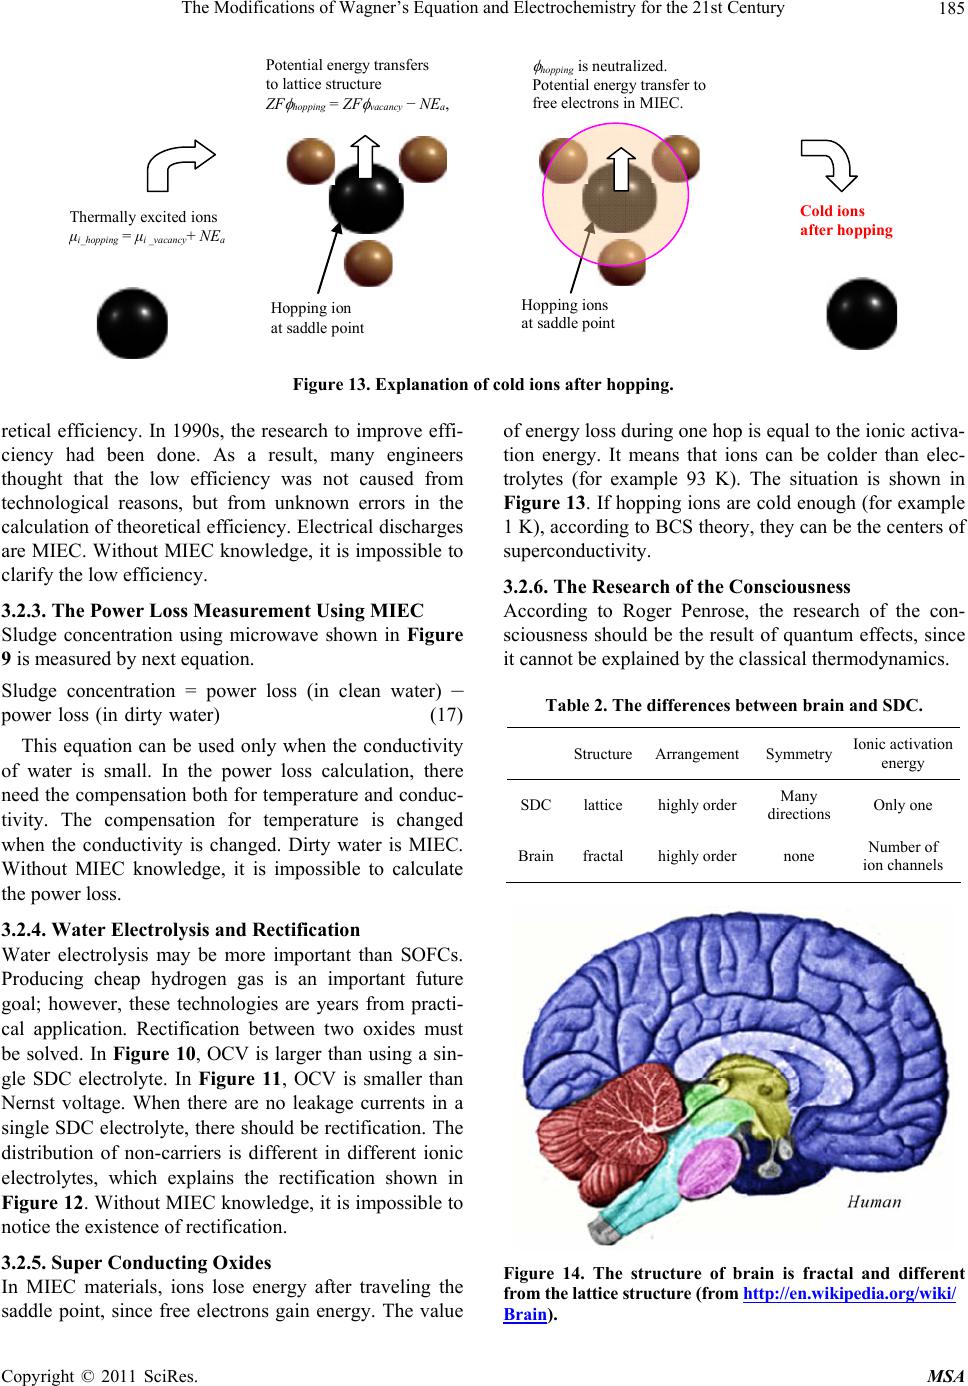 The Modifications of Wagner’s Equation and Electrochemistry for the 21st Century Copyright © 2011 SciRes. MSA 185 Thermally excited ions μ i_hopping = μ i _vacancy + NE a Hopping ions at saddle point hopping is neutralized. Potential energy transfer to free electrons in MIEC. Cold io n s after hopping Hopping ion at saddle point Potential energy transfers to lattice structure ZF hopping = ZF vacancy − NE a , Figure 13. Explanation of cold ions after hopping. retical efficiency. In 1990s, the research to improve effi- ciency had been done. As a result, many engineers thought that the low efficiency was not caused from technological reasons, but from unknown errors in the calculation of theoretical efficiency. Electrical discharges are MIEC. Without MIEC knowledge, it is impossible to clarify the low efficiency. 3.2.3. The Power Loss Measurement Using MIEC Sludge concentration using microwave shown in Figure 9 is measured by next equation. Sludge concentration = power loss (in clean water) – power loss (in dirty water) (17) This equation can be used only when the conductivity of water is small. In the power loss calculation, there need the compensation both for temperature and conduc- tivity. The compensation for temperature is changed when the conductivity is changed. Dirty water is MIEC. Without MIEC knowledge, it is impossible to calculate the power loss. 3.2.4. Water Electrolysis and Rectification Water electrolysis may be more important than SOFCs. Producing cheap hydrogen gas is an important future goal; however, these technologies are years from practi- cal application. Rectification between two oxides must be solved. In Figure 10, OCV is larger than using a sin- gle SDC electrolyte. In Figure 11, OCV is smaller than Nernst voltage. When there are no leakage currents in a single SDC electrolyte, there should be rectification. The distribution of non-carriers is different in different ionic electrolytes, which explains the rectification shown in Figure 12. Without MIEC knowledge, it is impossible to notice the existence of rectification. 3.2.5. Super Cond ucting Oxides In MIEC materials, ions lose energy after traveling the saddle point, since free electrons gain energy. The value of energy loss during one hop is equal to the ionic activa- tion energy. It means that ions can be colder than elec- trolytes (for example 93 K). The situation is shown in Figure 13. If hopping ions are cold enough (for example 1 K), according to BCS theory, they can be the centers of superconductivity. 3.2.6. The Research of the Consciousness According to Roger Penrose, the research of the con- sciousness should be the result of quantum effects, since it cannot be explained by the classical thermodynamics. Table 2. The differences between brain and SDC. StructureArrangement Symmetry Ionic activation energy SDClattice highly order Many directions Only one Brainfractal highly order none Number of ion channels Figure 14. The structure of brain is fractal and different from the lattice structure (from http://en.wikipe dia. org/wiki/ Brain). 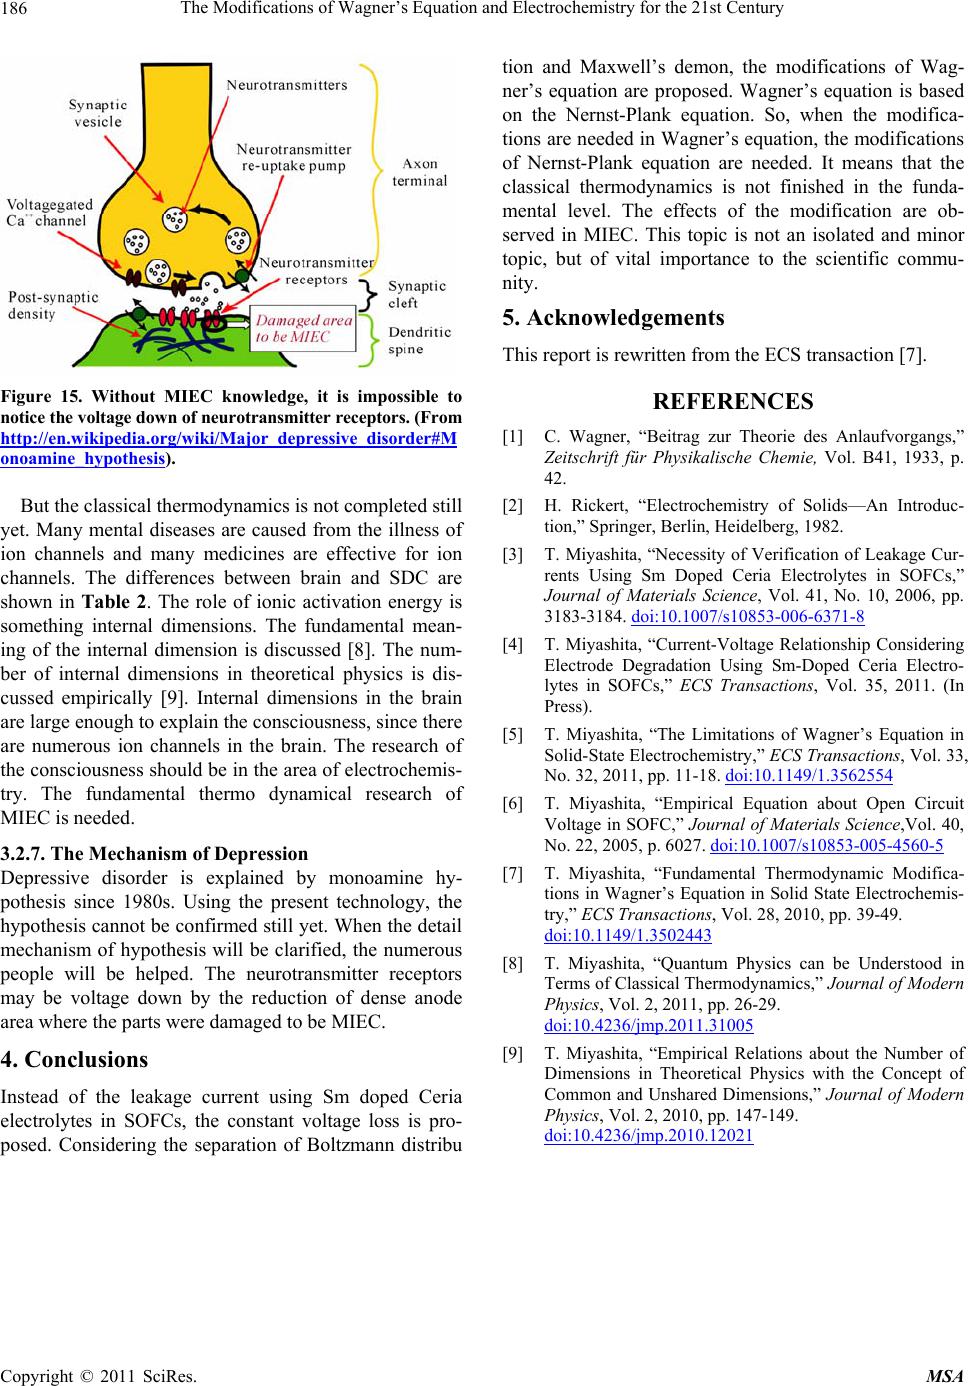 The Modifications of Wagner’s Equation and Electrochemistry for the 21st Century Copyright © 2011 SciRes. MSA 186 Figure 15. Without MIEC knowledge, it is impossible to notice the voltage down of neurotransmitter receptors. (From http://en.wikipedia.org/wiki/Major_depressive_disorder#M onoamine_hypothesis). But the classical thermodynamics is not completed still yet. Many mental diseases are caused from the illness of ion channels and many medicines are effective for ion channels. The differences between brain and SDC are shown in Table 2. The role of ionic activation energy is something internal dimensions. The fundamental mean- ing of the internal dimension is discussed [8]. The num- ber of internal dimensions in theoretical physics is dis- cussed empirically [9]. Internal dimensions in the brain are large enough to explain the consciousness, since there are numerous ion channels in the brain. The research of the consciousness should be in the area of electrochemis- try. The fundamental thermo dynamical research of MIEC is needed. 3.2.7. The Mechanism of Depression Depressive disorder is explained by monoamine hy- pothesis since 1980s. Using the present technology, the hypothesis cannot be confirmed still yet. When the detail mechanism of hypothesis will be clarified, the numerous people will be helped. The neurotransmitter receptors may be voltage down by the reduction of dense anode area where the parts were damaged to be MIEC. 4. Conclusions Instead of the leakage current using Sm doped Ceria electrolytes in SOFCs, the constant voltage loss is pro- posed. Considering the separation of Boltzmann distribu tion and Maxwell’s demon, the modifications of Wag- ner’s equation are proposed. Wagner’s equation is based on the Nernst-Plank equation. So, when the modifica- tions are needed in Wagner’s equation, the modifications of Nernst-Plank equation are needed. It means that the classical thermodynamics is not finished in the funda- mental level. The effects of the modification are ob- served in MIEC. This topic is not an isolated and minor topic, but of vital importance to the scientific commu- nity. 5. Acknowledgements This report is rewritten from the ECS transaction [7]. REFERENCES [1] C. Wagner, “Beitrag zur Theorie des Anlaufvorgangs,” Zeitschrift für Physikalische Chemie, Vol. B41, 1933, p. 42. [2] H. Rickert, “Electrochemistry of Solids—An Introduc- tion,” Springer, Berlin, Heidelberg, 1982. [3] T. Miyashita, “Necessity of Verification of Leakage Cur- rents Using Sm Doped Ceria Electrolytes in SOFCs,” Journal of Materials Science, Vol. 41, No. 10, 2006, pp. 3183-3184. doi:10.1007/s10853-006-6371-8 [4] T. Miyashita, “Current-Voltage Relationship Considering Electrode Degradation Using Sm-Doped Ceria Electro- lytes in SOFCs,” ECS Transactions, Vol. 35, 2011. (In Press). [5] T. Miyashita, “The Limitations of Wagner’s Equation in Solid-State Electrochemistry,” ECS Transactions, Vol. 33, No. 32, 2011, pp. 11-18. doi:10.1149/1.3562554 [6] T. Miyashita, “Empirical Equation about Open Circuit Voltage in SOFC,” Journal of Materials Science,Vol. 40, No. 22, 2005, p. 6027. doi:10.1007/s10853-005-4560-5 [7] T. Miyashita, “Fundamental Thermodynamic Modifica- tions in Wagner’s Equation in Solid State Electrochemis- try,” ECS Transactions, Vol. 28, 2010, pp. 39-49. doi:10.1149/1.3502443 [8] T. Miyashita, “Quantum Physics can be Understood in Terms of Classical Thermodynamics,” Journal of Modern Physics, Vol. 2, 2011, pp. 26-29. doi:10.4236/jmp.2011.31005 [9] T. Miyashita, “Empirical Relations about the Number of Dimensions in Theoretical Physics with the Concept of Common and Unshared Dimensions,” Journal of Modern Physics, Vol. 2, 2010, pp. 147-149. doi:10.4236/jmp.2010.12021 |