 Journal of Human Resource and Sustainability Studies, 2013, 1, 85-92 Published Online December 2013 (http://www.scirp.org/journal/jhrss) http://dx.doi.org/10.4236/jhrss.2013.14012 Open Access JHRSS Empirical Analysis about Satisfaction Influencing Factors of Core Employee in Chinese Small and Micro Enterprise Pingping Xu, Ling Qiu School of Management, Shanghai University of Engineering Science, Shanghai, China Email: Xupingping0529@163.com Received October 26, 2013; revised November 28, 2013; accepted December 6, 2013 Copyright © 2013 Pingping Xu, Ling Qiu. This is an open access article distributed under the Creative Commons Attribution License, which permits unrestricted use, distribution, and reproduction in any medium, provided the original work is properly cited. In accor- dance of the Creative Commons Attribution License all Copyrights © 2013 are reserved for SCIRP and the owner of the intellectual property Pingping Xu, Ling Qiu. All Copyright © 2013 are guarded by law and by SCIRP as a guardian. ABSTRACT The small and micro enterprises have made an important part of the national economy, and they develop rapidly in re- cent years. Now, there are a large number of small and micro enterprises in China. They have strong employment ab- sorption ability, and they are important objects that are supported by the state. However, the average life of small and micro enterprises is relatively short and the ability of sustainable development is not strong. The main reason is the turnover of enterprises’ core staff. There are many reasons that cause the loss of core staff, including the development scale and development prospect of the small micro enterprise, and the related human resource decisions. Therefore, this paper is devoted to the study of factors that affect satisfaction of core staff in small and micro enterprises, and explores what factor plays a key role in improving the core employee satisfaction. The characteristic o f this paper is to evaluate the satisfaction degree by combining the method of entropy weight method with grey relational analysis, and to estab- lish the corresponding model. The model can reduce the influence of subjective factors, and improve the analysis accu- racy of satisfaction influencing factors, thus practically provide a theoretical basis for the decision- making ab out human resources of small micro enterprise. Keywords: Small and Micro Enterprises; Core Employee; Satisfaction; Entropy Weight Method; Grey Relational Analysis 1. Introduction Small and micro enterprise is an important part of Chi- nese economic society. In recent years, under the cons- tant support o f national po licy, small busin ess has sprung up like mushrooms. Although the scale of the enterprise is small and the amount of money is limited, it has the vital significance to expand the social employment and make the national economy stable. But now the devel- opment prospect of small and micro enterprise is not op- timistic, especially the part of human resources, talent turnover rate is really high. The main reason is that the enterprise is hard to attract the core talents because of its own factors such as scale and funding [1]. In addition, human resources management mode is still in its infan cy in most of small and micro enterprise, so that the impro- per talent management leads to the loss of the core staffs. For small and micro enterprise in growth, the core staffs are an important part of enterprise’s core compete- tiveness, also they are the backbone of enterprise devele- pment. The loss of the core talents will make the enter- prise in a passive position in the market competition [2]. Therefore, how to improve the small enterprise’s human resources management system, enhance the satisfaction of enterprise’s core employees, and reduce the turnover of them become the research focus. 2. Review of Re levant Concepts 2.1. The Characteristics of Small and Micro Enterprise Small and micro enterprise is a unified name of small business, miniature enterprise, cottage industr y enterprise and individual industrial and commercial households [3]. This paper defines small and micro enterprise as the en- terprise that has smaller scale of business and funds and less number of employees. Small and micro enterprise has a very wide range of distribution, such as in services, manufacturing, commodity circulation industry, etc. Spe-  P. P. XU, L. QIU 86 cialized service ability of small enterprise is very strong, so that it can carry on th e specialized service for specific customer demand. The development space of small business is very huge, and with the support of govern- ment policy, small and micro enterprise is continuously thriving. The most notable characteristic of small enter- prise is that it has a strong abilit y to absorb employment, which will play an important role in solving the hard situation of Chinese current social employment. Small business can also continuously attract investment, so that to enhance the vitality of market economy and promote the development of the market competition. 2.2. The Connotation of the Core Staffs Many managers think that main benefits of enterprise are created by a handful of employees, who is called core staffs. The core talents have the nature of scarcity, gener- ally account for 20% - 30% of total number of employees, but the value they create accounts for 80% of the total value of the enterprise [4]. This paper defines the core staffs as the employees that grasp knowledge and tech- nology, have the ability to do core business, and occupy important positions in the enterprise. The core staffs have a strong sense of self-awareness and self-consciousness, they can help enterprise to create higher value, and achieve the goals of the enterprise, so as to improve the core competitive advantage of it. And for the enterprises’ de- velopment, the core staffs also have a special strategic vision, so they can help the enterprise to change in the business strategy. They have made outstanding contribu- tions to the experience and growth of the enterprise. The biggest characteristic of the co re talents is that they can’t be replaced, because they have key knowledge and skills of the enterprise, so that ordinary employees can not re- place them in important positions for enterprise operation. In addition, the core employees often focus on play of their skills and development of themselves, so they have a strong desire to realize themselves. They will motivate and urge themselves to achieve these two goals. The core staffs expect to realize its own value in enterprise and gain recognition fro m the society, and they have stronger achievement motivation than ordinary staffs. Just be- cause of particularity of the core employees, their satis- faction requirements are very high. If the enterprise can not meet their needs, or they feel development space for them is limited which make their development is blocked, so they will choose to leave, and this leads to the loss of them. 3. The Research Methods 3.1. Questionnaire Through literature reading, enterprise interview, and re- lated scholars’ advice, the paper determines the factors that affect the small and micro enterprise’s employee satisfaction. After sorting and classifying, mainly divide the influence factors into six categories, respectively is: job, work environment, career development, role satis- faction, job return, as well as the en terprise development, and these are main factors [5]. It also concretely divides the main factors into the sub factors, which is in ord er to research the factors more specifically [6]. In conclusion, there are 30 detailed sub factors, and on the basis of it, design the satisfaction survey questionnaire. Moreover, choose the LIKERT five-point scoring me- thod, each index respectively is very satisfied, satisfied, general, dissatisfied and very dissatisfied [7]. In order to obtain the reliable data, this study selects several typical Chinese small and micro enterprises, and distributes a total of 148 questionnaires, an d there are 113 valid ques- tionnaires. Respondents are mainly the knowledge em- ployees in the small and micro enterprises. Knowledge employees are the staffs that grasp knowledge and tech- nology, have the ability to do the core business, and oc- cupy the important positions in the enterprise. 3.2. Use Delphi Method and Entropy Weight Method to Determine the Weight of Six Indexes 3.2.1. The Delphi Method O. Helm and N. Dalke (1940s) firstly created Delphi method. And after further development by T.J. Golden and the Rand Corporation, it became mature. The Delphi method is a kind of subjective prediction method. It uses back to back communication mode to consult experts’ predictive opinion, and after several rounds of consulta- tion, opinions from the expert panel tend to be concen- trated. As a result, it can forecast the market future trend. Delphi method is based on the application of system, and combines with the method of an onymous comments. It means that team members can not discuss with each other, or have lateral connection. They can only have a relationship with investigators, and fill in the question- naire, so that the investigators can gather opinions from all respondents. Finally, this method can construct the team communication process, and solve complex task problem 3.2.2. The Definition of Entropy Weight Method Choose ij to represent the number expert score to the index , and then standardize the index data [8]: i j min max min ij ij j ij ij ij j j xx x x The proportion of the standardized scores can be ex- pressed as follows: Open Access JHRSS  P. P. XU, L. QIU 87 1 , 1,2,,;1,2,, 10, 6 ij ij m ij i x pimj x mn n Entropy value of the index is: j 1ln m ij ij i kpp Among the above formula, 1 ln km , and also can be expressed as: 1 1ln ln m ij ij i pp m Among the above equation, 0,1;1, 2,,;1, 2,, j imj n n , and if, , the difference coefficient of index is: 0 ij p jln 0 ij ij pp 1,1,2,, jj GHj . The larger value of G, the more important of the in- dex. At last, the weight of each index’s value can be com- puted as follows: 1 ,1,2,, j jn j j G wj G n 3.2.3. Resul ts of Specialist Research After survey, it can get scores of influencing factors from human resource experts, research results are shown in Table 1. Table 1. Ratings of the importance of the influencing fac- tors scored by human resource experts. Job Work environment Career development Role satisfaction Job return Enterprise development 1 91 81 86 85 94 89 2 87 83 88 83 89 92 3 89 79 93 87 91 90 4 90 80 90 88 96 91 5 86 81 86 85 88 92 6 87 84 84 81 90 87 7 86 79 90 83 88 86 8 90 78 85 83 89 84 9 92 86 84 89 91 84 10 88 80 89 81 92 85 Using entropy weight method to calculate the scores in Table 1, it can get entropy value of each influencing factors, respectively is: H = (0.837, 0.864, 0.828, 0.846, 0.812, 0.838), the entropy weight of each influencing factors is: w = (0.168.0.140, 0.176, 0.158, 0.192, 0.166). Therefore, from the large to small of the entropy weight, influencing factors respectively is: Job, Career develop- ment, Enterprise development, Role satisfaction, and Work environment. 3.3. The Grey Correlation Analysis Model 3.3.1. Polarity Reversal of the Data Through questionnaire survey, it can get values of five levels of each affecting factors, and use i j to rep- resent the index value of numberfactor. The calculation process of grey correlation model is as follows. Used i i to represent reference sequence of data behavior of each influencing factor, length of i is n, interval of it is 1, 1,2, , ii ii zz zn. Due to the survey data have both the profitability index and cost index, and the lower value of cost index means the higher satisfaction of the employees. On the contrary, for the profitability in- dex, the larger value of it means the higher satisfaction of the employees. So firstly conduct a polarity reversal to the data [9]. 1) Transform the original maximum sequence as the way follows: 1 ,1 ,1 max i ii im zj jim yj jn Among the above equation, represents the number of the influencing factors, means the five index val- ues. i j 2) Transform the original minimum sequence as the way follows: 1 min ,1 ,1 i im ii yj yjimjn zj In the above formula, represents the number of the influencing factors, means the five index values. i j i j represents the new sequence after the polarity reversal, and after the transformation, all the index values are between 0 ~ 1, 1 is on half of the optimal value, 0 is the worst value. 3.3.2. Gray Absolute Correlation Degrees Also use the behavior sequence of the two influencing factors i and Y Y in the part (1), deal with and i Y Y as the following formula [10]: 01,1,2, , ii i Yykyk n. The available equation is: Open Access JHRSS  P. P. XU, L. QIU 88 00 00 1,2, , ii ii yy yyn As the same way to compute Y, 00 00 1,2,, jj jj Yy yyn Then 100 2 1 2 n ii i k yk yn ; 100 2 1 2 n jj j k yk yn ; 100 00 2 1 2 n iji ji j k sykykykyn Finally, use ij to represent the correlation between i and (The bigger numerical value of ij , the higher correlation of the two data’s behavior sequence). 1 1 ij ij ijij ss sss 3.3.3. Grey Relative Correlation Degrees Also use the behavior sequence of the two influencing factors i and Y Y in the part (1), deal with and i Y Y as the following way: 0,1,2,3,, 1 i ii yk yk kn y The available equ ation is: 00 00 1,2, , ii ii Yy yyn n Then process the data as follows: 00 0 1,1,2,3, , ii i yykyk The available equ ation is: 00 00 1,2, , ii ii Yyy yn As the same way to compute Y: 00 00 1,2, , jjj j Yyy yn Then 100 2 1 2 n ii i k yk yn ; 100 2 1 2 n jj j k yk yn ; 100 00 2 1 2 ij n ij ij k ss yk ykykyn Use ij to represent the relative correlation between i and Y Y, and get the result though the following equation. (The bigger numerical value of ij , the higher relative correlation of the two data’s behavior sequence). 1 1 ij ij ijij ss sss 3.3.4. Gray Comprehensive Correlation Degrees ij and ij respectively represents the gray absolute correlation degrees and grey relative correlation degrees of the and i y y. So ij 1 ij ij is called gray comprehensive correlation degrees. 0, 1, usually select 0.5 as the value of [11]. If you pay more attention on relation- ship between the absolute amounts, then you can take a few bigger, on the other hand, take smaller. 3.4. The Results and Analysis Through the data sorting, it can get the original data se- quence as shown in Table 2. In Table 2, ij represents the sub factors that are cor- responding to main factors. The number of people in five levels of evaluation of the questionnaire is marked by the order from low satis- faction to high. And use N to show the five levels, N = (1,2,3,4,5). 1) means very dissatisfied, 2) represents dis- satisfied, 3) is general and so on. In the process of calculation, because of the polarity reversal to the data, so the original data sequence is transformed into the maximum polarity sequence. Ac- cording to characteristics of the maximum polarity se- quence, this paper will choose the maximum value of each five evaluation levels as the reference sequence, namely the selected feature sequences that corresponding to the five evaluation value sequences is C = (1,1,1,1,1). On this basis, take the data from the maximum polarity sequence into the grey correlation analysis model, and conduct the calculation of gray absolute correlation de- grees, gray relative correlation degrees, and the grey comprehensive correlation degrees. Calculation results are respectively shown in Tables 3-8. Each table means the grey correlation degree of sub factors that are corre- sponding to main factors. According to the data in above table, it can get grey comprehensive degrees of each factor. Then, Separately multiply the degrees by their weight, namely respectively by (0.168.0.140, 0.176, 0.158, 0.176, 0.158). multiply factors under the index of job by the weights can get the corresponding results: (0.127, 0.144, 0.136, 0.149, 0.158, 0.128, 0.158); multiply factors under the index of work environment by the weights can get the corresponding results: (0.110, 0.115, 0.119, 0.104, 0.109, 0.118); multi- ply factors under the index of career development by the weights can get the corresponding results: (0.171, 0.144, 0.165); multiply factors under the index of role satisfac- Open Access JHRSS 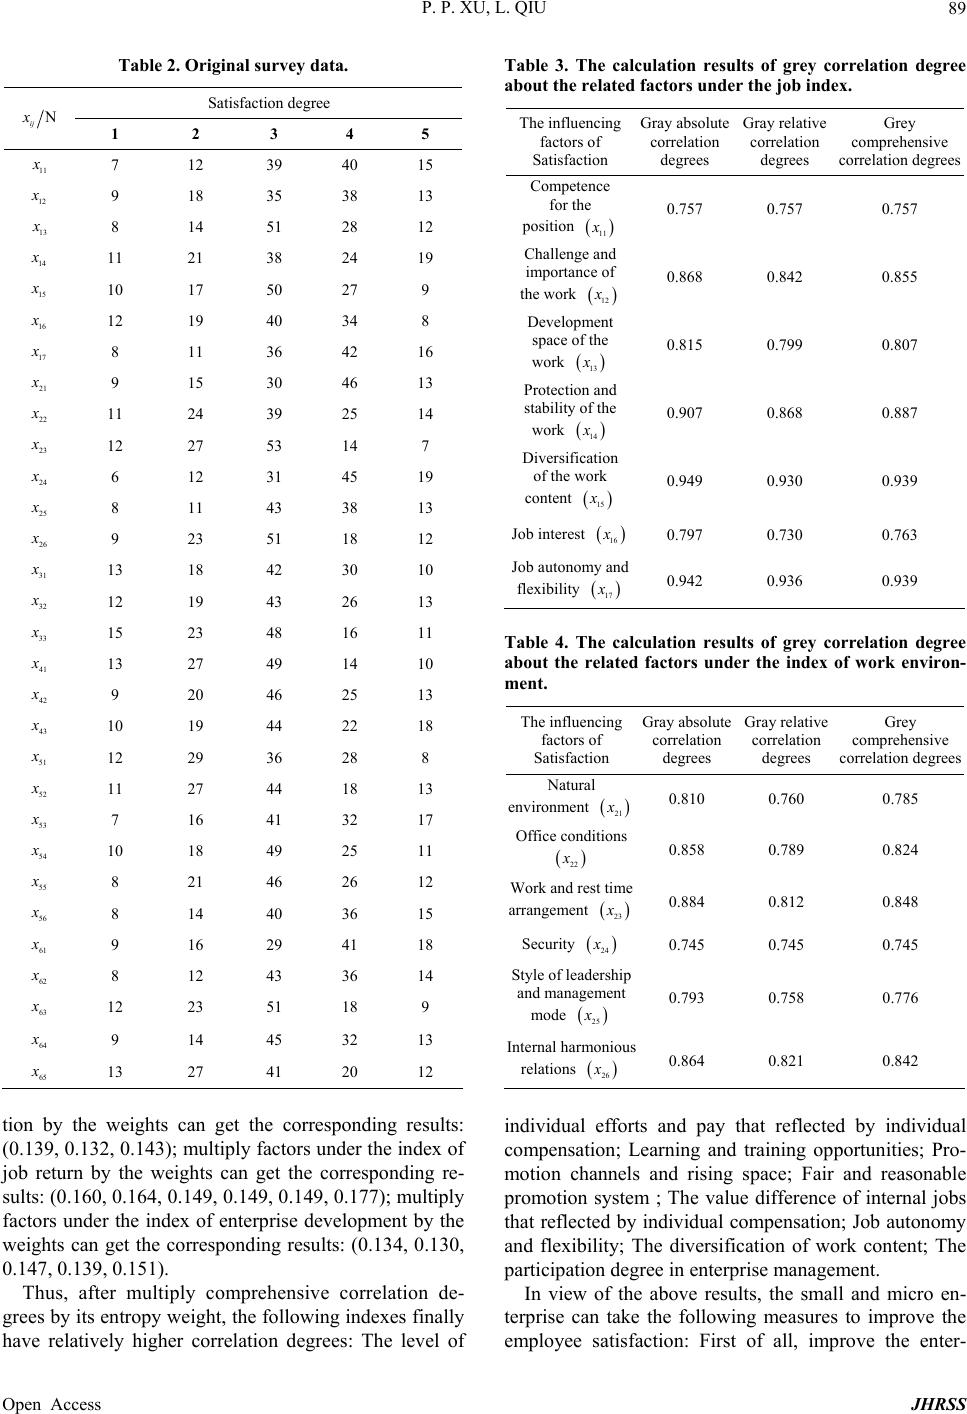 P. P. XU, L. QIU 89 Table 2. Original survey data. Satisfaction degree N ij x 1 2 3 4 5 11 7 12 39 40 15 12 9 18 35 38 13 13 8 14 51 28 12 14 11 21 38 24 19 15 10 17 50 27 9 16 12 19 40 34 8 17 8 11 36 42 16 21 9 15 30 46 13 22 11 24 39 25 14 23 12 27 53 14 7 24 6 12 31 45 19 25 8 11 43 38 13 26 9 23 51 18 12 31 13 18 42 30 10 32 12 19 43 26 13 33 15 23 48 16 11 41 13 27 49 14 10 42 9 20 46 25 13 43 10 19 44 22 18 51 12 29 36 28 8 52 11 27 44 18 13 53 7 16 41 32 17 54 10 18 49 25 11 55 8 21 46 26 12 56 8 14 40 36 15 61 9 16 29 41 18 62 8 12 43 36 14 63 12 23 51 18 9 64 9 14 45 32 13 65 13 27 41 20 12 tion by the weights can get the corresponding results: (0.139, 0.132, 0.143); multiply factors under the index of job return by the weights can get the corresponding re- sults: (0.160, 0.16 4, 0.149, 0.149 , 0.149, 0.17 7); multiply factors under the index of enterprise development by the weights can get the corresponding results: (0.134, 0.130, 0.147, 0.139, 0.151). Thus, after multiply comprehensive correlation de- grees by its entropy weight, the following indexes finally have relatively higher correlation degrees: The level of Table 3. The calculation results of grey correlation degree about the related factors under the job index. The influencing factors of Satisfaction Gray absolute correlation degrees Gray relative correlation degrees Grey comprehensive correlation degrees Competence for the position 11 0.757 0.757 0.757 Challenge and importance of the work 12 0.868 0.842 0.855 Development space of the work 13 0.815 0.799 0.807 Protection and stability of the work 14 0.907 0.868 0.887 Diversification of the work content 15 0.949 0.930 0.939 Job interest 16 0.797 0.730 0.763 Job autonomy and flexibility 17 0.942 0.936 0.939 Table 4. The calculation results of grey correlation degree about the related factors under the index of work environ- ment. The influencing factors of Satisfaction Gray absolute correlation degrees Gray relative correlation degrees Grey comprehensive correlation degrees Natural environment 21 0.810 0.760 0.785 Office conditions 22 0.858 0.789 0.824 Work and rest time arrangement 23 0.884 0.812 0.848 Security 24 0.745 0.745 0.745 Style of leadership and management mode 25 0.793 0.758 0.776 Internal harmonious relations 26 0.864 0.821 0.842 individual efforts and pay that reflected by individual compensation; Learning and training opportunities; Pro- motion channels and rising space; Fair and reasonable promotion system ; The value difference of internal jobs that reflected by individual compensation; Job autonomy and flexibility; The diversification of work content; The participation degree in enterprise managemen t. In view of the above results, the small and micro en- terprise can take the following measures to improve the mployee satisfaction: First of all, improve the enter- e Open Access JHRSS  P. P. XU, L. QIU Open Access JHRSS 90 Table 5. The calculation results of grey correlation degree about the related factors under the index of career development. The influencing factors of Satisfaction Gray absolute correlation degrees Gray relative correlation degrees Grey comprehensive correlation degrees Learning and training opportunities 31 0.973 0.970 0.971 Promotion channels and rising space 32 0.816 0.816 0.816 Career planning guidance 33 0.946 0.934 0.940 Table 6. The calculation results of grey correlation degree about the related factors under the index of role satisfaction. The influencing factors of Satisfaction Gray absolute correlation degrees Gray relative correlation degrees Grey comprehensive correlation degrees Sense of work accomplishment 41 0.885 0.871 0.878 Recognition degree that given in the work 42 0.833 0.833 0.833 Sense of belonging and pride in the enterprise 43 0.919 0.889 0.904 Table 7. The calculation results of grey correlation degree about the related factors under the index of job return. The influencing factors of Satisfaction Gray absolute correlation degrees Gray relative correlation degrees Grey comprehensive correlation degrees The value difference of internal jobs that reflected by individual compensation 51 0.862 0.803 0.832 The level of individual efforts and pay tha t reflected by individual compensation 52 0.936 0.907 0.921 The comparison level of pay levels between i ndi vidu al compensation and external labor market 53 0.778 0.778 0.778 The sufficiency level of social ins urance and welfare system 54 0.796 0.752 0.774 The sufficiency level of holiday, physical examination, etc 55 0.783 0.767 0.775 The fairness level of the promotion system 56 0.860 0.846 0.853 Table 8. The calculation results of grey correlation degree about the related factors under the index of enterprise develop- ment. The influencing factors of Satisfaction Gray absolute correlation degrees Gray relative correlation degrees Grey comprehensive correlation degrees The identity degree to t he enterprise’s development vision 61 0.815 0.802 0.808 The identity degree to t he enterprise’s business strategy 62 0.781 0.781 0.781 The identity degree to the enterprise’s management system 63 0.901 0.864 0.883 The identity degree to the en terprise culture 64 0.842 0.829 0.836 The participation degree in the e nt erprise management 65 0.929 0.894 0.911 prise’s training mechanism, which will raise the ability of employees and promote development of the enterprise at the same time [12]. Secondly, establish an effective com- pensation management system. Compensation needs to be linked to performance, so as to ensure the fairness of compensation. Thirdly, small and micro enterprise needs to do career planning for core staffs, so as to realize long- term development of them. Then, have reasonable job design, which will improve diversity and challenge of work, thus cultivate the employees’ work interest [13]. Finally, increase employee participation in management. Make employees feel like they are part of the enterprise and need to assume corresponding responsibilities, so as to increase their sense of belonging to the enterprise.  P. P. XU, L. QIU 91 4. Conclusions With continuous and rapid development of Chinese economy, support from small micro enterprise to econ- omy is more and more prominent. As the backbone of the enterprise, core employees are also gained all aspects of attention. There are many factors that may influence sat- isfaction of core employees, such as corporate culture, management mechanism, working environment and work reward and so on, which will directly affect their work- ing condition. Therefore, only correctly grasping key needs of employee can make enterprise internal man- agement effective. General statistical method needs support of a large number of data which has typical distribution. And its inspection and computation is very complex. So it is not suitable for small sample system. Then this article chooses grey correlation analysis model for dynamic analysis, which can comprehensively consider random- ness and uncertainty of sub satisfaction factors. For main factors, it selects Delphi method and entropy weight method to determine their weights. With the co mbination of two methods, a relatively objective result is obtained. It also can get rank of the most important factors. The influence degree of factors from great to small is respec- tive: the level of individual efforts and pays that re- flected by individual compensation; learning and train- ing opportunities; promotion channels and rising space; Fair and reasonable promotion system; the value differ- ence of internal jobs that reflected by individual com- pensation; job autonomy and flexibility; the diversifica- tion of work content; the participation degree in enter- prise management. With the research result, it can pro- vide a scientific and reasonable theoretical basis for en- terprise staff management, and improve job satisfaction of the core employees at the same time. REFERENCES [1] P. Jiang, “Research on the Problems of Human Resources Management in Small Enterprise,” Journal of Chinese Human Resources Development, 2012, pp. 63-66. [2] P. F. Rong, Y. H. Ge and L. G. Li, “Research about Pro- blems and Countermeasures of Human Resources Man- agement in Small and Micro Enterprise—Taking a Headhunting Company in Zhangjiagang City as an Ex- ample,” Journal of Chinese Human Resources Develop- ment, Vol. 5, No. 5, 2012, pp. 36-39. [3] L. Fang and W. Zhong, “Research about the Problems and Countermeasures of Yan’an Small Enterprise’s Hu- man Resources Management[J],” Journal of Commercial Economy, Vol. 1, No. 1, 2013, pp. 72-73+94. [4] R. Zhenli, “On the Management Mechanism of the Knowledge-Based Core Staff in Enterprises,” Science and Technology Management Researc h, Vol. 37, No. 22, 2011, pp. 152-155. [5] Y. Shi, “Research about the Factors that Influence Em- ployees’ Satisfaction in New and High Technology En- terprise,” Ph.D. Thesis, Shandong University, Shandong, 2011. [6] W. H. Tian and C. Lirong, “Employee Satisfaction Eval- uation System in Logistics Enterprise,” Journal of Busi- ness and Management, Vol. 1, No. 1, 2013, pp. 121-122. [7] Z. Li, “Study on Job Satisfaction Evaluation of Enter- prise’s Knowledge Staff,” Journal of Scientific and Eco- nomic Society, Vol. 30, No. 2, 2012, pp. 37-40+44. [8] N. Wang, Z. Fang and J. C. Jie, “Application of the Im- proved Entropy Method in the Value Evaluation of Re- newable Water Resource,” Journal of Xi’an University of Technology, 2012, pp. 416-420. [9] Y. G. Wang, F. Ling, L. H. Wu and J. R. Tang, “Analysis about Satisfaction Factors of Food Safety Supervision Based on the Grey Correlation Model,” Journal of Food Industry Science and Technology, Vol. 34, No. 6, 2013, pp. 49-52. [10] S. F.Liu, Y. G. Dang and Z. G. Fang, “Grey System The- ory and Its Application,” 5th Edition, Science Press, Bei- jing, 2010. [11] K. R. Zhou and Y. Lin, “Employee Satisfaction Assess- ment Based on the Grey Correlation Analysis in the Railway Transport Enterprise,” Journal of Logistics Tech- nology, No. 12, 2008, pp. 89-92. [12] J. M. Wei, “Survey and Countermeasures about Em- ployee Satisfaction in the Private Enterprises,” Journal of economic, No. 7, 2011, pp. 60-61. [13] P. Spagnoli, A. Caetano and S. C. Santos, “Satisfaction with Job Aspects: Do Patterns Change Over Time?” Journal of Business Research, Vol. 65, No. 5, 2012, pp. 609-616. http://dx.doi.org/10.1016/j.jbusres.2011.02.048 Open Access JHRSS 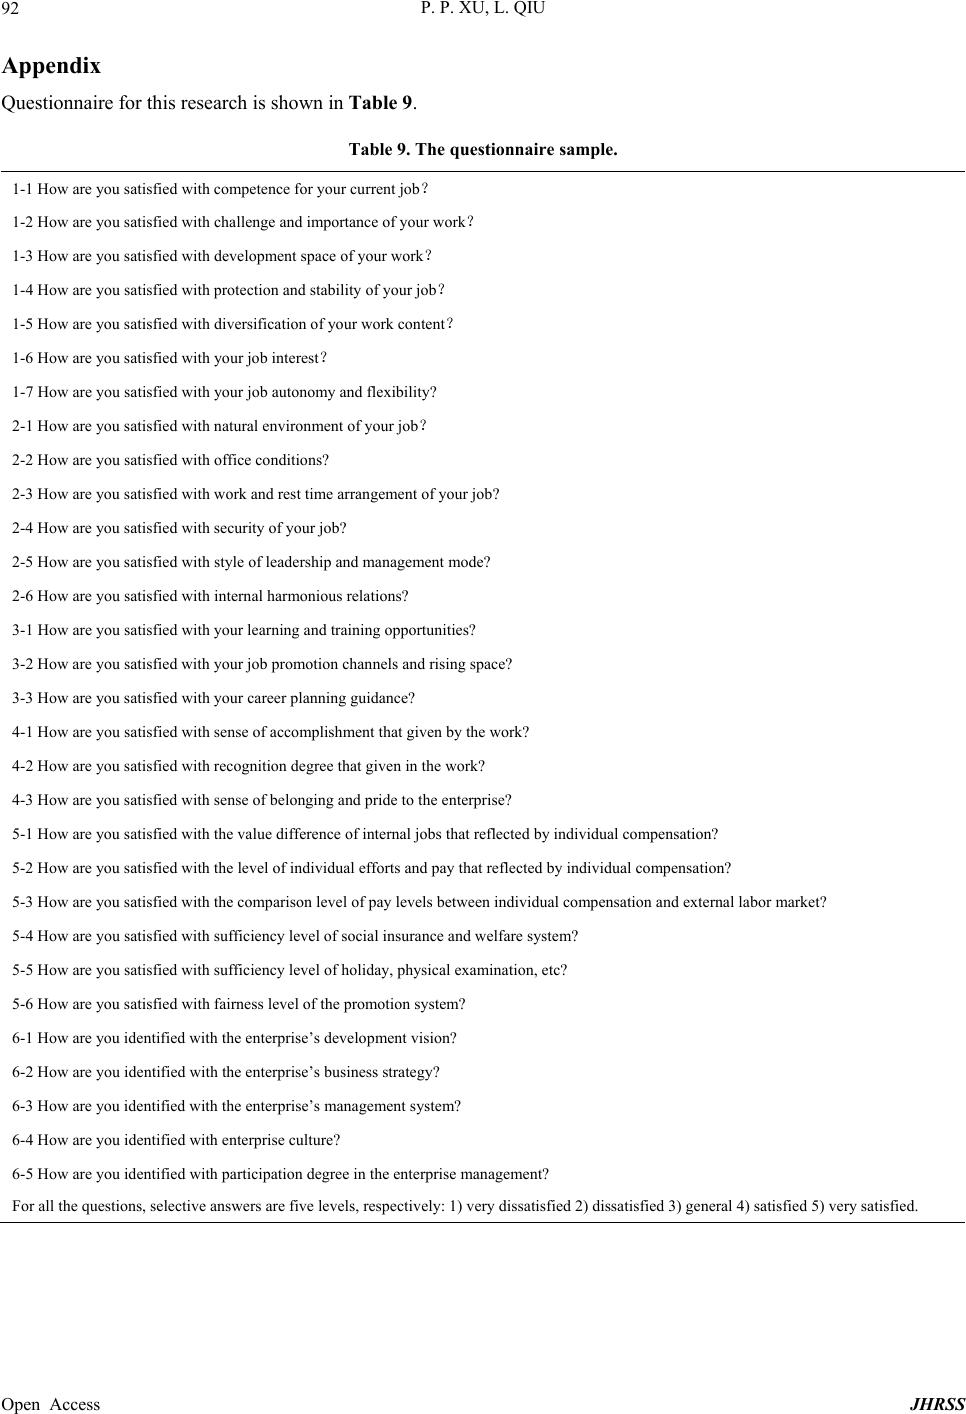 P. P. XU, L. QIU 92 Appendix Questionnaire for this research is shown in Table 9. Table 9. The questionnaire sample. 1-1 How are you satisfied with competence for your current job? 1-2 How are you satisf ie d w i t h c h a l l e n ge a n d importance of your work? 1-3 How are you satis f i e d w i th development space of your work? 1-4 How are you satisfied with protection and stabil i ty of your jo b? 1-5 How are you satis f i e d w i th diversification of your work content? 1-6 How are you satisf ie d w i t h your job interest? 1-7 How are you satisfied with your job autonomy an d fl exib ility? 2-1 How are you satisfied with natural environment o f your job? 2-2 How are you satisfied w i t h o ff i ce conditions? 2-3 How are you satisfied with work and rest time arrangement of your job? 2-4 How are you satisfied with security of your job? 2-5 How are you satisf ie d w i t h s t yle of leadership and management mode? 2-6 How are you satisfied wi t h i n t ernal harmonious relations? 3-1 How are you satisfied with your learning and training opportunities? 3-2 How are you satisfied with your job prom oti on cha nnels and ris ing sp ace? 3-3 How are you satisfied with your career planning guidance? 4-1 How are you satisfied with sense of accom plishment that given by the work? 4-2 How are you satisfied with recognition degree that given in the work? 4-3 How are you satisfied with sense of belonging and pr ide to the enterprise? 5-1 How are you satisfied with the value difference of internal jobs tha t reflected by individual compensation? 5-2 How are you satisfied with the level of individual efforts and pay that reflected by individual compensation? 5-3 How are you satisfied with the comparison level of pay levels between individual compensation and external labor market? 5-4 How are you satisfied with sufficiency level of social insurance and welfare system? 5-5 How are you satisfied with sufficiency level of holiday, physic al examination, etc? 5-6 How are you satisfied with fairness level of the pr o motion system? 6-1 How are you identified with the enterprise’s development vision? 6-2 How are you identified with the enterprise’s business strategy? 6-3 How are you identified with the enterprise’s management system? 6-4 How are you identifie d with enterprise culture? 6-5 How are you ident if ie d with participation degree in the enterprise management ? For all the questions, se lective answers are five levels, respectively: 1) very dissatisfied 2) dissatisfied 3) genera l 4 ) satisfied 5) very satisfied. Open Access JHRSS
|