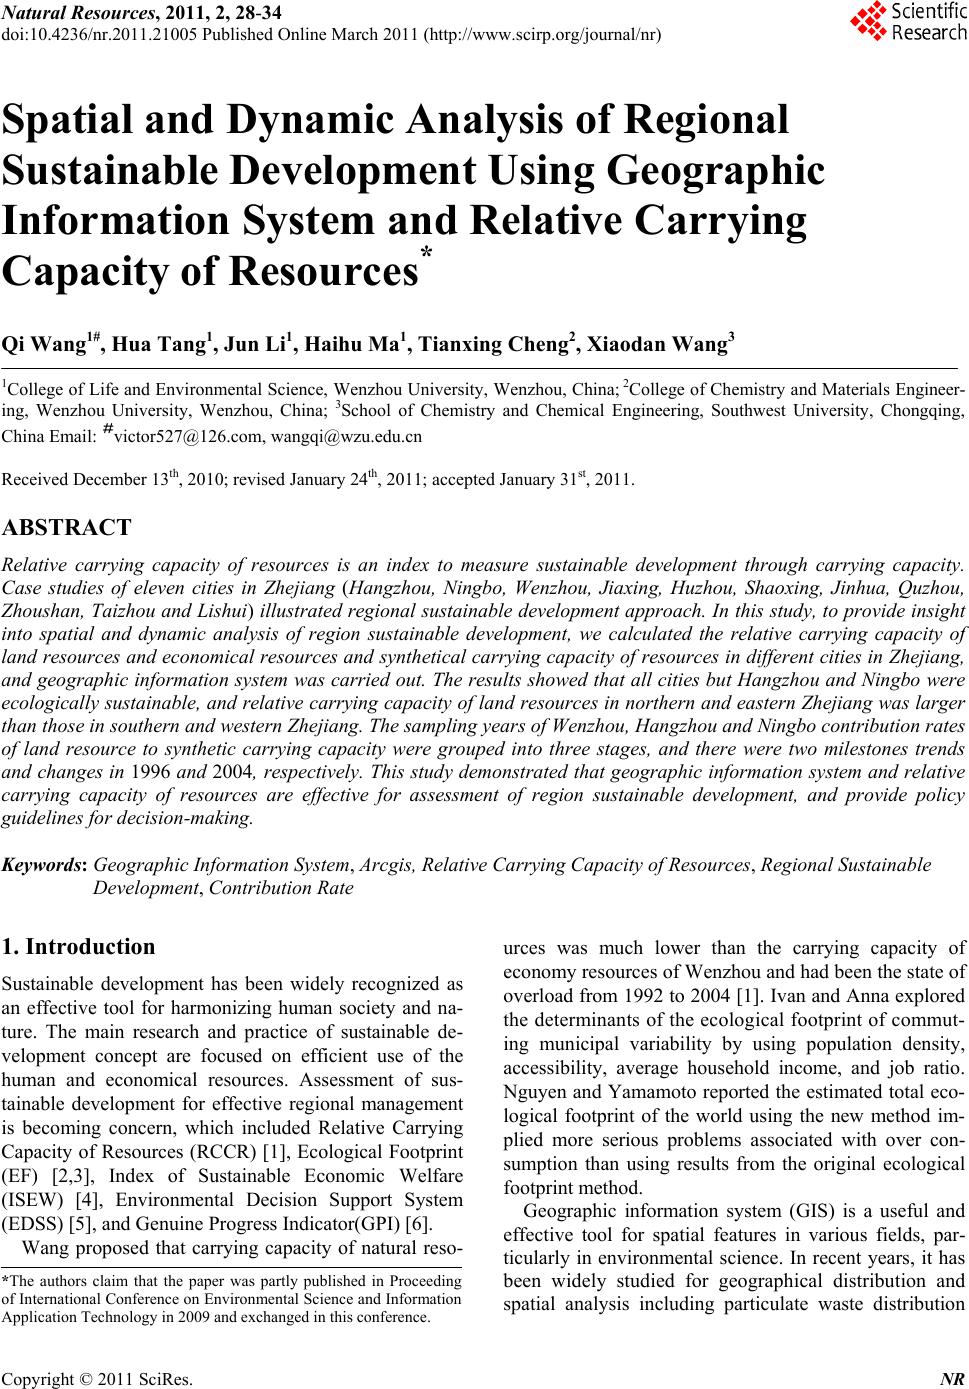
 Natural Resources, 2011, 2, 28-34 doi:10.4236/nr.2011.21005 Published Online March 2011 (http://www.scirp.org/journal/nr) Copyright © 2011 SciRes. NR Spatial and Dynamic Analysis of Regional Sustainable Development Using Geographic Information System and Relative Carrying Capacity of Resources* Qi Wang1#, Hua Tang1, Jun Li1, Haihu Ma1, Tianxing Cheng 2, Xiaodan Wang3 1College of Life and Environmental Science, Wenzhou University, Wenzhou, China; 2College of Chemistry and Materials Engineer- ing, Wenzhou University, Wenzhou, China; 3School of Chemistry and Chemical Engineering, Southwest University, Chongqing, China Email: #victor527@126.com, wangqi@wzu.edu.cn Received December 13th, 2010; revised January 24th, 2011; accepted January 31st, 2011. ABSTRACT Relative carrying capacity of resources is an index to measure sustainable development through carrying capacity. Case studies of eleven cities in Zhejiang (Hangzhou, Ningbo, Wenzhou, Jiaxing, Huzhou, Shaoxing, Jinhua, Quzhou, Zhoushan, Taizhou and Lishui) illustrated regional sustainable development approach. In this study, to provide insight into spatial and dynamic analysis of region sustainable development, we calculated the relative carrying capacity of land resources and economica l resources and synthetical carrying capacity of resources in differen t cities in Zhejiang, and geographic informa tion system was carried out. The results showed th at all cities but Hangzhou and Ningbo were ecologically sustaina ble, and relative carrying capa city of land resources in northern and eastern Zhejiang was larger than those in southern and western Zhejiang. The sampling years of Wenzhou, Hangzhou and Ningbo contribution rates of land resource to synthetic carrying capacity were grouped into three stages, and there were two milestones trends and changes in 1996 and 2004, respectively. This study demonstrated that geograp hic information system and relative carrying capacity of resources are effective for assessment of region sustainable development, and provide policy guidelines for decision-making. Keywords: Geographic Informati o n Syst em, Arcgis, Relative Carrying Capacity of Resources, Regional Sustainable Development, Contribut i o n R at e 1. Introduction Sustainable development has been widely recognized as an effective tool for harmonizing human society and na- ture. The main research and practice of sustainable de- velopment concept are focused on efficient use of the human and economical resources. Assessment of sus- tainable development for effective regional management is becoming concern, which included Relative Carrying Capacity of Resources (RCCR) [1], Ecological Footprint (EF) [2,3], Index of Sustainable Economic Welfare (ISEW) [4], Environmental Decision Support System (EDSS) [5], and Genuine Progress Indicator(GPI) [6]. Wang proposed that carrying capacity of natural reso- urces was much lower than the carrying capacity of economy resources of Wenzhou and had been the state of overload from 1992 to 2004 [1]. Ivan and Anna explored the determinants of the ecological footprint of commut- ing municipal variability by using population density, accessibility, average household income, and job ratio. Nguyen and Yamamoto reported the estimated total eco- logical footprint of the world using the new method im- plied more serious problems associated with over con- sumption than using results from the original ecological footprint method. Geographic information system (GIS) is a useful and effective tool for spatial features in various fields, par- ticularly in environmental science. In recent years, it has been widely studied for geographical distribution and spatial analysis including particulate waste distribution *The authors claim that the paper was partly published in Proceeding of International Conference on Environmental Science and Information Application Technology in 2009 and exchanged in this conference. 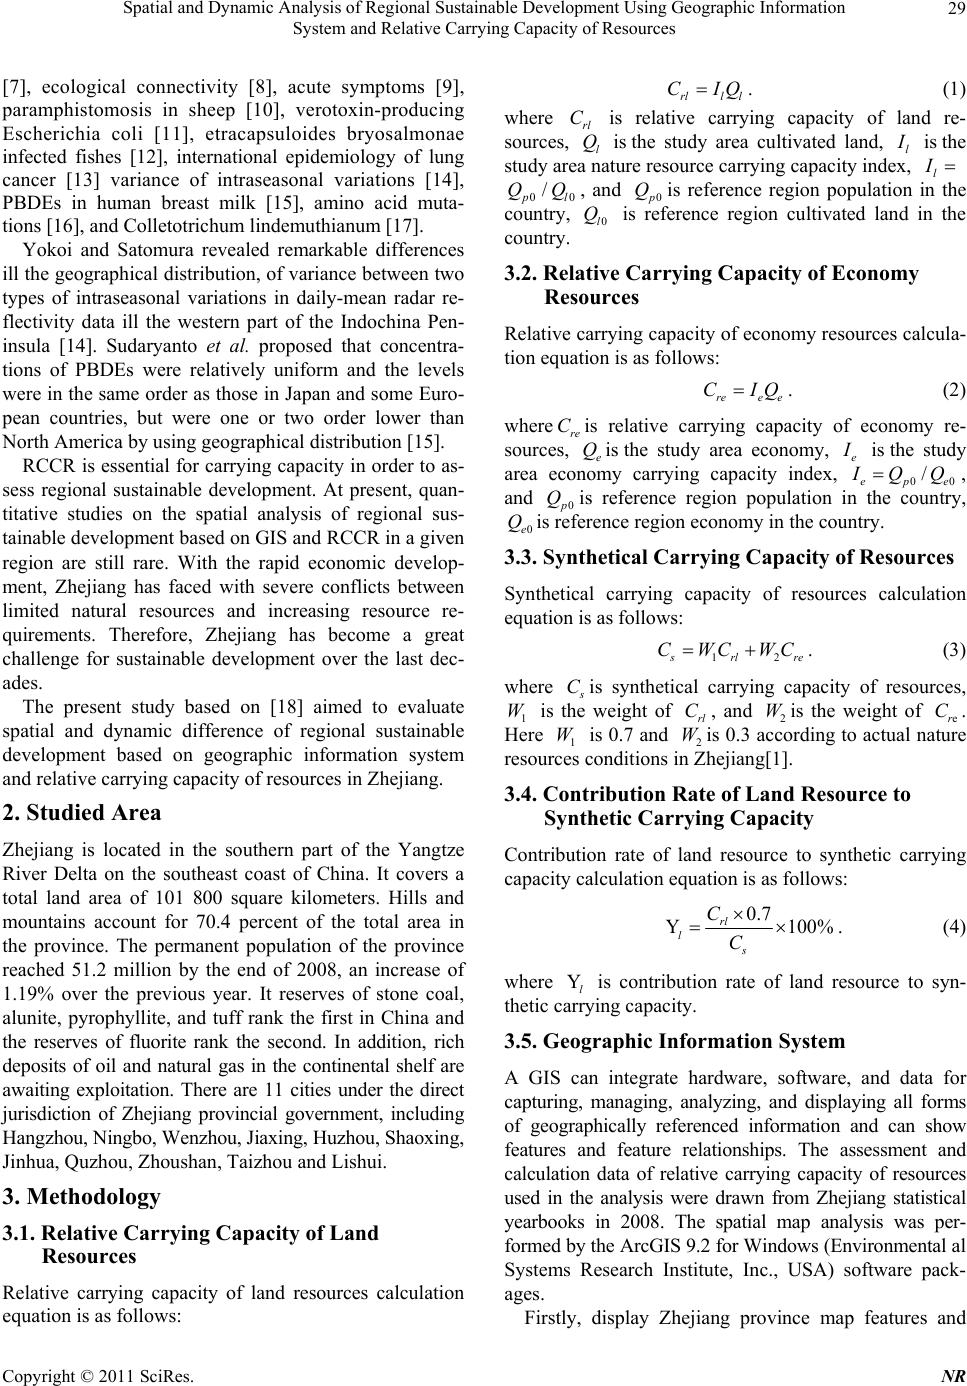 Spatial and Dynamic Analysis of Regional Sustainable Development Using Geographic Information 29 System and Relative Carrying Capacity of Resources [7], ecological connectivity [8], acute symptoms [9], paramphistomosis in sheep [10], verotoxin-producing Escherichia coli [11], etracapsuloides bryosalmonae infected fishes [12], international epidemiology of lung cancer [13] variance of intraseasonal variations [14], PBDEs in human breast milk [15], amino acid muta- tions [16], and Colletotrichum lindemuthianum [17]. Yokoi and Satomura revealed remarkable differences ill the geographical distribution, of variance between two types of intraseasonal variations in daily-mean radar re- flectivity data ill the western part of the Indochina Pen- insula [14]. Sudaryanto et al. proposed that concentra- tions of PBDEs were relatively uniform and the levels were in the same order as those in Japan and some Euro- pean countries, but were one or two order lower than North America by using geographical distribution [15]. RCCR is essential for carrying capacity in order to as- sess regional sustainable development. At present, quan- titative studies on the spatial analysis of regional sus- tainable development based on GIS and RCCR in a given region are still rare. With the rapid economic develop- ment, Zhejiang has faced with severe conflicts between limited natural resources and increasing resource re- quirements. Therefore, Zhejiang has become a great challenge for sustainable development over the last dec- ades. The present study based on [18] aimed to evaluate spatial and dynamic difference of regional sustainable development based on geographic information system and relative carrying capacity of resources in Zhejiang. 2. Studied Area Zhejiang is located in the southern part of the Yangtze River Delta on the southeast coast of China. It covers a total land area of 101 800 square kilometers. Hills and mountains account for 70.4 percent of the total area in the province. The permanent population of the province reached 51.2 million by the end of 2008, an increase of 1.19% over the previous year. It reserves of stone coal, alunite, pyrophyllite, and tuff rank the first in China and the reserves of fluorite rank the second. In addition, rich deposits of oil and natural gas in the continental shelf are awaiting exploitation. There are 11 cities under the direct jurisdiction of Zhejiang provincial government, including Hangzhou, Ningbo, Wenzhou, Jiaxing, Huzhou, Shaoxing, Jinhua, Quzhou, Zhoushan, Taizhou and Lishui. 3. Methodology 3.1. Relative Carrying Capacity of Land Resources Relative carrying capacity of land resources calculation equation is as follows: rll l CIQ . (1) where is relative carrying capacity of land re- sources, l is the study area cultivated land, l rl CQ is the study area nature resource carrying capacity index, l 00 / l QQ, and 0 Qis reference region population in the country, is reference region cultivated land in the country. 0l Q 3.2. Relative Carrying Capacity of Economy Resources Relative carrying capacity of economy resources calcula- tion equation is as follows: ree e CIQ. (2) where re Cis relative carrying capacity of economy re- sources, eis the study area economy, Qe is the study area economy carrying capacity index, 00 / epe QQ , and 0 Qis reference region population in the country, is reference region economy in the country. 0e Q 3.3. Synthetical Carrying Capacity of Resources Synthetical carrying capacity of resources calculation equation is as follows: 12 rl re CWCWC . (3) where C W is synthetical carrying capacity of resources, 1 is the weight of , and 2is the weight of er. Here 1 is 0.7 and 2 Wis 0.3 according to actual nature resources conditions in Zhejiang[1]. Wrl C WC 3.4. Contribution Rate of Land Resource to Synthetic Carrying Capacity Contribution rate of land resource to synthetic carrying capacity calculation equation is as follows: 0.7 Y 100% rl l s C C . (4) where is contribution rate of land resource to syn- thetic carrying capacity. Yl 3.5. Geographic Information System A GIS can integrate hardware, software, and data for capturing, managing, analyzing, and displaying all forms of geographically referenced information and can show features and feature relationships. The assessment and calculation data of relative carrying capacity of resources used in the analysis were drawn from Zhejiang statistical yearbooks in 2008. The spatial map analysis was per- formed by the ArcGIS 9.2 for Windows (Environmental al Systems Research Institute, Inc., USA) software pack- ages. Firstly, display Zhejiang province map features and C opyright © 2011 SciRes. NR 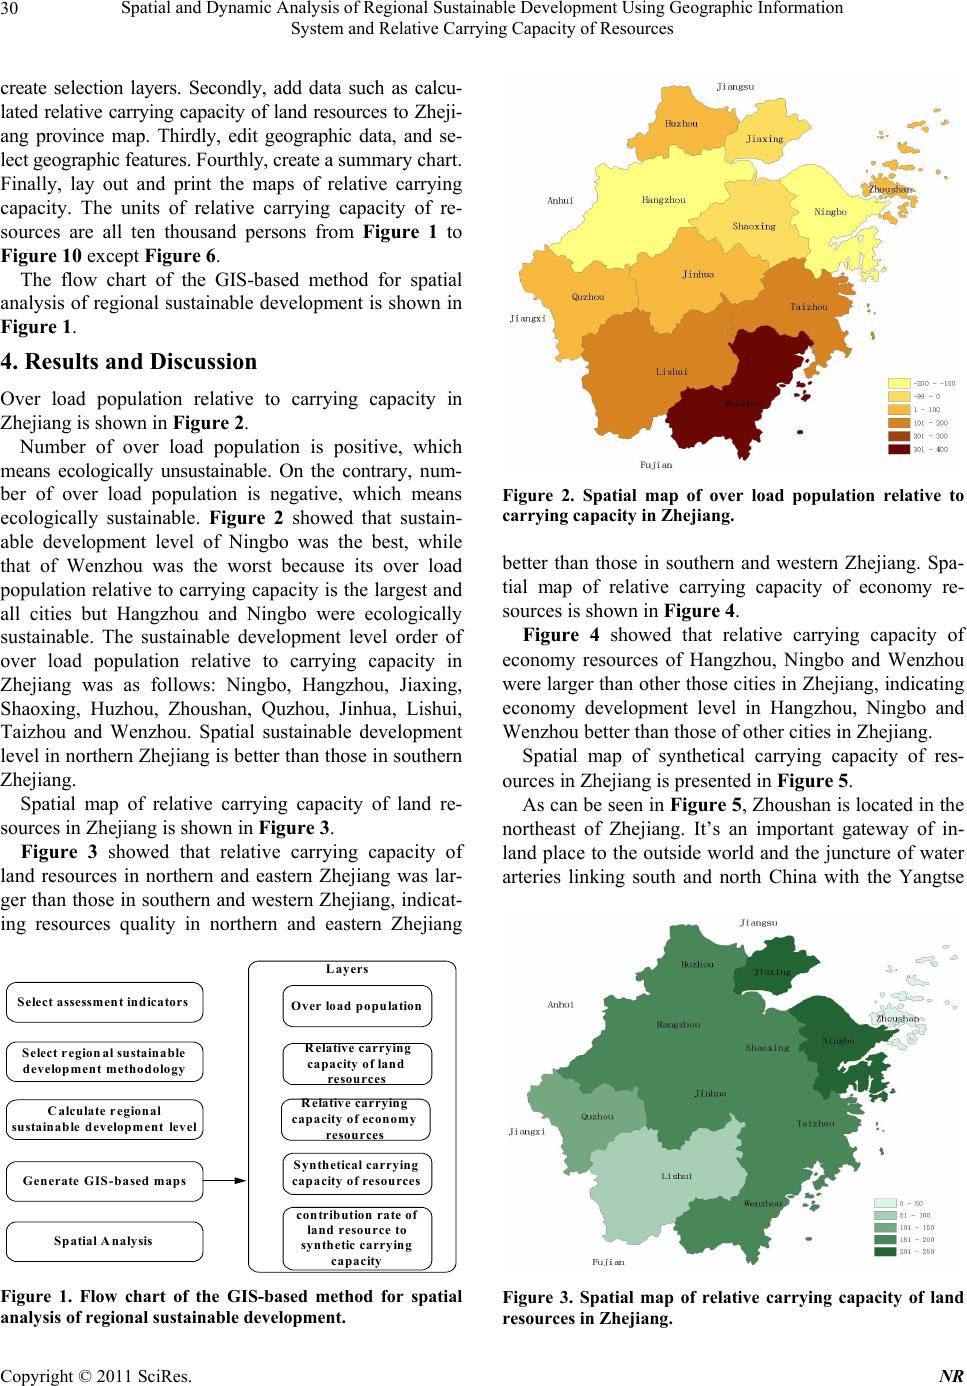 Spatial and Dynamic Analysis of Regional Sustainable Development Using Geographic Information 30 System and Relative Carrying Capacity of Resources create selection layers. Secondly, add data such as calcu- lated relative carrying capacity of land resources to Zheji- ang province map. Thirdly, edit geographic data, and se- lect geographic features. Fourthly, create a summary chart. Finally, lay out and print the maps of relative carrying capacity. The units of relative carrying capacity of re- sources are all ten thousand persons from Figure 1 to Figure 10 except Figure 6. The flow chart of the GIS-based method for spatial analysis of regional sustainable development is shown in Figure 1. 4. Results and Discussion Over load population relative to carrying capacity in Zhejiang is shown in Figure 2. Number of over load population is positive, which means ecologically unsustainable. On the contrary, num- ber of over load population is negative, which means ecologically sustainable. Figure 2 showed that sustain- able development level of Ningbo was the best, while that of Wenzhou was the worst because its over load population relative to carrying capacity is the largest and all cities but Hangzhou and Ningbo were ecologically sustainable. The sustainable development level order of over load population relative to carrying capacity in Zhejiang was as follows: Ningbo, Hangzhou, Jiaxing, Shaoxing, Huzhou, Zhoushan, Quzhou, Jinhua, Lishui, Taizhou and Wenzhou. Spatial sustainable development level in northern Zhejiang is better than those in southern Zhejiang. Spatial map of relative carrying capacity of land re- sources in Zhejiang is shown in Figure 3. Figure 3 showed that relative carrying capacity of land resources in northern and eastern Zhejiang was lar- ger than those in southern and western Zhejiang, indicat- ing resources quality in northern and eastern Zhejiang Select assessmen t indicators Select region alsustainable development m ethodology C alculate r egional sustainable development level Generate GIS-based maps Spatial Analysis Over load popu lation R elative carrying capacity of land resources Re lative c arry ing capacity of economy resources S yn th etical carry ing cap acity of resou rces contribution rate of land resource to synthetic carrying capacity Layers Figure 1. Flow chart of the GIS-based method for spatial analysis of regional sustainable development. Figure 2. Spatial map of over load population relative to carrying capacity in Zhejiang. better than those in southern and western Zhejiang. Spa- tial map of relative carrying capacity of economy re- sources is shown in Figure 4. Figure 4 showed that relative carrying capacity of economy resources of Hangzhou, Ningbo and Wenzhou were larger than other those cities in Zhejiang, indicating economy development level in Hangzhou, Ningbo and Wenzhou better than those of other cities in Zhejiang. Spatial map of synthetical carrying capacity of res- ources in Zhejiang is presented in Figure 5. As can be seen in Figure 5, Zhoushan is located in the northeast of Zhejiang. It’s an important gateway of in- land place to the outside world and the juncture of water arteries linking south and north China with the Yangtse Figure 3. Spatial map of relative carrying capacity of land resources in Zhejiang. C opyright © 2011 SciRes. NR 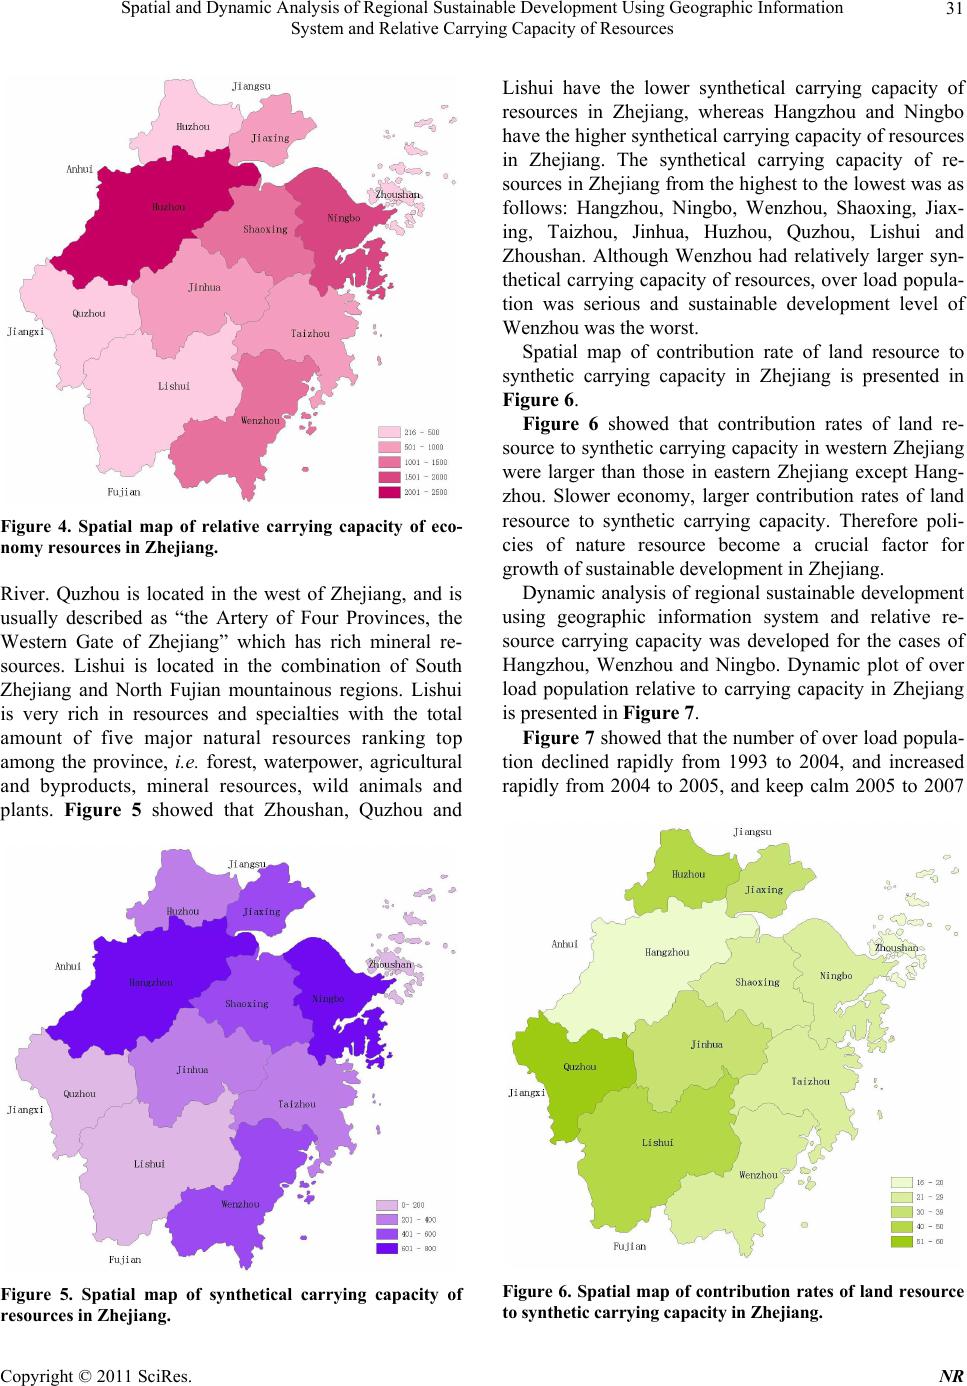 Spatial and Dynamic Analysis of Regional Sustainable Development Using Geographic Information 31 System and Relative Carrying Capacity of Resources Figure 4. Spatial map of relative carrying capacity of eco- nomy resources in Zhejiang. River. Quzhou is located in the west of Zhejiang, and is usually described as “the Artery of Four Provinces, the Western Gate of Zhejiang” which has rich mineral re- sources. Lishui is located in the combination of South Zhejiang and North Fujian mountainous regions. Lishui is very rich in resources and specialties with the total amount of five major natural resources ranking top among the province, i.e. forest, waterpower, agricultural and byproducts, mineral resources, wild animals and plants. Figure 5 showed that Zhoushan, Quzhou and Figure 5. Spatial map of synthetical carrying capacity of resources in Zhejiang. Lishui have the lower synthetical carrying capacity of resources in Zhejiang, whereas Hangzhou and Ningbo have the higher synthetical carrying capacity of resources in Zhejiang. The synthetical carrying capacity of re- sources in Zhejiang from the highest to the lowest was as follows: Hangzhou, Ningbo, Wenzhou, Shaoxing, Jiax- ing, Taizhou, Jinhua, Huzhou, Quzhou, Lishui and Zhoushan. Although Wenzhou had relatively larger syn- thetical carrying capacity of resources, over load popula- tion was serious and sustainable development level of Wenzhou was the worst. Spatial map of contribution rate of land resource to synthetic carrying capacity in Zhejiang is presented in Figure 6. Figure 6 showed that contribution rates of land re- source to synthetic carrying capacity in western Zhejiang were larger than those in eastern Zhejiang except Hang- zhou. Slower economy, larger contribution rates of land resource to synthetic carrying capacity. Therefore poli- cies of nature resource become a crucial factor for growth of sustainable development in Zhejiang. Dynamic analysis of regional sustainable development using geographic information system and relative re- source carrying capacity was developed for the cases of Hangzhou, Wenzhou and Ningbo. Dynamic plot of over load population relative to carrying capacity in Zhejiang is presented in Figure 7. Figure 7 showed that the number of over load popula- tion declined rapidly from 1993 to 2004, and increased rapidly from 2004 to 2005, and keep calm 2005 to 2007 Figure 6. Spatial map of contribution rates of land resource to synthetic carrying capacity i n Z h ejiang. C opyright © 2011 SciRes. NR 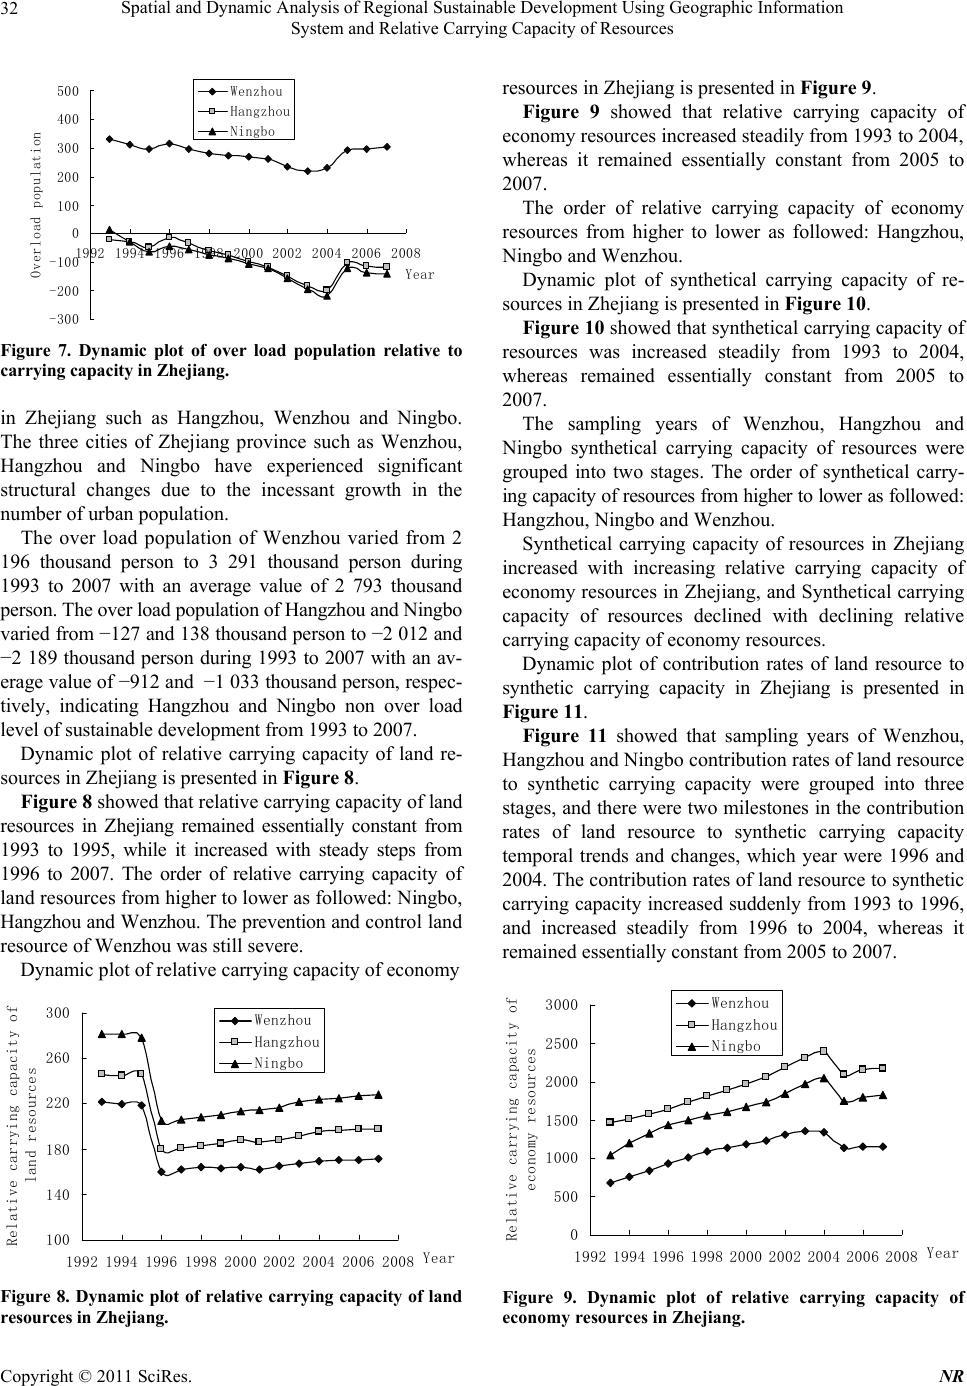 Spatial and Dynamic Analysis of Regional Sustainable Development Using Geographic Information 32 System and Relative Carrying Capacity of Resources -300 -200 -100 0 100 200 300 400 500 1992199419961998200020022004 20062008 Year Overload population Wenzhou Hangzhou Ningbo Figure 7. Dynamic plot of over load population relative to carrying capacity in Zh ejiang. in Zhejiang such as Hangzhou, Wenzhou and Ningbo. The three cities of Zhejiang province such as Wenzhou, Hangzhou and Ningbo have experienced significant structural changes due to the incessant growth in the number of urban population. The over load population of Wenzhou varied from 2 196 thousand person to 3 291 thousand person during 1993 to 2007 with an average value of 2 793 thousand person. The over load population of Hangzhou and Ningbo varied from −127 and 138 thousand person to −2 012 and −2 189 thousand person during 1993 to 2007 with an av- erage value of −912 and −1 033 thousand person, respec- tively, indicating Hangzhou and Ningbo non over load level of sustainable development from 1993 to 2007. Dynamic plot of relative carrying capacity of land re- sources in Zhejiang is presented in Figure 8. Figure 8 showed that relative carrying capacity of land resources in Zhejiang remained essentially constant from 1993 to 1995, while it increased with steady steps from 1996 to 2007. The order of relative carrying capacity of land resources from higher to lower as followed: Ningbo, Hangzhou and Wenzhou. The prevention and control land resource of Wenzhou was still severe. Dynamic plot of relative carrying capacity of economy 100 140 180 220 260 300 1992 19941996 1998 2000200220042006 2008Year Relative carrying capacity of land resources Wenzhou Hangzhou Nin bo Figure 8. Dynamic plot of relative carrying capacity of land resources in Zhejiang. resources in Zhejiang is presented in Figure 9. Figure 9 showed that relative carrying capacity of economy resources increased steadily from 1993 to 2004, whereas it remained essentially constant from 2005 to 2007. The order of relative carrying capacity of economy resources from higher to lower as followed: Hangzhou, Ningbo and Wenzhou. Dynamic plot of synthetical carrying capacity of re- sources in Zhejiang is presented in Figure 10. Figure 10 showed that synthetical carrying capacity of resources was increased steadily from 1993 to 2004, whereas remained essentially constant from 2005 to 2007. The sampling years of Wenzhou, Hangzhou and Ningbo synthetical carrying capacity of resources were grouped into two stages. The order of synthetical carry- ing capacity of resources from higher to lower as followed: Hangzhou, Ningbo and Wenzhou. Synthetical carrying capacity of resources in Zhejiang increased with increasing relative carrying capacity of economy resources in Zhejiang, and Synthetical carrying capacity of resources declined with declining relative carrying capacity of economy resources. Dynamic plot of contribution rates of land resource to synthetic carrying capacity in Zhejiang is presented in Figure 11. Figure 11 showed that sampling years of Wenzhou, Hangzhou and Ningbo contribution rates of land resource to synthetic carrying capacity were grouped into three stages, and there were two milestones in the contribution rates of land resource to synthetic carrying capacity temporal trends and changes, which year were 1996 and 2004. The contribution rates of land resource to synthetic carrying capacity increased suddenly from 1993 to 1996, and increased steadily from 1996 to 2004, whereas it remained essentially constant from 2005 to 2007. 0 500 1000 1500 2000 2500 3000 1992 1994 1996 1998 2000 2002 2004 2006 2008Year e at ve carry ng capac ty o economy resources Wenzhou Hangzhou Nin bo Figure 9. Dynamic plot of relative carrying capacity of economy resources in Zhejiang. C opyright © 2011 SciRes. NR 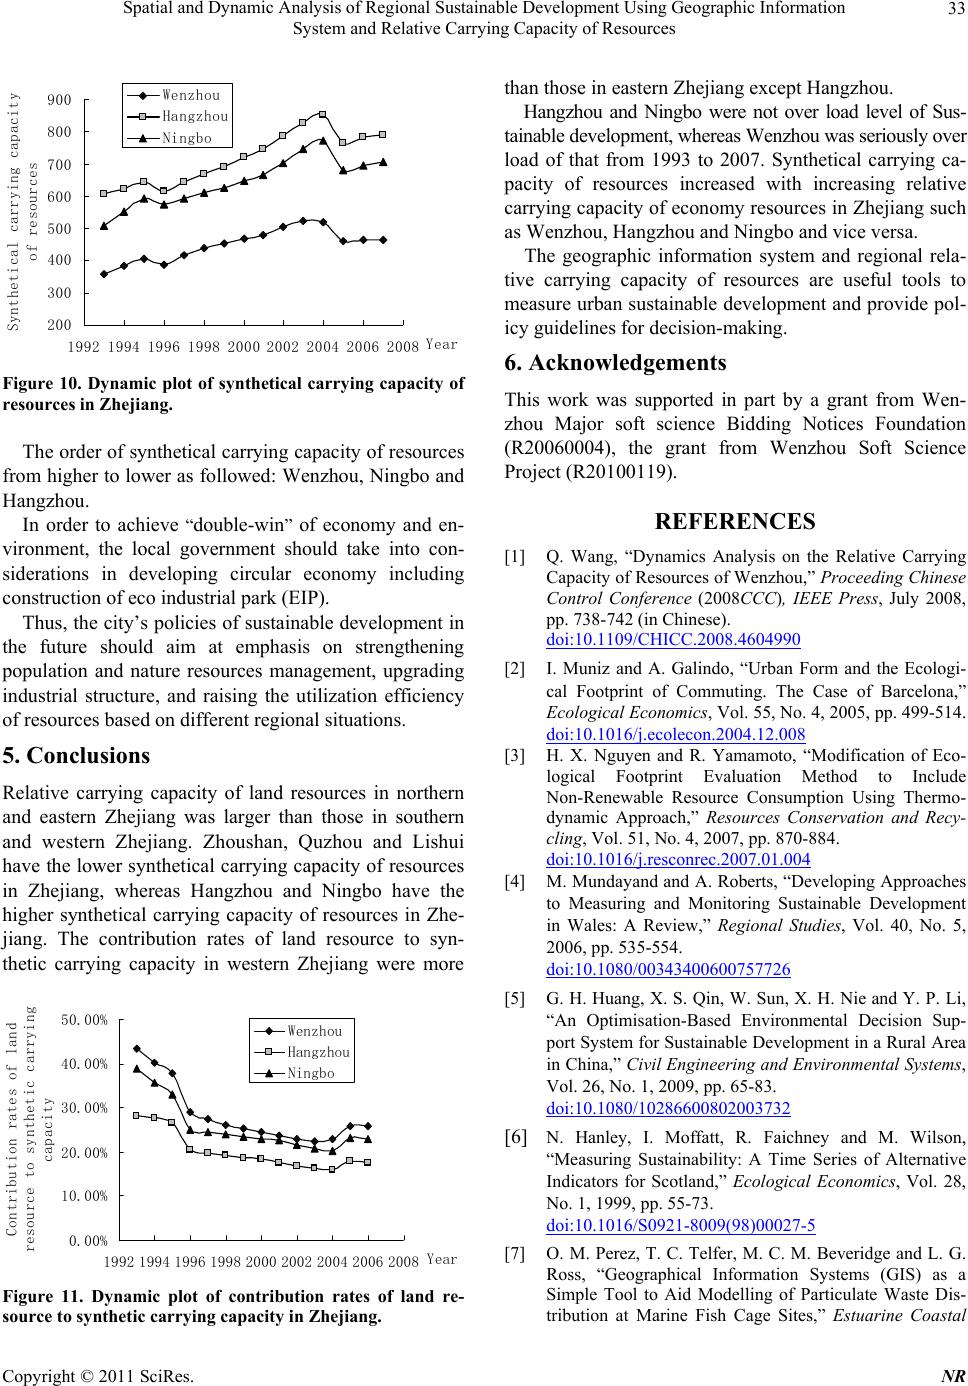 Spatial and Dynamic Analysis of Regional Sustainable Development Using Geographic Information 33 System and Relative Carrying Capacity of Resources 200 300 400 500 600 700 800 900 1992 1994 1996 1998 20002002 2004 2006 2008Year Synthetical carrying capacity of resources Wenzhou Hangzhou Nin bo Figure 10. Dynamic plot of synthetical carrying capacity of resources in Zhejiang. The order of synthetical carrying capacity of resources from higher to lower as followed: Wenzhou, Ningbo and Hangzhou. In order to achieve “double-win” of economy and en- vironment, the local government should take into con- siderations in developing circular economy including construction of eco industrial park (EIP). Thus, the city’s policies of sustainable development in the future should aim at emphasis on strengthening population and nature resources management, upgrading industrial structure, and raising the utilization efficiency of resources based on different regional situations. 5. Conclusions Relative carrying capacity of land resources in northern and eastern Zhejiang was larger than those in southern and western Zhejiang. Zhoushan, Quzhou and Lishui have the lower synthetical carrying capacity of resources in Zhejiang, whereas Hangzhou and Ningbo have the higher synthetical carrying capacity of resources in Zhe- jiang. The contribution rates of land resource to syn- thetic carrying capacity in western Zhejiang were more 0.00% 10.00% 20.00% 30.00% 40.00% 50.00% 1992 19941996 19982000 20022004 20062008Year ontr ut on rates o an resource to synthetic carrying capacity Wenzhou Hangzhou Nin bo Figure 11. Dynamic plot of contribution rates of land re- source to synthetic carrying capacity in Zhejiang. than those in eastern Zhejiang except Hangzhou. Hangzhou and Ningbo were not over load level of Sus- tainable development, whereas Wenzhou was seriously over load of that from 1993 to 2007. Synthetical carrying ca- pacity of resources increased with increasing relative carrying capacity of economy resources in Zhejiang such as Wenzhou, Hangzhou and Ningbo and vice versa. The geographic information system and regional rela- tive carrying capacity of resources are useful tools to measure urban sustainable development and provide pol- icy guidelines for decision-making. 6. Acknowledgements This work was supported in part by a grant from Wen- zhou Major soft science Bidding Notices Foundation (R20060004), the grant from Wenzhou Soft Science Project (R20100119). REFERENCES [1] Q. Wang, “Dynamics Analysis on the Relative Carrying Capacity of Resources of Wenzhou,” Proceeding Chinese Control Conference (2008CCC), IEEE Press, July 2008, pp. 738-742 (in Chinese). doi:10.1109/CHICC.2008.4604990 [2] I. Muniz and A. Galindo, “Urban Form and the Ecologi- cal Footprint of Commuting. The Case of Barcelona,” Ecological Economics, Vol. 55, No. 4, 2005, pp. 499-514. doi:10.1016/j.ecolecon.2004.12.008 [3] H. X. Nguyen and R. Yamamoto, “Modification of Eco- logical Footprint Evaluation Method to Include Non-Renewable Resource Consumption Using Thermo- dynamic Approach,” Resources Conservation and Recy- cling, Vol. 51, No. 4, 2007, pp. 870-884. doi:10.1016/j.resconrec.2007.01.004 [4] M. Mundayand and A. Roberts, “Developing Approaches to Measuring and Monitoring Sustainable Development in Wales: A Review,” Regional Studies, Vol. 40, No. 5, 2006, pp. 535-554. doi:10.1080/00343400600757726 [5] G. H. Huang, X. S. Qin, W. Sun, X. H. Nie and Y. P. Li, “An Optimisation-Based Environmental Decision Sup- port System for Sustainable Development in a Rural Area in China,” Civil Engineering and Environmental Systems, Vol. 26, No. 1, 2009, pp. 65-83. doi:10.1080/10286600802003732 [6] N. Hanley, I. Moffatt, R. Faichney and M. Wilson, “Measuring Sustainability: A Time Series of Alternative Indicators for Scotland,” Ecological Economics, Vol. 28, No. 1, 1999, pp. 55-73. doi:10.1016/S0921-8009(98)00027-5 [7] O. M. Perez, T. C. Telfer, M. C. M. Beveridge and L. G. Ross, “Geographical Information Systems (GIS) as a Simple Tool to Aid Modelling of Particulate Waste Dis- tribution at Marine Fish Cage Sites,” Estuarine Coastal C opyright © 2011 SciRes. NR  Spatial and Dynamic Analysis of Regional Sustainable Development Using Geographic Information System and Relative Carrying Capacity of Resources Copyright © 2011 SciRes. NR 34 and Shelf Science, Vol. 54, No. 4, 2002, pp. 761-768. doi:10.1006/ecss.2001.0870 [8] J. Marulli and J. M. Mallarach, “A GIS Methodology for Assessing Ecological Connectivity: Application to the Barcelona Metropolitan Area,” Landscape and Urban Planning, Vol. 71, No. 2-4, 2005, pp. 243-262. doi:10.1016/S0169-2046(04)00079-9 [9] K. Radon, A. Rosenberger, V. Ehrenstein, M. Hoopmann, I. Basting, H. Todt, J. Reichert, H. Dressel, M. Schmid, R. Suchenwirth and D. Nowak, “Geographical Distribution of Acute Symptoms after a Train Collision Involving Epichlorohydrin Exposure,” Environmental Research, Vol. 102, No. 1, 2006, pp. 46-51. doi:10.1016/j.envres.2006.01.010 [10] G. Cringoli, R. Taddei, L. Rinaldi, V. Veneziano, V. Musella, C. Cascone, G. Sibilio and J. B. Malone, “Use of Remote Sensing and Geographical Information Systems to Identify Environmental Features that Influence the Distribution of Paramphistomosis in Sheep from the Southern Italian Apennines,” Veterinary Parasitology, Vol. 122, No. 1, 2004, pp. 15-26. doi:10.1016/j.vetpar.2004.03.011 [11] T. Kistemann, S. Zimmer, I. Vagsholm and Y. Andersson, “GIS-Supported Investigation of Human EHEC and Cat- tle VTEC O157 Infections in Sweden: Geographical Dis- tribution, Spatial Variation and Possible Risk Factors,” Epidemiology and Infection, Vol. 132, No. 3, 2004, pp. 495-505. doi:10.1017/S0950268803001729 [12] T. Wahli, D. Bernet, H. Segner and H. Schmidt-Postha- us, “Role of Altitude and Water Temperature as Regulat- ing Factors for the Geographical Distribution of Tetra- capsuloides Bryosalmonae Infected Fishes in Switzer- land,” Journal of Fish Biology, Vol. 73, No. 9, 2008, pp. 2184-2197. doi:10.1111/j.1095-8649.2008.02054.x [13] D. R. Youlden, S. M. Cramb and P. D. Baade, “The In- ternational Epidemiology of Lung Cancer-Geographical Distribution and Secular Trends,” Journal of Thoracic Oncology, Vol. 3, No. 8, 2008, pp. 819-831. doi:10.1097/JTO.0b013e31818020eb [14] S. Yokoi and T. Satomura, “Geographical Distribution of Variance of Intraseasonal Variations in Western Indo- china as Revealed from Radar Reflectivity Data,” Journal of Climate, Vol. 21, No. 19, 2008, pp. 5154-5161. doi:10.1175/2008JCLI2153.1 [15] A. Sudaryanto, N. Kajiwara, S. Takahashi, Muawanah and S. Tanabe, “Geographical Distribution and Accumu- lation Features of Pbdes in Human Breast Milk from In- donesia,” Environmental Pollution, Vol. 151, No. 1, 2008, pp. 130-138. doi:10.1016/j.envpol.2007.02.016 [16] K. Rungsihirunrat, C. H. Sibley, M. Mungthin and K. Na-Bangchang, “Geographical Distribution of Amino Acid Mutations in Plasmodium Vivax DHFR and DHPS from Malaria Endemic Areas of Thailand,” American Journal of Tropical Medicine and Hygiene, Vol. 78, No. 3, 2008, pp. 462-467. [17] G. A. Bardas, O. Koutita and K. Tzavella-Klonari, “Geo- Graphical Distribution, Pathotype Characterization, and Molecular Diversity of Colletotrichum Lindemuthianum in Greece and Resistance of Greek Bean Cultivars,” Plant Disease, Vol. 91, No. 11, 2007, pp. 1379-1385. doi:10.1094/PDIS-91-11-1379 [18] Q. Wang, H. H. Ma, Q. Ke, C. H. Wang and X. D. Wang, “Spatial Analysis of Regional Sustainable Development Based on Geographic Information System and Relative Carrying Capacity of Resources,” Environmental Science and Information Application Technology. International Conference on ESIAT 2009, Vol. 1, 2009, pp.437-440.
|