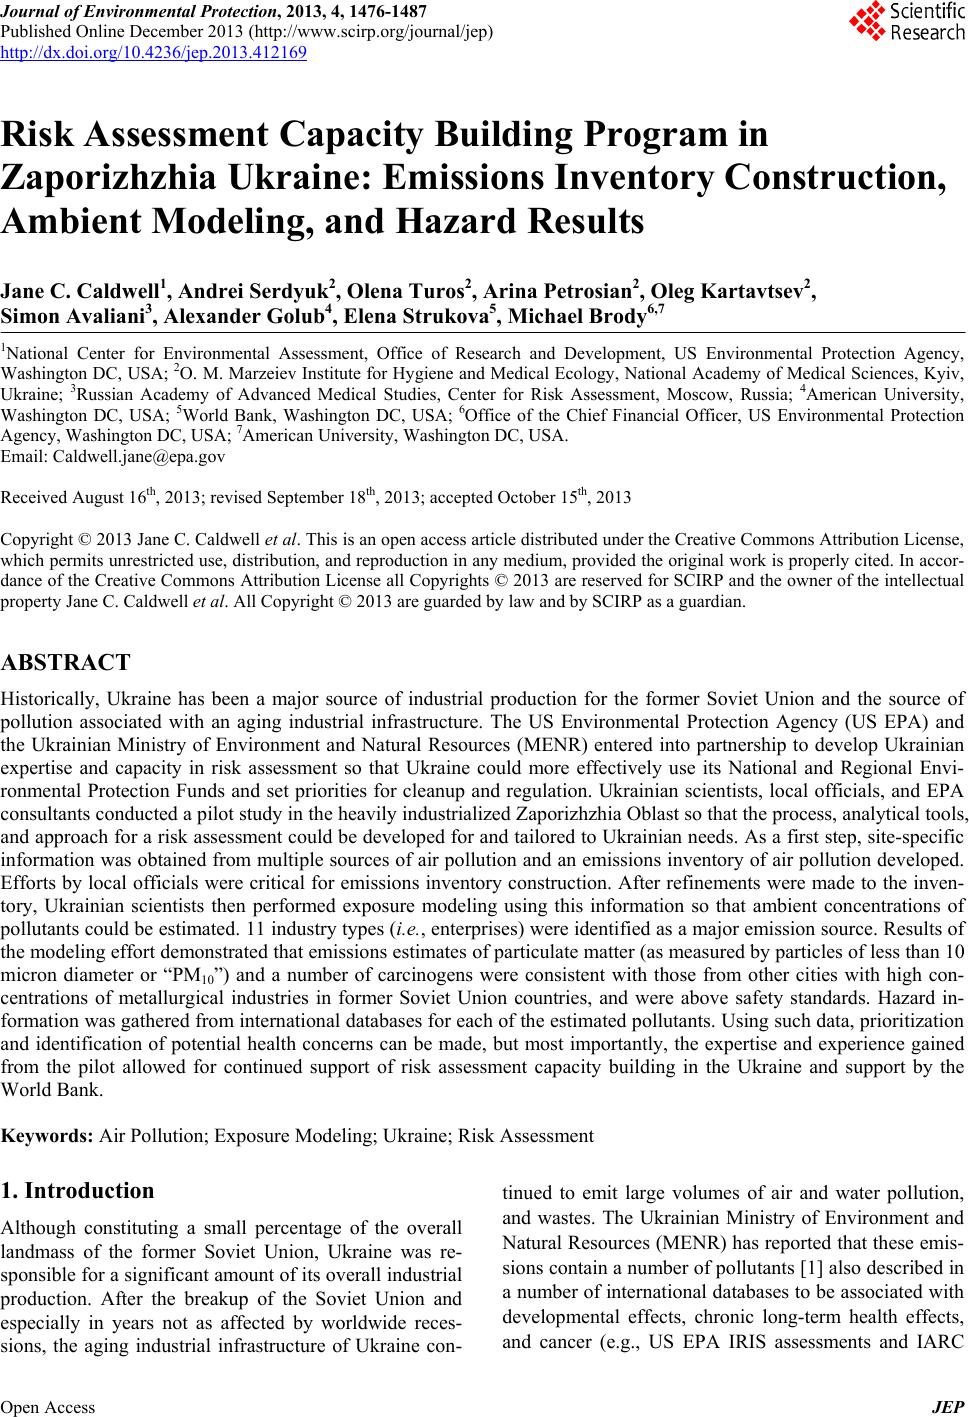
 Journal of Environmental Protection, 2013, 4, 1476-1487 Published Online December 2013 (http://www.scirp.org/journal/jep) http://dx.doi.org/10.4236/jep.2013.412169 Open Access JEP Risk Assessment Capacity Building Program in Zaporizhzhia Ukraine: Emissions Inventory Construction, Ambient Modeling, and Hazard Results Jane C. Caldwell1, Andrei Serdyuk2, Olena Turos2, Arina Petrosian2, Oleg Kartavtsev2, Simon Avaliani3, Alexander Golub4, Elena Strukova5, Michael Brody6,7 1National Center for Environmental Assessment, Office of Research and Development, US Environmental Protection Agency, Washington DC, USA; 2O. M. Marzeiev Institute for Hygiene and Medical Ecology, National Academy of Medical Sciences, Kyiv, Ukraine; 3Russian Academy of Advanced Medical Studies, Center for Risk Assessment, Moscow, Russia; 4American University, Washington DC, USA; 5World Bank, Washington DC, USA; 6Office of the Chief Financial Officer, US Environmental Protection Agency, Washington DC, USA; 7American University, Washington DC, USA. Email: Caldwell.jane@epa.gov Received August 16th, 2013; revised September 18th, 2013; accepted October 15th, 2013 Copyright © 2013 Jane C. Caldwell et al. This is an open access article distributed under the Creative Commons Attribution License, which permits unrestricted use, distribution, and reproduction in any medium, provided the original work is properly cited. In accor- dance of the Creative Commons Attribution License all Copyrights © 2013 are reserved for SCIRP and the owner of the intellectual property Jane C. Caldwell et al. All Copyright © 2013 are guarded by law and by SCIRP as a guardian. ABSTRACT Historically, Ukraine has been a major source of industrial production for the former Soviet Union and the source of pollution associated with an aging industrial infrastructure. The US Environmental Protection Agency (US EPA) and the Ukrainian Ministry of Environment and Natural Resources (MENR) entered into partnership to develop Ukrainian expertise and capacity in risk assessment so that Ukraine could more effectively use its National and Regional Envi- ronmental Protection Funds and set priorities for cleanup and regulation. Ukrainian scientists, local officials, and EPA consultants conducted a pilot study in the heavily industrialized Zaporizhzhia Oblast so that the process, analytical tools, and approach for a risk assessment could be developed for and tailored to Ukrainian needs. As a first step, site-specific information was obtained from multiple sources of air pollution and an emissions inventory of air pollution developed. Efforts by local officials were critical for emissions inventory construction. After refinements were made to the inven- tory, Ukrainian scientists then performed exposure modeling using this information so that ambient concentrations of pollutants could be estimated. 11 industry types (i.e., enterprises) were identified as a major emission source. Results of the modeling effort demonstrated that emissions estimates of particulate matter (as measured by particles of less than 10 micron diameter or “PM10”) and a number of carcinogens were consistent with those from other cities with high con- centrations of metallurgical industries in former Soviet Union countries, and were above safety standards. Hazard in- formation was gathered from international databases for each of the estimated pollutants. Using such data, prioritization and identification of potential health concerns can be made, but most importantly, the expertise and experience gained from the pilot allowed for continued support of risk assessment capacity building in the Ukraine and support by the World Bank. Keywords: Air Pollution; Exposure Modeling; Ukraine; Risk Assessment 1. Introduction Although constituting a small percentage of the overall landmass of the former Soviet Union, Ukraine was re- sponsible for a significant amount of its overall industrial production. After the breakup of the Soviet Union and especially in years not as affected by worldwide reces- sions, the aging industrial infrastructure of Ukraine con- tinued to emit large volumes of air and water pollution, and wastes. The Ukrainian Ministry of Environment and Natural Resources (MENR) has reported that these emis- sions contain a number of pollutants [1] also described in a number of international databases to be associated with developmental effects, chronic long-term health effects, and cancer (e.g., US EPA IRIS assessments and IARC  Risk Assessment Capacity Building Program in Zaporizhzhia Ukraine: Emissions Inventory Construction, Ambient Modeling, and Hazard Results Open Access JEP 1477 Monographs on carcinogenic risks to humans). Ukraine also has been identified as a major source of transbound- ary air pollution for the eastern Mediterranean region and a significant source of greenhouse gases emissions [2]. After independence, Ukraine had set up a limited fund to begin to address its environmental problems. However, the system of pollution management in Ukraine was based on the Soviet System in which pollution limits were set to very low levels and generally not complied with [3]. Despite setting standards for numerous individual compounds, no system to prioritize the control of pollu- tion and its sources were in place; nor had expertise been developed to perform those evaluations. The choices of which sources and pollutants to address and control were also made difficult by the magnitude of pollution, num- ber of the pollutants emitted, and number of significant pollution sources. By contrast, the US EPA has been tasked through a number of laws (e.g., 1990 Clean Air Act Amendments) to use risk assessment to rank the relative risk of different industrial emission and sources, and to aid in the development of decision criteria for ef- ficient and effective regulatory actions. The US system and methodologies have been modified and adopted by Russia for similar applications. The US EPA has pro- vided training to develop risk assessment capabilities in Russia for a number of years [3]. To help address some of the problems cited above and strengthen Ukraine’s capacity to set environmental pri- orities, the US EPA set up a partnership with Ukraine’s Ministry of Environment and Natural Resources (MENR) to develop expertise in environmental risk assessment and economic analyses. This Capacity Building Project (CBP) was funded through an US EPA Cooperative Agreement (CX4-831993) with the Environmental De- fense Fund (EDF); support also came from US EPA’s Offices of Research and Development, International Af- fairs, and the Chief Financial Officer. The CBP was ini- tiated in 2002 and has been described previously [3]. In order to introduce the US system and provide risk as- sessment, management, and environmental finance in- formation, the project began with a series of workshops and consultations. Ukrainian representatives at the na- tional and oblast level scientists from Ukrainian research institutes, EPA consultants, representatives of the World Bank (Washington DC and Kyiv), specialists from US non-governmental organizations (NGOs) (i.e., Counter- part International and the Environmental Defense Fund), and environmental finance specialists from the State of Pennsylvania water infrastructure management agency were involved. So that a template for data development and analyses could be implemented at the local level and then be adapted on a broader scale, a model case study was de- veloped with the assistance of municipal officials of the Zaporizhzhia Oblast. An Oblast is most analogous to a county in the US Resting on both sides of the Dnipro River with relatively flat topography, Zaporizhzhia is comprised of five administrative municipal zones on the left bank and two others on the right. The Dnipropet- rovsk water reserve is situated on the north from the city, the Kakhovske water reserve on the south. Data from the Statistics Administration in Zaporizhzhia Oblast (2007) indicate a population of ~800,000 for the year 2001 in a city area of 330 km2 [4]. The choice was ideal as model of significant Ukrainian air pollution sources as the Oblast is the country’s largest producer of high quality steel, nonferrous metals, ferrous-alloys, power transfor- mers, various equipment, and automobiles. This paper describes some of the key results of the Ukrainian pilot project included in the “Final Report on the project “Environmental Capacity Building in the NIS” US EPA grant registration # X4-83199301 (US Environmental Protection Agency (EPA), Environmental Defense Fund (EDF), Marzeev Institute of Hygiene and Medical Ecology AMSU (IHME), Center of Environ- mental Health and Risk Assessment (CEHRA) [4]. EPA collaborators had access to the final report, which formed the basis of this paper, but not the original data. Specifi- cally, this paper focuses on the development of the emis- sions inventory and dispersion modeling for derivation of ambient concentrations of pollutants at various popula- tion receptor points at the Zaporizhzhia oblast level. More recent hazard data from international sources is also presented for modeled pollutants. 2. Methods 2.1. Exposure Data Collection Because of Ukraine’s system of legally binding monitor- ing systems and related information used for permitting and fees, local emissions data from stationary sources were generally available for Zaporizhzhia. An emission inventory was assembled that is analogous to those of EPA (i.e., the Toxic Release Inventory and the National Air Toxics Assessment) [5]. The inventory information included: 1) volumes of air emissions from standard State form “2-TP” (“AIR”); 2) emission permits for at- mospheric air pollutants; 3) stationary source location information on industrial sites; and 4) source and emis- sion characteristics through Ukrainian inventory reports (i.e., “Instructions on the Content and Order of the Re- port on the Pollutant Inventories on the Enterprise”, ap- proved by the Decree of the Ministry of Environment Protection and Nuclear safety from 10.02.95 No. 7 regis- tered in the Ministry of Legal Affairs of Ukraine  Risk Assessment Capacity Building Program in Zaporizhzhia Ukraine: Emissions Inventory Construction, Ambient Modeling, and Hazard Results Open Access JEP 1478 (15.03.95 # 61/597). The “2-TP” (“AIR”) form was in- troduced in the Soviet Union in the 1980s with reporting required by law in Ukraine. Inventory information for particulate matter (PM) was given in the form of total suspended particles (TSP). The list of 30 major industrial Zaporizhzhia enterprises in the 2007 emissions inventory were those used to model emissions. Some of the specific enterprises have since been renamed or are no longer functioning. Unlike the EPA emission inventories, Ukra- inian plant emissions data are not public so that further examination or update of emissions in the inventory can- not occur. The 2007 inventory includes a number of in- dustries that include not only steel-associated facilities but also silicon, asphalt, car repair, transformer, and a number of public corporations. The top source types that contributed 63% of emissions are shown in Table 1. 2.2. Dispersion Modeling Pollutant dispersion is dependent on terrain characteris- tics, land use type, and meteorological data. Dispersion modeling methods officially certified in Ukraine are adopted from the official risk assessment methods of Russia (Human Health Risk Assessment from Environ- mental Pollutants) [6] that were, in turn, modeled on EPA approaches [3]. Although the official Ukrainian air pollutant dispersion model is the EOL model (i.e., an interface based on the OND-86 methods, see Onischenko et al. as an example [7]), the ISC-AERMOD program (a more modern model) was used for the Zaporizhzhia pro- ject instead [8]. That model (ISC short term stack model) uses the steady-state Gaussian plume equation for a con- tinuous elevated source. For each source and each hour, the origin of the source’s coordinate system is placed at Table 1. List of the major source types of industrial Za- porizhzhia enterprises in the emissions inventory. No Types of industry Contribution of emissions, % 1 Coke industry 2 2 Steel-rolling industry 1 3 Silicon industry 1 4 Steel production 41 5 Alluminium industry 6 6 Abrasive industry 3 7 Transformer industry 1 8 Graphite industry 2 9 Titano-magnesium industry 1 10 Ferro-alloy industry 4 11 Glass factory 1 the ground surface at the base of the stack. Model pa- rameters included: digital elevation models (i.e., relief of the territory), meteorology, land-use data (i. e. , residential building density, surrounding “greenness”, industrial areas, presence of surface waters), stationary source parameters, and emission-specific data. The input data for model preprocessing included me- teorological data (i.e., 1 hour interval measurements) and specific territorial factors that characterize vertical mix- ing in ground atmospheric layers. Meteorological data for the entire year of 2005 were provided by the Za- porizhzhia Hydro-Meteorological Service (HydroMet). Dominant wind directions were to the southwest and west. Southwestern wind with speed starting from 3 - 4 m/s dominated during the greatest number of hours (14.9 %) with almost equal number of hours dominating West- ern and Southeastern directions. Zaporizhzhia belongs to the zone with continental type of climate with hot sum- mer and moderate cold winter. The coldest month of the year is January (i.e., average monthly temperature −4.3˚C, absolute minimum −34˚C) and the warmest month is July (i.e., average monthly temperature +22.3˚C with absolute maximum +41˚C). The yearly precipitation rate is 469 mm and average snow cover is 14 cm with a maximum of 35cm. Land use was not accurately recorded in the stationary source inventory. Therefore, land-use data were provided by remote sensing images of high resolution (i.e., Quick Bird Standard Imagery PAN+MSI, 05/04/ 2005, product for Zaporizhzhia territory, “Grandproject” Co. Zaporizhzhia) and processed by ArcGIS software to pinpoint 5000 emission points using US Geological Sur- vey methods [4]. Based on information in air pollution modeling soft- ware and “2-TP” (“AIR”) form, 76 pollutants were iden- tified in the inventory. As a first step, initial ground level calculations of annual concentrations for 34 pollutants were estimated for 6 population-based receptor points. However, more refined modeling was conducted for the emissions of 51 priority pollutants (that included the ini- tial 34) at the 6 population-based receptor points after: 1) conducting a more detailed emission analyses of 12 ma- jor Zaporizhzhia sources; 2) prioritization by potential risk using volume and hazard information; and 3) taking into account difference between “2-TP” and permitted emissions through consideration of operating mode, emis- sion source specification, and physicochemical condi- tions (wet and dry concretion of the substances). Addi- tional calculations were done for total suspended parti- cles (TSP), using a specialized model of calculation TSP in the ISC-Aermod program. The accurate locations of 5000 stationary sources of emissions from the 30 enter- prises in the Zaporizhzhia industrial sites were identified for the 52 priority pollutants (i.e., 51 priority pollutants  Risk Assessment Capacity Building Program in Zaporizhzhia Ukraine: Emissions Inventory Construction, Ambient Modeling, and Hazard Results Open Access JEP 1479 plus TSP) with a spatial accuracy of several meters. Input information for each of these emission points within the enterprises were used in the modeling calculations. Emis- sion point source parameters, wind speed profile adjust- ments, and pollutant removal by physical or chemical processes methods were given in the report [4] and are not shown here. The gender and age structure of the population in Zaporizhzhia, the number of residents in each neighbor- hood, and density of residents was collected from the Zaporizhzhia Regional Statistical Administration. Popu- lation data were geocoded and linked to the residential living places in the “ArcGIS environment”. Population- based receptor points were linked to population density so that all of the population in each receptor point was similar with respect to the impact of ambient air pollution impacts. Dispersion model outputs were hourly concen- trations produced at each receptor by combined source emissions: they were summed to obtain total 1-hour, 24- hour, month, and annual concentrations. The land use classifications and population receptor points are shown in Figure 1 and the wind speeds are demonstrated by a wind rose in Figure 2. 2.3. Hazard Characterization Of the 52 priority pollutants modeled for ambient air concentration estimates, a number of pollutants were identified as at least possible human carcinogens. The weight of evidence for human carcinogenicity was de- termined by either the US EPA [9] or the International Agency for Research on Cancer (IARC) [10]. Others have been regulated primarily on noncancer effects (e.g., particulate matter and other “criteria” pollutants that are subject to National Ambient Air Quality Standards by US EPA). Table 2 shows the hazard information and the initial emission inventory information derived from the “EOL” air pollution software and the “2-TP AIR” data for the 52 priority pollutants identified by CAS number. In some cases the specific identities of the pollutants in the inventory is not clear and more than one CAS num- ber is given. 3. Results The 52 priority pollutants cited in the refined Zapori- zhzhia emissions inventory are presented in Table 2. Those pollutants identified by either US EPA or IARC as at least possible carcinogens and the estimates of their ambient concentrations at the 6 receptor points are shown in Table 3. A number of the priority pollutants also be- long to chemical groups with potential toxicity variations between members within those groupings. The specific- ity of the inventory information for such pollutants is dependent on information provided in the 2-TP (AIR) (a) (b) (c) (d) Figure 1. Zaporizhzhia Population Receptor Points (a); Composite for Receptor Modeling (b); Housing Zone (c); and Industrial Zone (d). The map of Zaporizhzhia shows 6 receptor points in areas of significant population for esti- mation of exposure to priority air pollution emissions with 1010, 3292, 6197, and 17,744 people/km2 grids from no color to dark brown (a). The composite overview of land use along the Dnipro River basin and Zaporizhzhia includes: Grey as an industrial zone, Brown as low-rise housing zone, Orange as high-rise housing zone, Blue as the Dnipro River, and Green as flora. For the housing zone (c); light brown indicates high-rise housing and darker brown low-rise housing. The industrial zone is indicated as grey (d). Each part of the figure is drawn to the same scale. forms. As shown for chromium, valence state has a sig- nificant impact on toxicity. The lack of specificity in the inventory makes assignment of appropriate hazard in- formation for these modeled emissions difficult. One of the pollutants whose ambient concentrations were estimated in the Zaporizhzhia case study was TSP/PM10 (see Table 4). American regulatory standards apply to PM10 and to PM2.5 (a more respirable and poten- tially toxic particle size) [11,12]. Over the last 15 years those standards have been modified with an increasing emphasis on the health effects of PM2.5. In 1997 the US EPA National Ambient Air Quality Standards for PM2.5 were 65 μg/m3 (24-hour) and 15 μg/m3 (Annual) and for PM10 were 150 μg/m3 (24 hour) and 50 μg/m3 (Annual) [13]. In the 2006 the 24-hour PM2.5 standard was lowered to 35 μg/m3 and the annual PM10 standard dropped. In December 2012 the annual PM2.5 standard was lowered to 12 μg/m3 [13]. The three primary sources of PM10 were aluminum production, abrasive materials industry and steel production; they were also major sources of other pollutants. Emission inventory-based estimates of  Risk Assessment Capacity Building Program in Zaporizhzhia Ukraine: Emissions Inventory Construction, Ambient Modeling, and Hazard Results Open Access JEP 1480 Figure 2. Annual wind rose in year 2005 for Zaporizhzhia. The annual wind rose for Zaporizhia is shown for the year 2005. The dominant wind directions were Southwestern and Western. annual ambient TSP concentrations were subsequently converted to estimates of PM10 and corresponding popu- lation estimates are shown in Table 4 for the 6 receptor points. These annual estimates exceed the older annual and more recent 24-hour US EPA national standards for particulate matter. After TSP inventories were modeled, the results were extrapolated to estimates of PM10 and PM2.5 for com- parative purposes to US health standards and other am- bient estimates. Avaliani and Revich [14] proposed a 0.55 conversion coefficient to convert TSP into PM10 for Russia. This value is slightly below the 0.6 conversion coefficient suggested in Larson et al. [15] for Russia and Strukova et al. [16] proposed for Ukraine. Because many former Soviet regions have more combustion-related activities than average, a higher conversion coefficient was used than that for the world average 0.5 [17]. The conversion ratio used in the final report [4] was 0.55. Further conversions of PM10 estimates to PM2.5 include greater uncertainty in relation to the original data in the emissions inventory (i.e., TSP). In Russia, the PM2.5/ PM10 ratio has been estimated to range from 0.55 to 0.75 [15,17]. For this article we have chosen a conversion ratio of 0.65 (i.e., a ratio in the middle of that range) for estimates of PM10 to PM2.5 with the resulting modeled estimates for TSP and all conversions to smaller particle sizes shown in Table 4. 4. Discussion Often, former Soviet countries (including Ukraine) have used a retrospective rather than prospective approach for assessment of health effects from pollution. Epidemiol- ogical methods have been used to try to identify risk after  Risk Assessment Capacity Building Program in Zaporizhzhia Ukraine: Emissions Inventory Construction, Ambient Modeling, and Hazard Results Open Access JEP 1481 Table 2. List of priority pollutants from Zaporizhzhia emissions inventory used for more refined dispersion modeling. CAS# Pollutant IARC WOE for Cancer** ЕРА WOE for Cancer** Emissions Inventory*** (Tons/year) 106-99-0 1,3-Butadiene Carcinogenic to humans Carcinogenic to humans 0.039 10102-44-0 Nitrogen dioxide Not assessed Not assessed 8937.296 10102-43-9 Nitrous oxide Not assessed Not assessed 3.276 107-13-1 Acrylonitrile Possibly carcinogenic to humansProbable human carcinogen (UR) 0.422 107-02-8 Acrolein Not classifiable as to human carcinogenicity Cannot be determined 7.882 1344-28-1 Aluminium oxide Not assessed Not assessed 3359.415 7664-41-7 Ammonia Not assessed Cannot be determined 134.209 75-07-0 Acetaldehyde Possibly carcinogenic to humansProbable human carcinogen (UR) 0.173 67-64-1 Acetone Not assessed Cannot be determined 35.51 50-32-8 Benzo[a]pyrene Carcinogenic to humans Probable human carcinogen (UR) 0.422 100-44-7 Benzyl chloride Not assessed Probable human carcinogen **** 8006-61-9 Automotive gasoline Not assessed Not assessed **** 71-43-2 Benzene Carcinogenic to humans Human carcinogen 52.058 123-86-4 Butyl acetate Not assessed Not assessed 151.458 7440-62-2 Vanadium as dust and fumes Vanadium dust and fumes—Not assessed Vanadium pentoxide (CAS 1314-61-1)-Possibly carcinogenic to humans Vanadium dust and fumes—Not assessed Vanadium pentoxide (CAS 1314-61-1)—Not assessed 3.885 75-01-4 Vinyl chloride Carcinogenic to humans Human carcinogen 0.796 7647-01-0 Hydrogen chloride Not classifiable as to human carcinogenicity Cannot be determined 131.408 630-08-0 Carbon monoxide Not assessed Not assessed 103662.5 106-89-8 Epichlorohydrin Possibly carcinogenic to humansProbable human carcinogen **** 141-78-6 Ethyl acetate Not assessed Cannot be determined 16.675 100-41-4 Ethylbenzene Possibly carcinogenic to humansCannot be determined (UR) 3.622 1332-37-2 Iron oxide Not assessed Not assessed 7720-78-7 Ferous sulfate Not assessed Not assessed 1897.246 Ferum and its compounds 7440-43-9 13477-23-1 Cadmium metal Cadmium sulfite Carcinogenic to humans Not assessed Probable human carcinogen (UR) Not assessed 0.19 Cadmium and its compounds 1330-20-7 Xylene Not classifiable as to human carcinogenicity Cannot be determined 15.944 7439-96-5 Manganese and its compounds Not assessed Cannot be determined 477.276 74-82-8 Methane (gas) Not assessed Not assessed 736.649 78-93-3 Methyl ethyl ketone Not assessed Cannot be determined 61.548 7440-50-8 7758-98-7 Copper metal Copper sulfate Not assessed Not assessed Cannot be determined (UR) Not assessed 13814-81-8 Copper (1+) disulfide dihydrate Not assessed Not assessed 1317-39-1 Cuprous oxide Not assessed Not assessed 3.405 Copper and its compounds  Risk Assessment Capacity Building Program in Zaporizhzhia Ukraine: Emissions Inventory Construction, Ambient Modeling, and Hazard Results Open Access JEP 1482 Continued 91-20-3 Naphthalene Possibly carcinogenic to humansPossible human carcinogen (UR) 16.859 7440-02-0 Nickel refinery dust Possibly carcinogenic to humans Human carcinogen Nickel Carbonyl (CAS 13463-39-3)— Probable human carcinogen 9.814 Nickel and its compounds TSP (PM10) Not assessed Not assessed 17009.138 (Substances featured as suspended solid particles) 10045-94-0 Mercury nitrate hydrate Not assessed Not assessed Mercuric chloride (CAS 7487-94-7) —Possible human carcinogen 7439-97-6 Mercury (elemental) and inorganic mercury Not classifiable as to human carcinogenicity Cannot be determined 0.029 Mercury and its compounds 8007-45-2 Soot* (coke oven emissions) IARC lists as coal tars (distillation) Carcinogenic to humans Human carcinogen 207.579 7439-92-1 Lead and its compounds Possibly carcinogenic to humansProbable human carcinogen 8.91 7446-095 Sulfur dioxide Not classifiable as to human carcinogenicity Not assessed 10647.656 7783-064 Hydrogen sulfide Not assessed Cannot be determined 72.964 75-15-0 Carbon disulfide Not assessed Cannot be determined **** 100-42-5 Styrene Possibly carcinogenic to humansAssessment not available (UR) 4.564 7664-93-9 Sulphuric acid Listed by IARC as strong inorganic acid mists containing sulfuric acid Carcinogenic to humans Not assessed 49.747 108-88-3 Toluene Not classifiable as to human carcinogenicity Cannot be determined 27.755 8030-30-6 Petroleum ether or naphtha Not assessed Not assessed **** 108-95-2 Phenol Not classifiable as to human carcinogenicity Cannot be determined 13.379 50-00-0 Formaldehyde Carcinogenic to humans Probable human carcinogen (UR) 1.971 7664-39-3 Hydrogen Fluoride Not assessed Not assessed 5.529 7782-50-5 Chlorine and its compounds Not assessed Not assessed 193.873 16065-83-1 18540-29-9 Chromium compounds Chromium (III) (CAS 16065-83-1) —Not classifiable as to human carcinogenicity Chromium (VI) (CAS 18540-29-9) —Carcinogenic to humans Chromium (III) (CAS 16065-83-1—Cannot be determined Chromium (VI) (CAS 18540-29-9)— Human carcinogen 55.056 108-93-0 108-94-1 Cyclohexanol Cyclohexanone Not assessed Not classifiable as to human carcinogenicity Not assessed 1.059 CAS# in inventory is for cyclohexanol but listed as cyclohexanone 1314-13-2 7440-66-6 Zinc oxide Zinc and its compounds Not assessed Not assessed Not assessed 14.988 Zinc and its compounds *Soot is identified in the emissions inventory with the EPA equivalent of coke oven emissions. **For IARC and EPA chemicals that are “not assessed” have not been examined for carcinogenicity in the IARC or IRIS databases. For EPA and IARC “Cannot be determined” and “Not classifiable as to human carcinogenic- ity” mean that the chemicals have been assessed but a determination has been made that the available data do not support a classification. This is not the same as the determination that the chemicals are probably not carcinogenic. For EPA UR designates under review. ***The emissions in tons/year are derived from the initial data from “EOL” (air pollution modeling software) data and the available report “2-TP” (“AIR”). ****Added after additional consideration, not present on initial reporting forms. exposure has occurred [4]. However, such approaches have little ability to ascertain the environmental sources of pollution that may affect health. For an endpoint such as cancer, the 15 - 20 year lag time from exposure to manifestation of disease makes epidemiological ap- proaches for prevention of this health effect using current  Risk Assessment Capacity Building Program in Zaporizhzhia Ukraine: Emissions Inventory Construction, Ambient Modeling, and Hazard Results Open Access JEP 1483 Table 3. Annual estimated concentrations for priority pollutants with a WOE of at least possibly carcinogenic to humans at 6 receptor points in Zaporizhzhia. Estimated Average Annual Concentration at 6 Population Receptors (Concentration in μg/m3) CAS Pollutants 1 2 3 4 5 6 Mean 106-99-0 1,3-Butadiene 0.002 0.016 0.043 0.091 0.178 0.402 0.122 75-07-0 Acetaldehyde 0.0001 0.0026 0.0091 0.023 0.0459 0.0789 0.0266 107-13-1 Acrylonitrile 1.5E−5 0.025 0.06 0.125 0.235 0.425 0.1452 50-32-8 Benzo[a]pyrene 7E−07 0.0015 0.0029 0.0052 0.0089 0.0197 0.0064 71-43-2 Benzene 0.634 2.311 5.875 13.003 25.582 54.094 16.917 8006-61-9 Automobile gasoline (Benzine) 0.115 0.706 1.711 3.426 6.973 15.19 4.6868 100-44-7 Benzyl chloride 0.0064 0.0492 0.1584 0.3579 0.6096 1.2176 0.3998 141-78-6 Epichlorohydrin 0.0011 0.0087 0.0239 0.0529 0.0979 0.195 0.0633 1332-37-2 Ethylbenzene 2.989 20.261 53.08 113.54 210.26 443.45 140.6 50-00-0 Formaldehyde 0.137 1.052 2.982 7.045 12.632 26.042 8.315 7439-92-1 Lead and its compounds 0.0009 0.0065 0.02 0.044 0.0789 0.145 0.0497 630-08-0 Nickel and its compounds* 0.02 0.07 0.192 0.471 0.895 1.949 0.5828 1330-2-7 Cadmium Sulfite 1.6E−8 1.1E−5 2.3E−5 4.5E−8 8.2E−5 0.0002 5.8E−5 See Table 1 Chromium and its compounds 0.028 0.18 0.55 1.18 2.17 4.51 1.4363 See Table 1 Soot* 5.962 15.067 26.244 45.311 76.871 173.52 57.146 100-42-5 Styrene* 0.029 0.093 0.181 0.338 0.573 1.279 0.4255 75-01-4 Vinyl Chloride 0.002 0.0167 0.052 0.121 0.214 0.419 0.1375 *Two tables appear in the original report with slight difference in estimates for one receptor point. Values from the table used to identify cancer risk were shown as the default value. exposures problematic. One of the strengths of the ap- proach used in the Zaporizhzhia case-study is that it al- lows for identification of risk and the opportunity to change risk before detection of disease through retro- spective epidemiological approaches. Ambient monitor- ing also cannot identify specific sources for control but the approach used in the EPA Cumulative Exposure Pro- ject (CEP) [18-23], National Air Toxics Assessment [24], adaptations of the CEP applied for a more localized level in the State of California [25], and taken here (i.e., that uses modeling of emission inventories to predict ambient concentrations) can. This approach also does not wait for harm to occur such as an epidemiology retrospective study would. A number of studies in the region conducted between 1996 and 2008 have estimated health risks from air pol- lution in Russia and Ukraine [3,4,6,7,16,26] or Kazakh- stan [27] and have generally concluded that there are significant health risks from inhalation of pollutants, par- ticularly particulate matter. Ambient air pollution stan- dards in the former Soviet Union required short-term pollutant estimates for all major pollution sources. Risk assessment methodologies have evolved to fit advances in the science that supports them. More recently, former Soviet Union countries have started to use more specific meteorological data in dispersion modeling, similar to the approach used in this Zaporizhzhia case-study. For example, Larson et al. [15] recalculated dispersion model outputs to obtain annual average pollutant concentrations in Volgograd Russia. In comparison to the EOL model, the ISC-Aermod has the advantage of a more state of the art design and is capable of greater utilization of the Zaporizhzhia HydroMet data. This modeling tool esti- mates atmospheric stability classes rather than the “worst weather conditions” used by the EOL. In addition, annual average pollutant concentrations are estimated rather than maximum 20-minute concentrations. Consequently, because of dependence on short term higher estimates,  Risk Assessment Capacity Building Program in Zaporizhzhia Ukraine: Emissions Inventory Construction, Ambient Modeling, and Hazard Results Open Access JEP 1484 Table 4. Estimation of the annual average TSP and РМ10 concentrations and population at receptors (i.e., receptor points, RP) in Zaporizhzhia. RP TSP (modeled) (µg/m3) PM10 (ext.) (µg/m3) PM2.5 (ext.) (µg/m3) Population 1 330 180 120 52,958 2 420 230 150 62,146 3 510 280 180 323,963 4 580 320 210 144,292 5 640 350 230 61,695 6 690 380 250 78,978 *Total population at all listed receptors (9) was 83,480; ext. = extrapolated. EOL estimates tend to be much higher. Thus, the Zapho- rizhzhia study uses a more accurate state-of-the art air dispersion methodology than previously practiced in Ukraine. Through the successful development of the Za- porizhzhia pilot, not only has Ukrainian risk assessment expertise been further developed, but centers of risk as- sessment expertise have also been established for con- tinuing applications across Ukraine. The 2007 emissions inventory and the subsequent dis- persion modeling developed for the Zaporizhzhia pilot study show a range of pollutants to which significant segments of the population are exposed; these exposures include particulate matter and a number of carcinogens. The results of the pilot study identified major sources of pollution, what types of pollutants were expected to be emitted, and areas in the Zaporizhzhia with the greatest exposure. Such information is critical for the placement of monitors to both confirm the distribution of the pollu- tion geographically and identify pollutants in the plume that should be monitored. Although monitoring data of the Sanitary and Epidemiologic stations of Zaporizhzhia were briefly mentioned in the final Ukrainian report, no monitoring data for any pollutants were provided or compared to the modeled ambient concentration esti- mates. The report also noted that the content of respirable fine particles (РМ10 and РМ2.5) was not monitored and accounted for (i.e., they were not monitored). The UN Economic Commission for Europe [28] stated that in specific areas, such as Zaporizhzhia Oblast (in the highly polluted Donetsk-Dnieper area), a regional monitoring system and observation network was created to bring together all active monitoring entities. The most recent UN report for Ukraine [29] was published in 2007 and notes that: Self-monitoring by enterprises is not properly carried out and related data are not closely analyzed. Last but not least, findings from inspections end up in statistical da- tabases and are not followed up with in-depth analysis and appropriate actions. Even though a monitoring pro- gramme was adopted in 2004, the related budget streng- thened and the monitoring network developed, there are still significant gaps in the monitoring coverage; priori- ties are often absent or contradictory; the treatment of data is inappropriate; and the data are practically un- available. Moreover, there is no process for reconciling the data collected by different ministries, which results in different sets of values being issued for the same indica- tor. Some oblast environmental authorities have recently established online databases linking all monitoring insti- tutions and polluting enterprises in their regions, an effort that needs to be replicated in other oblasts and at the na- tional level. Descriptions of chemical classes such as nickel and chromium compounds in the existing emission invento- ries lack speciation of the emissions; the appropriate ap- portionment of emissions cannot be done between mem- bers of the group that have differing carcinogenic poten- cies. For example in the case of Chromium compounds, assignment of the highest carcinogenic potency estimate for all chromium emissions can lead to an overestimation of risk. The ratios of PM2.5/PM10 vary for emission sources with different types of technologies, industrial sectors, fuels, and by distance from emission sources to monitor- ing locations, etc. Cities that are not located in arid/ semi-arid or agricultural zones, but have high traffic emissions and relatively low fugitive road dust, will tend to have very high PM2.5/PM10 ratios [27]. Because the conditions in Zaporizhzhia closely resemble the general case in Russia and Ukraine where coal-fired power con- tributes a significant portion of air pollution, the esti- mates of PM2.5 have less variation due to sandstorms and confounding by agricultural dust generation. The Zapo- rizhzia emission inventory is for major stationary sources of PM and not mobile sources. Therefore even with only capturing a portion of the total particulate load through modeling large stationary sources, the modeled estimates may be underestimates of fine particle loads. The emis- sion inventory for particulate matter would also be im- proved by the inclusion of speciation between larger and smaller particles (i.e., PM10 vs. PM2.5) that would allow for a more accurate prediction of risk from mortality. Clearly, the accuracy of a risk assessment of the Za- porizhzhia air pollution is limited by uncertainty in the emissions inventory. Improvement of emissions accuracy would in turn provide the basis of a more accurate as- sessment of hazard and health risk. Given the limitations the emissions inventory to dis- cern PM10 and PM2.5, ambient monitoring would help to verify the modeling results. Ground-level measurements of air pollution, especially those of PM2.5 are not avail-  Risk Assessment Capacity Building Program in Zaporizhzhia Ukraine: Emissions Inventory Construction, Ambient Modeling, and Hazard Results Open Access JEP 1485 able for much of the world [30]. Ambient monitoring in Ukraine is even more limited and the work by Brauer et al. using satellite estimates based on population density and assumptions for PM2.5 generation without considera- tion of the local and high industrial PM sources does not give an accurate assessment for comparative purposes. Their study notes that there is no Eastern European (i.e., Russia and Ukraine) monitoring to validate their results. Ambient monitoring estimates for the same period were taken from Brauer et al. [30]. Their estimates were de- rived from global estimates of PM2.5 using satellite ob- servations, a global atmospheric model, an econometrics model, and airport observations of visual range. Briefly, satellite-derived and TM5 global atmospheric model es- timates were averaged at a 0.1˚ × 0.1˚ grid cell resolution (equivalent to approximately 11 km × 11 km at the equator). In this process, population density is used as a proxy to identify high emission (“urban”) areas within each 1˚ × 1˚ grid cell. The outputs of the Brauer et al. [30] model are population-weighted averages and not ambient concentrations and the model assumed that urban pri- mary PM2.5 should not exceed the rural concentration by a factor 5. All secondary components (SO4, NO3) and primary natural PM (mineral dust, sea salt) are assumed to be distributed uniformly over the native grid cell and hence are not incremented. Without monitoring data, how realistic are the reported values? The World Health Organization (WHO) Regional publications noted Monitoring in Prague was reported to show average PM10 in the city center to be 94 μg/m3 with daily concentrations as high as 225 μg/m3 during a 3 month period (January-March) in 1997 [31]. For Ukraine, National as well as WHO standards for specific pollut- ants were reported to be exceeded in almost all major Ukrainian cities with the values for nitrogen dioxide and particulate matter exceeded at almost all of the country’s national measurement stations (i.e., National Ukrainian standard of 150 μg/m3 of particulate matter and WHO standard i.e., 40 μg/m3 for PM10) [29]. A question arises as to whether the conditions de- scribed in the pilot still exist. When economic conditions force the shutdown of these industries and thereby limit emissions from these sources, emission estimates from this case-study can result in an overestimation of risk. According to World Bank estimates of GDP [32], 2005 was $86B (current USD), up from about $65B in 2003, the first year in this study. GDP peaked in 2008 at $117B and is still recovering from the recession of 2008. The WHO 2007 [28] report states that the steel industry still dominated the Ukrainian economy and that in 2004, the capacity utilization of Ukraine’s steel industry was at a high of 89%, with Ukraine being the seventh biggest metal producer in the world. Donetsk oblast alone ac- counted for about 40 per cent of total air emissions in Ukraine, followed by Dnipropetrovsk (21%) and Zapor- izhzhia (6%) oblasts [28]. Ukraine remains one of the top producers of steel in the world with 2.3% of the world production as of 2011; 2011 levels are similar to the av- erage production from 2001-2005 [33,34]. Therefore, the emissions inventory estimates in this study have not been reduced by the shutdown of these industries. As described above, this emission inventory contains uncertainty and the estimation of individual risk to the population living in Zaporizhzhia based upon it is be- yond the scope of this paper. Nonetheless, the develop- ment of the emissions inventory and subsequent applica- tion of more current dispersion modeling should be viewed as a success and did fulfill the goals of the CPB. An important aspect of the project was that not only did local officials and health experts help in providing expo- sure information, but outside experts in various aspects of risk assessment (e.g., exposure and toxicology) par- ticipated from several countries. The results from the case-study provided a useful tool for risk management and environmental policy. They have helped aid further development of risk assessment expertise and capacity. Under the auspices of the CBP, outside experts have also been able to contribute to risk management and policy development. However, the integrity of the process has been maintained as one developed by Ukraine for its specific needs and situation. It is important to note that the types of exposure information needed for the case- study have not been easy to access as the Ukrainian sys- tem did not have a tradition of public emissions data- bases. A great deal of credit is due to the local officials and industrial facilities for providing this information. Hazard information for the pollutant emissions can be obtained from a number of international sources, how- ever exposure information cannot. In addition and as a result of this effort, a center has been established that still is in operation in Kyiv (i.e., Center of Environmental Health and Risk Assessment) within the O. M. Marzeiev Institute of Hygiene and Medical Ecology. 5. Disclaimer This manuscript has been reviewed by the US Envi- ronmental Protection Agency and approved for publica- tion. The views expressed in this manuscript are those of the authors and do not necessarily reflect the views or policies of the US Environmental Protection Agency. 6. Acknowledgements The authors would like to thank the late Dr. William E. Freeman (US EPA Office of International Affairs) for his support and vision of cooperation between the US EPA and its environmental counterparts in countries of the former Soviet Union. We would also like to thank Ok-  Risk Assessment Capacity Building Program in Zaporizhzhia Ukraine: Emissions Inventory Construction, Ambient Modeling, and Hazard Results Open Access JEP 1486 sana Voznyuk for her efforts in data processing, report formulation, and translation. Funding for this project was provided by the US Department of State (Freedom Sup- port Act). REFERENCES [1] Ukrainian Ministry of Environment and Natural Re- sources (MENR), Ukraine Ministry of Environmental Protection, “National Report on the State of Environment in Ukraine 1999,” Rayevsky Scientific Publishers, Kyiv, 2000. http://enrin.grida.no/htmls/ukraina/soe98 [2] United Nations Economic Commission for Europe’s Con- vention on Long-Range Transboundary Air Pollution (UNEC), “EMEP Status Report 3/2011; Persistant Organic Pollut- ants in the Environment,” Meterological Synthesizing Centre-East. A. Gusev, S. Dutchak, O. Rozovskaya, V. Shatalov, V. Sokovykh and N. Vulykh (authors) Chemi- cal Coordinating Centre, 2011. http://www.msceast.org [3] M. Brody, J. Caldwell and A. Golub, “Developing Risk- Based Priorities for Reducing Air Pollution in Urban Set- tings in Ukraine,” In: L. Craig, D. Krewski, J. Shortreed, J. Samet, Eds., Strategies for Clean Air and Health, Pro- ceedings of the AIRNET Annual Conference/NERAM In- ternational Colloquium, Rome, 5-7 November 2003, p. 268. [4] A. Serdyuk, O. Turos, O. Kartavtsev, A. Petrosian and O. Voznyuk, “Final Report on the Project ‘Environmental Capacity Building in the NIS’,” Marzeev Institute of Hy- giene and Medical Ecology, Center of Environmental Health and Risk Assessment. US EPA Cooperative Agree- ment #X4-83199301: “Environmental Capacity Building in the Newly Independent States,” Environmental De- fense Fund, Contributions from M. Brody, J. C. Caldwell, A. Golub, S. Avaliani, G. Safonov and E. Strukova, 2008. [5] “EPA Toxic Release Inventory and the National Air Tox- ics Assessment,” 2013. www.epa.gov http://www.epa.gov/nata http://www2.epa.gov/toxics-release-inventory-tri-program [6] “Human Health Risk Assessment from Environmental Pollutants,” Руководство По Оценке Риска Для Здоровья Населения При Воздействии Химических Веществ, Загрязняющих Окружающую Среду, Руко- водство, 2004. [7] G. Oniszhenko, S. Avaliani, S. Novikov, U. Rakhmanin and K. Bushtueva, “Basis for Human Health Risk As- sessment Resulting from Chemical Pollutants,” NII ECH & GOS, Moscow City, 2002. http://dx.doi.org/10.1016/S0305-750X(99)00086-8 [8] ISC-AERMOD Program. http://www.epa.gov/scram001/dispersion_prefrec.htm#ae rmod [9] “US Environmental Protection Agency’s Integrated Risk Information System,” 2013. http://cfpub.epa.gov/ncea/iris/index.cfm [10] International Agency for Cancer Research (IARC), 2013. http://monographs.iarc.fr [11] K. L. Shumake, J. D. Sacks, J. S. Lee and D. O. Johns, “Susceptibility of Older Adults to Health Effects Induced by Ambient Air Pollutants Regulated by the European Union and the United States,” Aging Clinical and Ex- perimental Research, Vol. 25, No. 1, 2013, pp. 3-8. http://dx.doi.org/10.1007/s40520-013-0001-5 [12] J. S. Brown, T. Gordon, O. Price and B. Asgharian, “Thoracic and Respirable Particle Definitions for Human Health Risk Assessment,” Particle and Fibre Toxicology, 2013. [13] US EPA, “Summary of the History of the Particulate Matter National Ambient Air Quality Standards,” 2012. http://www.epa.gov/ttn/naaqs/standards/pm/s_pm_history .html http://www.epa.gov/pm/2012/decfstandards.pdf [14] S. Avaliani and B. Revich, “Авалиани С.Л., Ревич Б.М. Оценка риска загрязнения окружающей среды для здоровья населения как инструмент муниципальной экологической политики в Московской области,” 2010. [15] B. Larson, S. Avaliani, A. Golub, et al., “The Economics of Air Pollution Health Risks in Russia: A Case Study of Volgograd,” World Development, Vol. 27, No. 10, 1999, pp. 1803-1819. http://dx.doi.org/10.1016/S0305-750X(99)00086-8 [16] E. Strukova, A. Golub and A. Markandya, “Air Pollution Costs in Ukraine,” Fondazione Eni Enrico Mattei, Nota Di Lavoro, Milano, 2006. [17] A. J. Cohen, H. R. Anderson, B. Ostro, K. D. Pandey, M. Krzyzanowski, N. Kuenzli, K. Gutschmidt, C. A. Pope, I. Romieu, J. M. Samet and K. R. Smith, “Mortality Impacts of Urban Air Pollution,” In: M. Ezzati, A. D. Lopez, A. Rodgers and C. U. J. L. Murray, Eds., Comparative Quan- tification of Health Risks: Global and Regional Burden of Disease Due to Selected Major Risk Factors, Vol. 2, World Health Organization, Geneva, 2004, pp. 1353- 1433. [18] D. Axelrad, R. Morello-Frosch, T. Woodruff and J. Cald- well, “Assessment of Estimated 1990 Air Toxics Concen- trations in Urban Areas in the United States,” Environ- mental Science & Policy, Vol. 2, No. 4-5, 1999, pp. 397- 411. http://dx.doi.org/10.1016/S1462-9011(99)00036-2 [19] J. Caldwell, T. Woodruff, R. Morella-Frosch and D. Ax- elrad, “Application of Health Information to Hazardous Air Pollutants Modeled in EPA’s Cumulative Exposure Project,” Toxicology and Industrial Health, Vol. 14, No. 3, 1998. pp. 429-454. http://dx.doi.org/10.1177/074823379801400304 [20] A. Rosenbaum, D. Axelrad, T. Woodruff, Y. Wei, M. Ligocki and J. Cohen, “National Estimates of Outdoor Air Toxics Concentrations,” Journal of the Air & Waste Management Association, Vol. 49, No. 10, 1999, pp. 1138-1152. http://dx.doi.org/10.1080/10473289.1999.10463919 [21] A. Rosenbaum, M. Ligocki and Y. Wei, “Modeling Cu- mulative Outdoor Concentrations of Hazardous Air Pol- lutants: Revised Final Report,” Systems Applications In- ternational, Inc., San Rafael, 1999.  Risk Assessment Capacity Building Program in Zaporizhzhia Ukraine: Emissions Inventory Construction, Ambient Modeling, and Hazard Results Open Access JEP 1487 [22] T. Woodruff, D. Axelrad, J. Caldwell, R. Morello-Frosch and A. Rosenbaum, “Public Health Implications of 1990 Air Toxics Concentrations across the United States,” En- vironmental Health Perspectives, Vol. 106, No. 5, 1998, pp. 245-251. http://dx.doi.org/10.1289/ehp.98106245 [23] T. Woodruff, J. Caldwell, V. Cogliano and D. Axelrad, “Estimating Cancer Risk from Outdoor Concentrations of Hazardous Air Pollutants in 1990,” Environmental Re- search, Vol. 82, 2000, pp. 194-206. http://dx.doi.org/10.1006/enrs.1999.4021 [24] US Environmental Protection Agency, Science Advisory Board, “Summary of July 2000 Peer Review of the Draft Document Planning and Scoping the Initial National- Scale Assessment: An Element of the EPA National Air Toxics Program,” 2003. www.epa.gov/ttn/atw/nata/peer.html [25] Morello-Frosch, T. Woodruff, D. Axelrad, and J. Cald- well, “Air Toxics and Health Risks in California: The Public Health Implications of Outdoor Concentrations,” Risk Analysis, Vol. 20, No. 2, 2000, pp. 273-291. http://dx.doi.org/10.1111/0272-4332.202026 [26] A. Golub and E. Strukova, “Evaluation and Identification of Priority Air Pollutants for Environmental Management on the Basis of Risk Analysis in Russia,” Journal of Toxi- cology and Environmental Health, Part A, Vol. 71, No. 1, 2008, pp. 86-91. http://dx.doi.org/10.1080/15287390701558238 [27] U. Kenessariyev, A. Golub, M. Brody, A. Dosmukhame- tov, M. Amrin, A. Erzhanova and D. Kenessary, “Human Health Cost of Air Pollution in Kazakhstan,” Journal of Environmental Protection, Vol. 4, No. 11, 2013, pp. 1-8. http://www.scirp.org/journal/jep http://dx.doi.org/10.4236/jep.2013.48101 [28] Economic Commission for Europe, “Environmental Mo- nitoring and Reporting: Eastern Europe, the Caucasus and Central Asia,” Published by the United Nations, 2003, 67 p. http://www.unece.org/env/europe/monitoring/EnvMonRe p/en/chapter1.pdf Chapter1 [29] UNECE, “Environmental Performance Reviews: Ukraine, Second Review. ISBN 978-92-1-116958-4. ISSN 1020- 4563,” United Nations Economic Commission for Europe, Committee on Environmental Policy, United Nations Publication, 2007. http://www.unece.org/fileadmin/DAM/env/epr/epr_studie s/Ukraine%20II.pdf [30] M. Brauer, M. Amann, R. T. Burnett, A. Cohen, F. Den- tener, M. Ezzati, S. B. Henderson, M. Kryzanowski, R. V. Vartin, R. V. Dingenen, A. van Donkelaar and G. D. Thurs- ton, “Exposure Assessment for Estimation of the Global Burden of Disease Attributable to Outdoor Air Pollution,” Environmental Science & Technology, Vol. 46, No. 2, 2012, pp. 652-660. http://dx.doi.org/10.1021/es2025752 [31] WHO Europe, “Monitoring Ambient Air Quality for Health Impact Assessment,” WHO Regional Publications, European Series No. 85, 1999, p. 102. [32] World Bank Estimates of Ukraine GDP, “World Data- Bank; World Development Indicators, GDP 2000-2012 (Current US$),” The World Bank, Washington DC, 2013. http://databank.worldbank.org/Data/Views/Reports/Table View.aspx?IsShared=true&IsPopular=series [33] V. S. Vlasjuk, “Global Market and Ukrainian Steel In- dustry in 2011-2012,” Ministry of Economic Develop- ment and Trade of Ukraine SE UPE Co. Research & Consulting, 71st Session of the OECD Steel Committee Meeting, Paris, 5-6 December 2011. http://www.oecd.org/sti/ind/49206658.pdf [34] World Steel Association, “World Steel Figures 2012,” E Basson Director General, World Steel in Figures © World Steel Association, 2012.
|