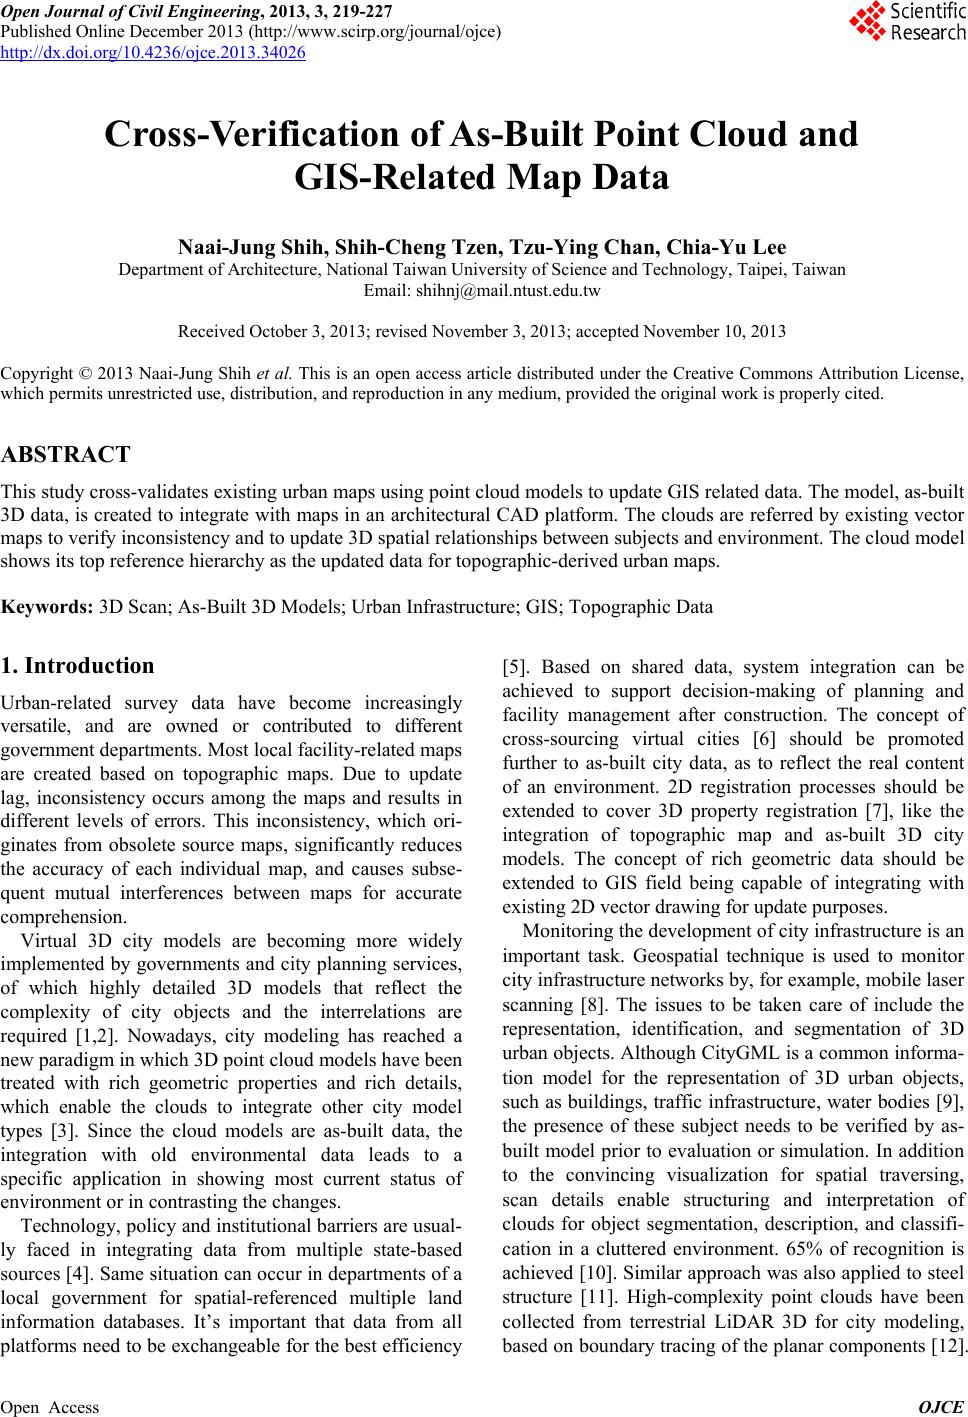
 Open Journal of Civil Engineering, 2013, 3, 219-227 Published Online December 2013 (http://www.scirp.org/journal/ojce) http://dx.doi.org/10.4236/ojce.2013.34026 Open Access OJCE Cross-Verification of As-Built Point Cloud and GIS-Related Map Data Naai-Jung Shih, Shih-Cheng Tzen, Tzu-Ying Chan, Chia-Yu Lee Department of Architecture, National Taiwan University of Science and Technology, Taipei, Taiwan Email: shihnj@mail.ntust.edu.tw Received October 3, 2013; revised November 3, 2013; accepted November 10, 2013 Copyright © 2013 Naai-Jung Shih et al. This is an open access article distributed under the Creative Commons Attribution License, which permits unrestricted use, distribution, and reproduction in any medium, provided the original work is properly cited. ABSTRACT This study cross-validates existing urban maps using point cloud models to update GIS related data. The model, as-built 3D data, is created to integrate with maps in an architectural CAD platform. The clouds are referred by existing vector maps to verify inconsistency and to update 3D spatial relationships between subjects and environment. The cloud model shows its top reference hierarchy as the updated data for topographic-derived urban maps. Keywords: 3D Scan; As-Built 3D Models; Urban Infrastructure; GIS; Topographic Data 1. Introduction Urban-related survey data have become increasingly versatile, and are owned or contributed to different government departments. Most local facility-related maps are created based on topographic maps. Due to update lag, inconsistency occurs among the maps and results in different levels of errors. This inconsistency, which ori- ginates from obsolete source maps, significantly reduces the accuracy of each individual map, and causes subse- quent mutual interferences between maps for accurate comprehension. Virtual 3D city models are becoming more widely implemented by governments and city planning services, of which highly detailed 3D models that reflect the complexity of city objects and the interrelations are required [1,2]. Nowadays, city modeling has reached a new paradigm in which 3D point cloud models have been treated with rich geometric properties and rich details, which enable the clouds to integrate other city model types [3]. Since the cloud models are as-built data, the integration with old environmental data leads to a specific application in showing most current status of environment or in contrasting the changes. Technology, policy and institutional barriers are usual- ly faced in integrating data from multiple state-based sources [4]. Same situation can occur in departments of a local government for spatial-referenced multiple land information databases. It’s important that data from all platforms need to be exchangeable for the best efficiency [5]. Based on shared data, system integration can be achieved to support decision-making of planning and facility management after construction. The concept of cross-sourcing virtual cities [6] should be promoted further to as-built city data, as to reflect the real content of an environment. 2D registration processes should be extended to cover 3D property registration [7], like the integration of topographic map and as-built 3D city models. The concept of rich geometric data should be extended to GIS field being capable of integrating with existing 2D vector drawing for update purposes. Monitoring the development of city infrastructure is an important task. Geospatial technique is used to monitor city infrastructure networks by, for example, mobile laser scanning [8]. The issues to be taken care of include the representation, identification, and segmentation of 3D urban objects. Although CityGML is a common informa- tion model for the representation of 3D urban objects, such as buildings, traffic infrastructure, water bodies [9], the presence of these subject needs to be verified by as- built model prior to evaluation or simulation. In addition to the convincing visualization for spatial traversing, scan details enable structuring and interpretation of clouds for object segmentation, description, and classifi- cation in a cluttered environment. 65% of recognition is achieved [10]. Similar approach was also applied to steel structure [11]. High-complexity point clouds have been collected from terrestrial LiDAR 3D for city modeling, based on boundary tracing of the planar components [12]. 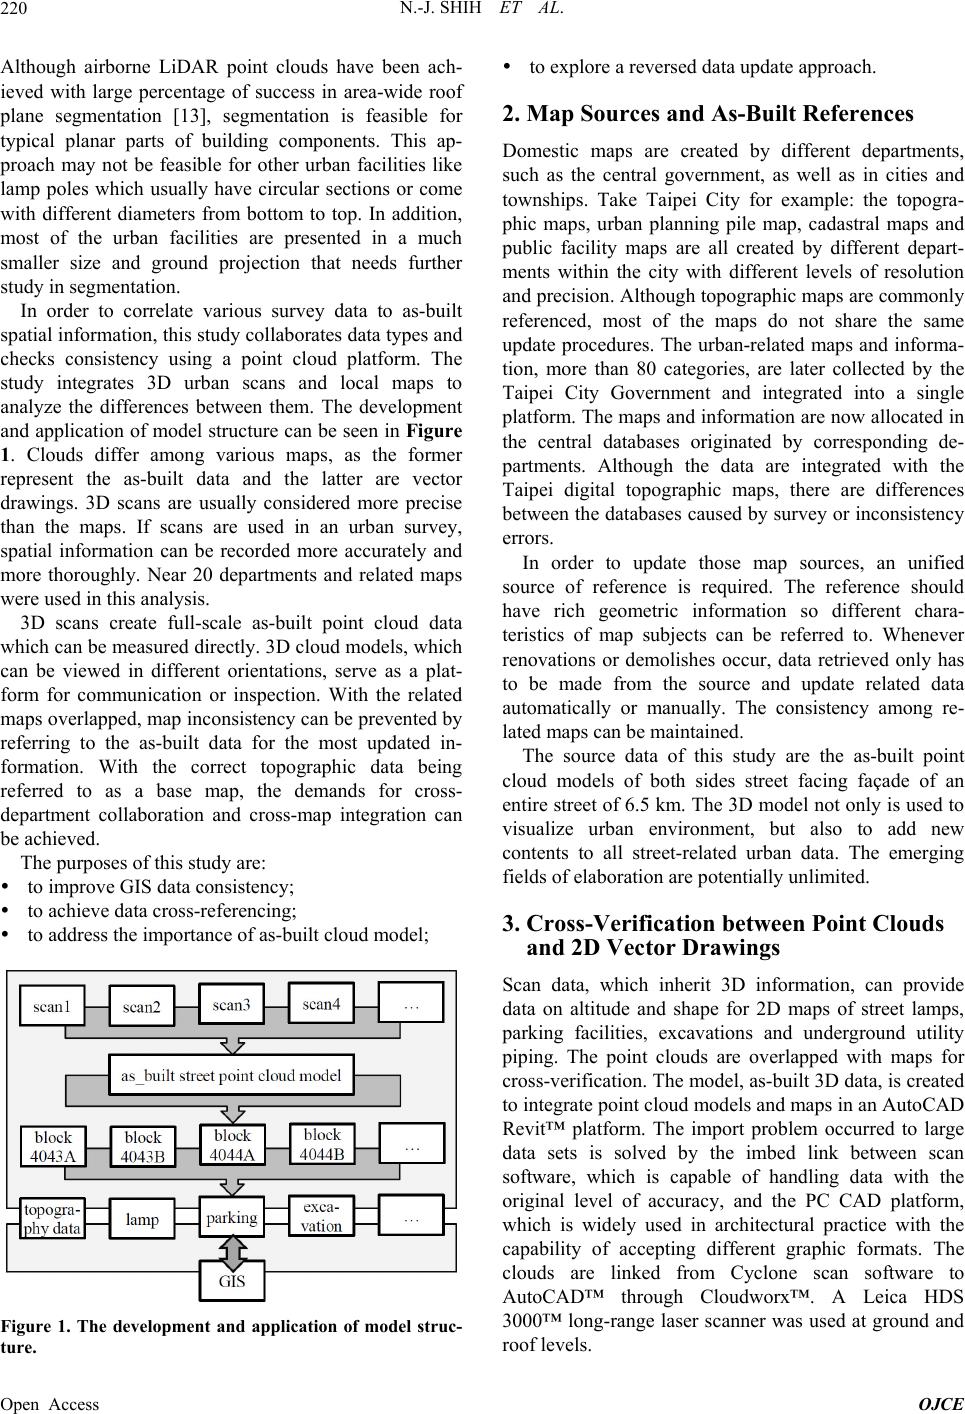 N.-J. SHIH ET AL. 220 Although airborne LiDAR point clouds have been ach- ieved with large percentage of success in area-wide roof plane segmentation [13], segmentation is feasible for typical planar parts of building components. This ap- proach may not be feasible for other urban facilities like lamp poles which usually have circular sections or come with different diameters from bottom to top. In addition, most of the urban facilities are presented in a much smaller size and ground projection that needs further study in segmentation. In order to correlate various survey data to as-built spatial information, this study collaborates data types and checks consistency using a point cloud platform. The study integrates 3D urban scans and local maps to analyze the differences between them. The development and application of model structure can be seen in Figure 1. Clouds differ among various maps, as the former represent the as-built data and the latter are vector drawings. 3D scans are usually considered more precise than the maps. If scans are used in an urban survey, spatial information can be recorded more accurately and more thoroughly. Near 20 departments and related maps were used in this analysis. 3D scans create full-scale as-built point cloud data which can be measured directly. 3D cloud models, which can be viewed in different orientations, serve as a plat- form for communication or inspection. With the related maps overlapped, map inconsistency can be prevented by referring to the as-built data for the most updated in- formation. With the correct topographic data being referred to as a base map, the demands for cross- department collaboration and cross-map integration can be achieved. The purposes of this study are: to improve GIS data consistency; to achieve data cross-referencing; to address the importance of as-built cloud model; Figure 1. The development and application of model struc- ture. to explore a reversed data update approach. 2. Map Sources and As-Built References Domestic maps are created by different departments, such as the central government, as well as in cities and townships. Take Taipei City for example: the topogra- phic maps, urban planning pile map, cadastral maps and public facility maps are all created by different depart- ments within the city with different levels of resolution and precision. Although topographic maps are commonly referenced, most of the maps do not share the same update procedures. The urban-related maps and informa- tion, more than 80 categories, are later collected by the Taipei City Government and integrated into a single platform. The maps and information are now allocated in the central databases originated by corresponding de- partments. Although the data are integrated with the Taipei digital topographic maps, there are differences between the databases caused by survey or inconsistency errors. In order to update those map sources, an unified source of reference is required. The reference should have rich geometric information so different chara- teristics of map subjects can be referred to. Whenever renovations or demolishes occur, data retrieved only has to be made from the source and update related data automatically or manually. The consistency among re- lated maps can be maintained. The source data of this study are the as-built point cloud models of both sides street facing façade of an entire street of 6.5 km. The 3D model not only is used to visualize urban environment, but also to add new contents to all street-related urban data. The emerging fields of elaboration are potentially unlimited. 3. Cross-Verification between Point Clouds and 2D Vector Drawings Scan data, which inherit 3D information, can provide data on altitude and shape for 2D maps of street lamps, parking facilities, excavations and underground utility piping. The point clouds are overlapped with maps for cross-verification. The model, as-built 3D data, is created to integrate point cloud models and maps in an AutoCAD Revit™ platform. The import problem occurred to large data sets is solved by the imbed link between scan software, which is capable of handling data with the original level of accuracy, and the PC CAD platform, which is widely used in architectural practice with the capability of accepting different graphic formats. The clouds are linked from Cyclone scan software to AutoCAD™ through Cloudworx™. A Leica HDS 3000™ long-range laser scanner was used at ground and roof levels. Open Access OJCE 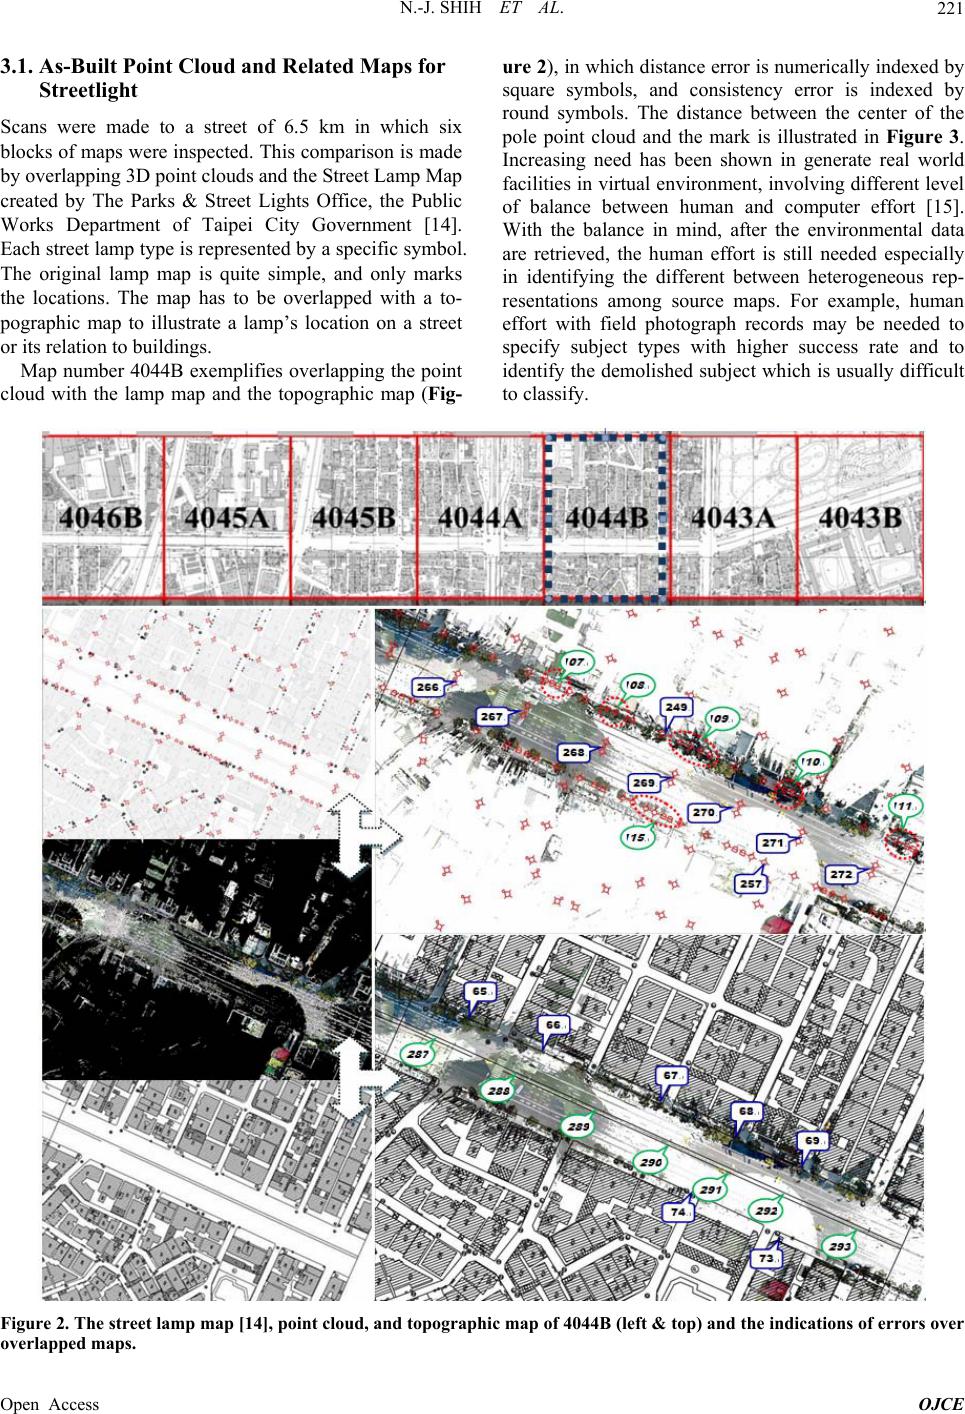 N.-J. SHIH ET AL. Open Access OJCE 221 3.1. As-Built Point Cloud and Related Maps for Streetlight Scans were made to a street of 6.5 km in which six blocks of maps were inspected. This comparison is made by overlapping 3D point clouds and the Street Lamp Map created by The Parks & Street Lights Office, the Public Works Department of Taipei City Government [14]. Each street lamp type is represented by a specific symbol. The original lamp map is quite simple, and only marks the locations. The map has to be overlapped with a to- pographic map to illustrate a lamp’s location on a street or its relation to buildings. Map number 4044B exemplifies overlapping the point cloud with the lamp map and the topographic map (Fig- ure 2), in which distance error is numerically indexed by square symbols, and consistency error is indexed by round symbols. The distance between the center of the pole point cloud and the mark is illustrated in Figure 3. Increasing need has been shown in generate real world facilities in virtual environment, involving different level of balance between human and computer effort [15]. With the balance in mind, after the environmental data are retrieved, the human effort is still needed especially in identifying the different between heterogeneous rep- resentations among source maps. For example, human effort with field photograph records may be needed to specify subject types with higher success rate and to identify the demolished subject which is usually difficult to classify. Figure 2. The street lamp map [14], point cloud, and topographic map of 4044B (left & top) and the indications of errors over overlapped maps.  N.-J. SHIH ET AL. 222 Figure 3. Detailed illustration of the distance error and inconsistency error between the point cloud (4044B), the street lamp map and the topographic map (top). The garden lamp (), which was marked in lamp map, was actually removed (bottom). Based on the comparison between the point cloud, the topographic map and the lamp map, errors are shown: Distance error: 33 errors with a distance larger than 1.88 m are identified in the street lamp map. The minimum distance is 0.7 m, and the maximum dis- tance is 4.59 m. 14 errors with a distance larger than 2.62 m are identified in the topographic map. The minimum distance is 0.4 m, and the maximum dis- tance is 4.86 m. Consistency error: The location and type of lamps can be identified by the point cloud. 26 errors were found in street lamp map, where ground garden lamps had been demolished. 21 errors where different types of lamps should be marked were found in the topo- graphic map. In correcting distance and consistency errors, it was found that the topographic and lamp maps also contained inconsistencies regarding building boundaries, open spaces and lamp locations. Scans made on ground level can retrieve more details than the plane-loaded scanners or aerial photographs can achieve. Maps were found in- consistent to cloud model and to current urban scenes. First, the maps were updated based on cloud model and then use the new source map to update subject data. The two inconsistency types, which occur to maps and the marked subjects, were corrected. Topographic map update: This study updated the topographic map by referring to the point cloud. The point cloud was orthogonally projected to eliminate the vanishing point distortion commonly found in aerial photographs of cities. The registration of 360 × 270 scan regions provided sufficient data to illustrate the relationship between subjects and environments. In contrast, current digital topographic map based on aerial maps and field surveys suffer from the amount of details. The topographic map update (Figure 4) shows the differences in building size, location and angle. More specifically, region A has become a nine-story build- ing, instead of an open space; region B has become a construction site, instead of a residence complex; and region C has become a Mass Rapid Transit (MRT) construction site. Street lamp map update: In order to correct the errors made by the topographic-based drawings and human field survey, the street lamp map was updated by referring to the point cloud as well. Figure 5 shows that most of the current lamp locations are wrong. Region A has become an MRT construction site and lamps have been temporarily removed, with the lamp map has not been updated; region B-E have ground garden lamps been demolished, without the lamp map being updated. The cloud model represe ts valuable as-built data n Open Access OJCE 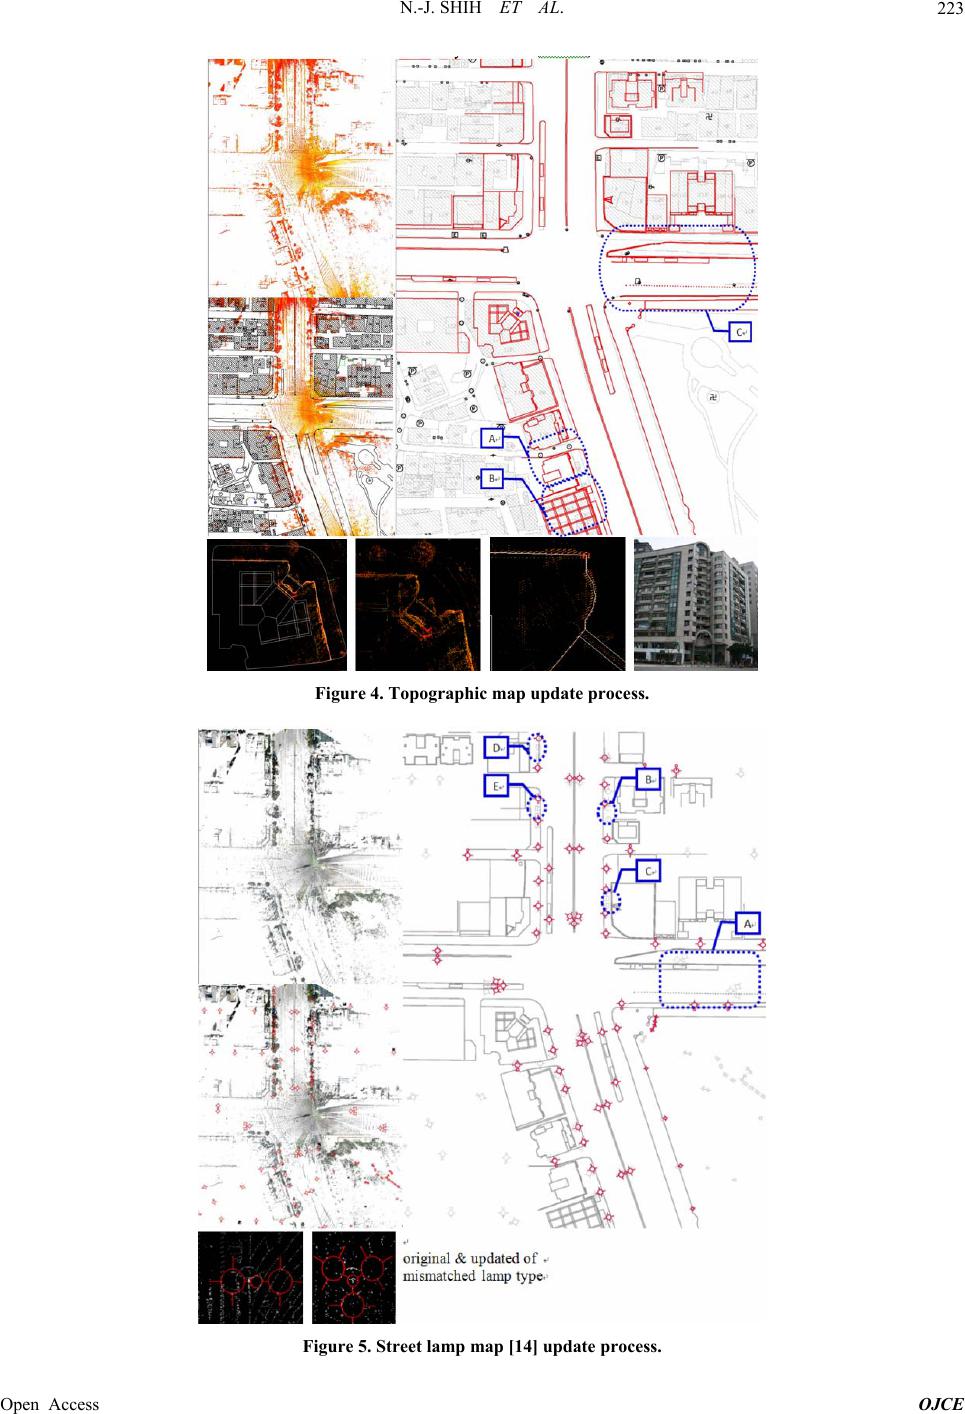 N.-J. SHIH ET AL. 223 Figure 4. Topographic map update proc e ss. Figure 5. Street lamp map [14] update process. Open Access OJCE 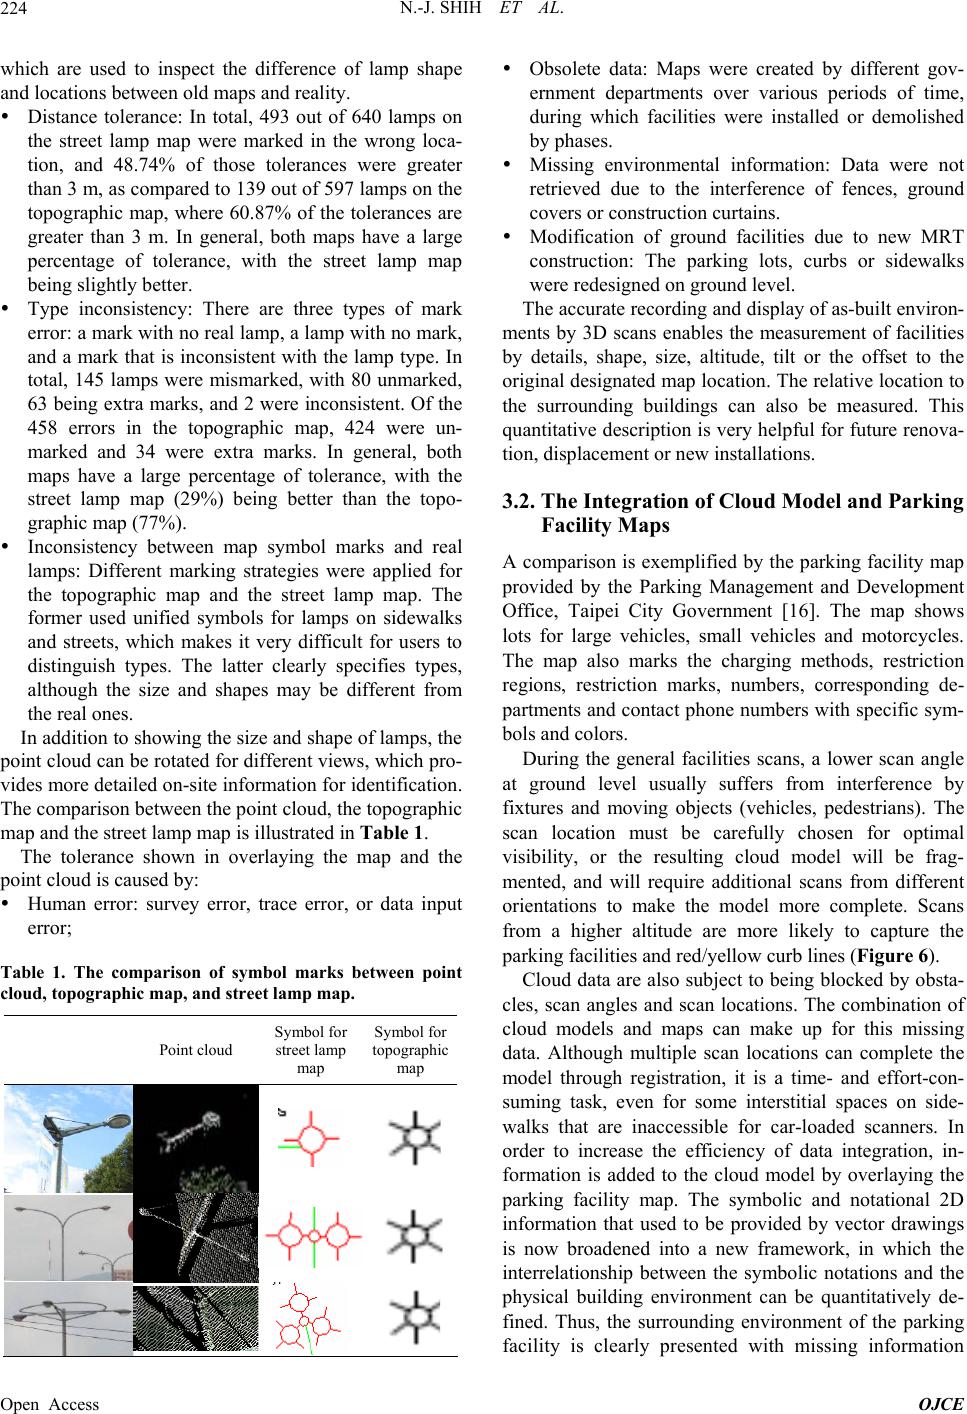 N.-J. SHIH ET AL. 224 which are used to inspect the difference of lamp shape and locations between old maps and reality. Distance tolerance: In total, 493 out of 640 lamps on the street lamp map were marked in the wrong loca- tion, and 48.74% of those tolerances were greater than 3 m, as compared to 139 out of 597 lamps on the topographic map, where 60.87% of the tolerances are greater than 3 m. In general, both maps have a large percentage of tolerance, with the street lamp map being slightly better. Type inconsistency: There are three types of mark error: a mark with no real lamp, a lamp with no mark, and a mark that is inconsistent with the lamp type. In total, 145 lamps were mismarked, with 80 unmarked, 63 being extra marks, and 2 were inconsistent. Of the 458 errors in the topographic map, 424 were un- marked and 34 were extra marks. In general, both maps have a large percentage of tolerance, with the street lamp map (29%) being better than the topo- graphic map (77%). Inconsistency between map symbol marks and real lamps: Different marking strategies were applied for the topographic map and the street lamp map. The former used unified symbols for lamps on sidewalks and streets, which makes it very difficult for users to distinguish types. The latter clearly specifies types, although the size and shapes may be different from the real ones. In addition to showing the size and shape of lamps, the point cloud can be rotated for different views, which pro- vides more detailed on-site information for identification. The comparison between the point cloud, the topographic map and the street lamp map is illustrated in Table 1. The tolerance shown in overlaying the map and the point cloud is caused by: Human error: survey error, trace error, or data input error; Table 1. The comparison of symbol marks between point cloud, topographic map, and street lamp map. Point cloud Symbol for street lamp map Symbol for topographic map Obsolete data: Maps were created by different gov- ernment departments over various periods of time, during which facilities were installed or demolished by phases. Missing environmental information: Data were not retrieved due to the interference of fences, ground covers or construction curtains. Modification of ground facilities due to new MRT construction: The parking lots, curbs or sidewalks were redesigned on ground level. The accurate recording and display of as-built environ- ments by 3D scans enables the measurement of facilities by details, shape, size, altitude, tilt or the offset to the original designated map location. The relative location to the surrounding buildings can also be measured. This quantitative description is very helpful for future renova- tion, displacement or new installations. 3.2. The Integration of Cloud Model and Parking Facility Maps A comparison is exemplified by the parking facility map provided by the Parking Management and Development Office, Taipei City Government [16]. The map shows lots for large vehicles, small vehicles and motorcycles. The map also marks the charging methods, restriction regions, restriction marks, numbers, corresponding de- partments and contact phone numbers with specific sym- bols and colors. During the general facilities scans, a lower scan angle at ground level usually suffers from interference by fixtures and moving objects (vehicles, pedestrians). The scan location must be carefully chosen for optimal visibility, or the resulting cloud model will be frag- mented, and will require additional scans from different orientations to make the model more complete. Scans from a higher altitude are more likely to capture the parking facilities and red/yellow curb lines (Figure 6). Cloud data are also subject to being blocked by obsta- cles, scan angles and scan locations. The combination of cloud models and maps can make up for this missing data. Although multiple scan locations can complete the model through registration, it is a time- and effort-con- suming task, even for some interstitial spaces on side- walks that are inaccessible for car-loaded scanners. In order to increase the efficiency of data integration, in- formation is added to the cloud model by overlaying the parking facility map. The symbolic and notational 2D information that used to be provided by vector drawings is now broadened into a new framework, in which the interrelationship between the symbolic notations and the physical building environment can be quantitatively de- fined. Thus, the surrounding environment of the parking facility is clearly presented with missing information Open Access OJCE 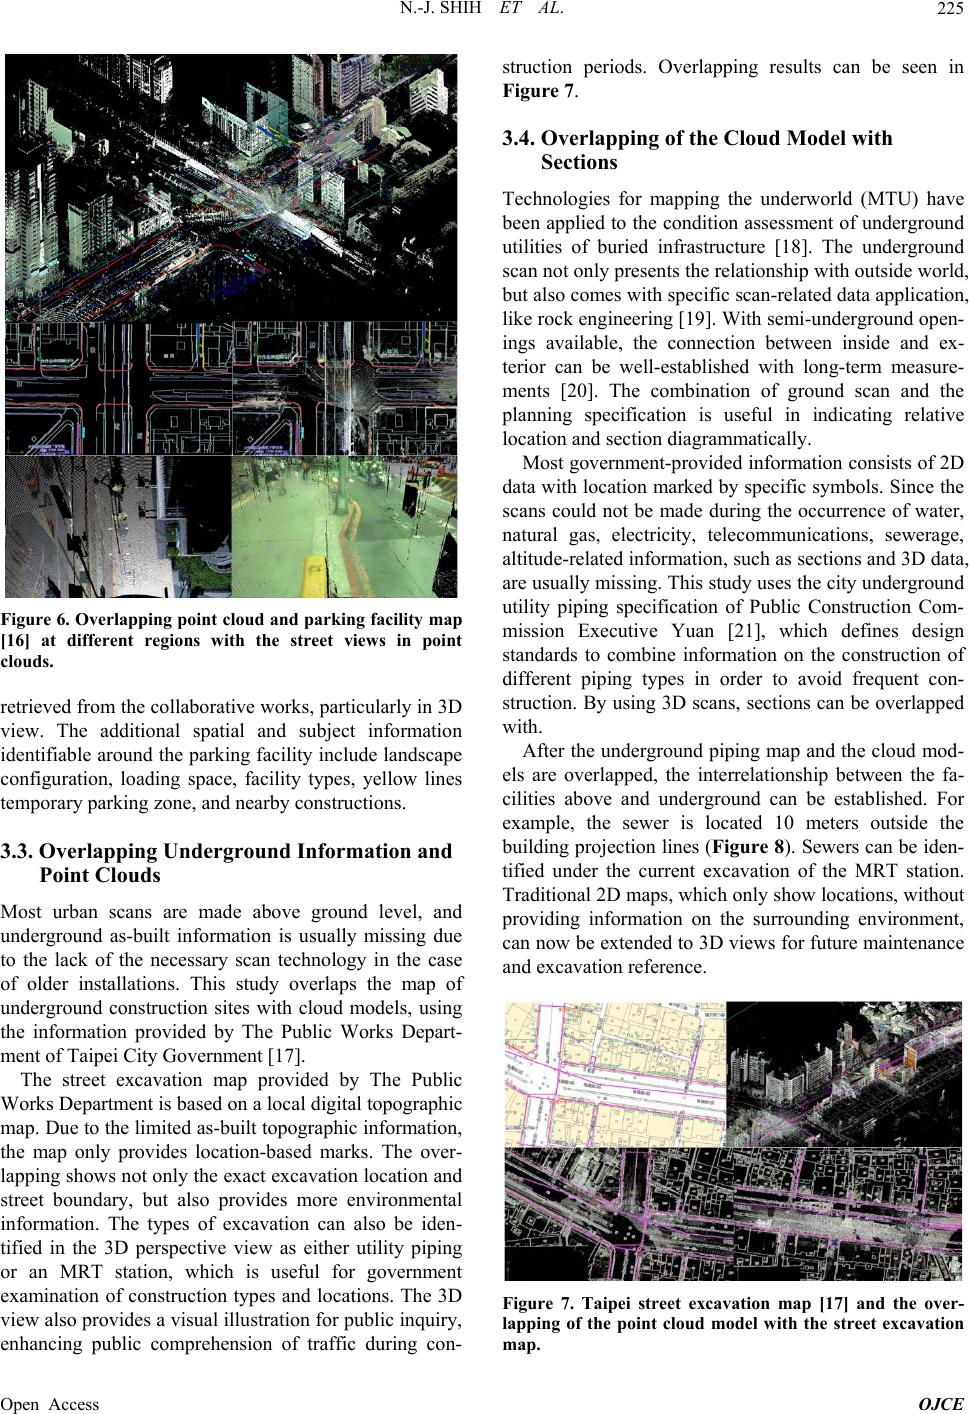 N.-J. SHIH ET AL. 225 Figure 6. Overlapping point cloud and parking facility map [16] at different regions with the street views in point clouds. retrieved from the collaborative works, particularly in 3D view. The additional spatial and subject information identifiable around the parking facility include landscape configuration, loading space, facility types, yellow lines temporary parking zone, and nearby constructions. 3.3. Overlapping Underground Information and Point Clouds Most urban scans are made above ground level, and underground as-built information is usually missing due to the lack of the necessary scan technology in the case of older installations. This study overlaps the map of underground construction sites with cloud models, using the information provided by The Public Works Depart- ment of Taipei City Government [17]. The street excavation map provided by The Public Works Department is based on a local digital topographic map. Due to the limited as-built topographic information, the map only provides location-based marks. The over- lapping shows not only the exact excavation location and street boundary, but also provides more environmental information. The types of excavation can also be iden- tified in the 3D perspective view as either utility piping or an MRT station, which is useful for government examination of construction types and locations. The 3D view also provides a visual illustration for public inquiry, enhancing public comprehension of traffic during con- struction periods. Overlapping results can be seen in Figure 7. 3.4. Overlapping of the Cloud Model with Sections Technologies for mapping the underworld (MTU) have been applied to the condition assessment of underground utilities of buried infrastructure [18]. The underground scan not only presents the relationship with outside world, but also comes with specific scan-related data application, like rock engineering [19]. With semi-underground open- ings available, the connection between inside and ex- terior can be well-established with long-term measure- ments [20]. The combination of ground scan and the planning specification is useful in indicating relative location and section diagrammatically. Most government-provided information consists of 2D data with location marked by specific symbols. Since the scans could not be made during the occurrence of water, natural gas, electricity, telecommunications, sewerage, altitude-related information, such as sections and 3D data, are usually missing. This study uses the city underground utility piping specification of Public Construction Com- mission Executive Yuan [21], which defines design standards to combine information on the construction of different piping types in order to avoid frequent con- struction. By using 3D scans, sections can be overlapped with. After the underground piping map and the cloud mod- els are overlapped, the interrelationship between the fa- cilities above and underground can be established. For example, the sewer is located 10 meters outside the building projection lines (Figure 8). Sewers can be iden- tified under the current excavation of the MRT station. Traditional 2D maps, which only show locations, without providing information on the surrounding environment, can now be extended to 3D views for future maintenance and excavation reference. Figure 7. Taipei street excavation map [17] and the over- lapping of the point cloud model with the street excavation map. Open Access OJCE 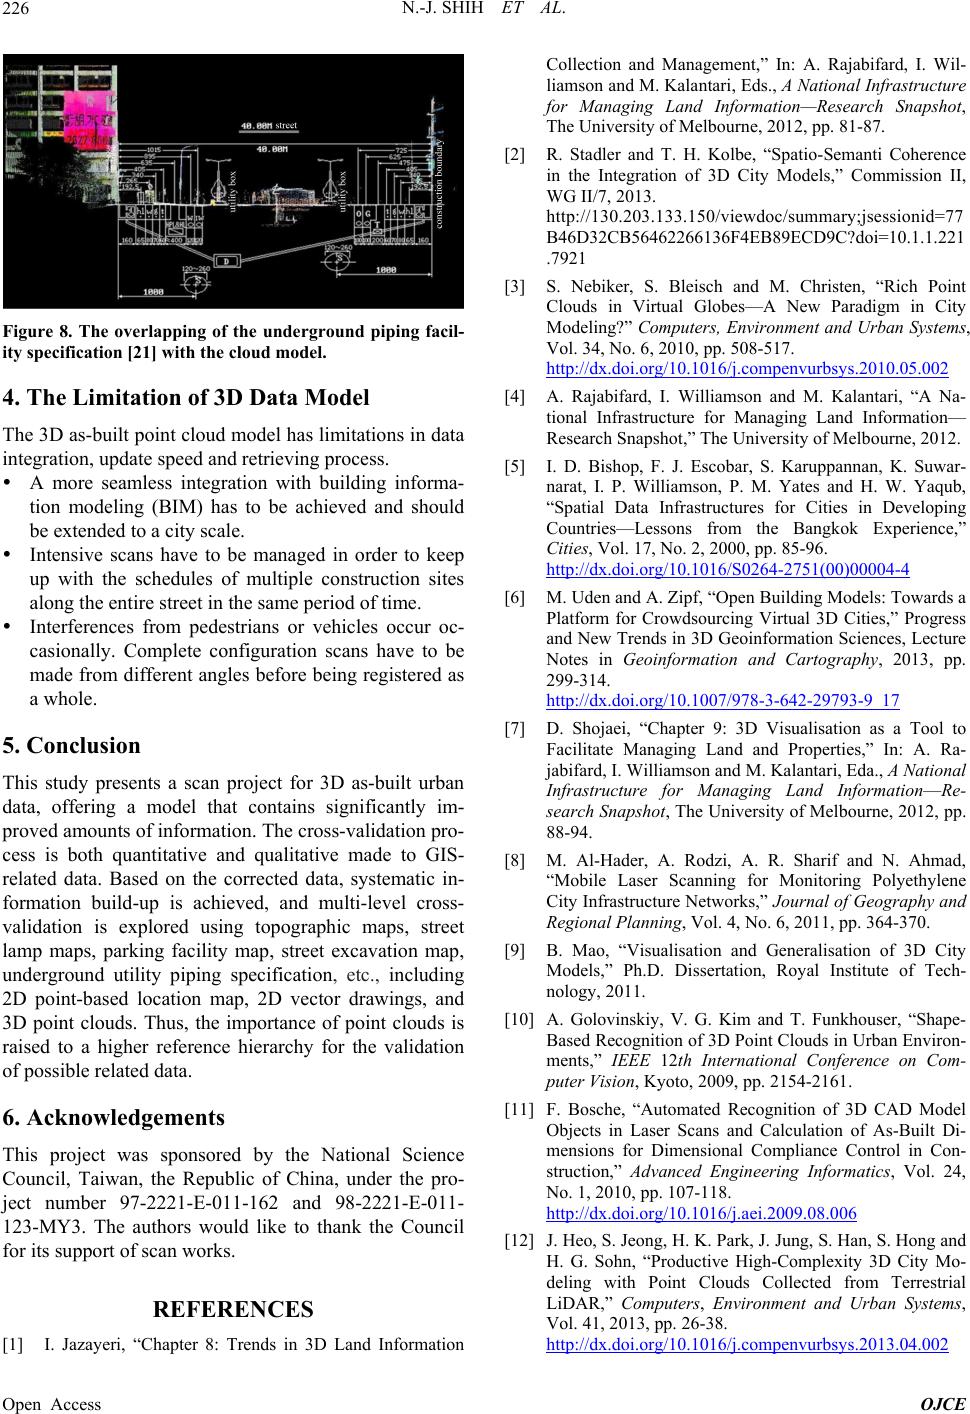 N.-J. SHIH ET AL. 226 Figure 8. The overlapping of the underground piping facil- ity specification [21] with the cloud model. 4. The Limitation of 3D Data Model The 3D as-built point cloud model has limitations in data integration, update speed and retrieving process. A more seamless integration with building informa- tion modeling (BIM) has to be achieved and should be extended to a city scale. Intensive scans have to be managed in order to keep up with the schedules of multiple construction sites along the entire street in the same period of time. Interferences from pedestrians or vehicles occur oc- casionally. Complete configuration scans have to be made from different angles before being registered as a whole. 5. Conclusion This study presents a scan project for 3D as-built urban data, offering a model that contains significantly im- proved amounts of information. The cross-validation pro- cess is both quantitative and qualitative made to GIS- related data. Based on the corrected data, systematic in- formation build-up is achieved, and multi-level cross- validation is explored using topographic maps, street lamp maps, parking facility map, street excavation map, underground utility piping specification, etc., including 2D point-based location map, 2D vector drawings, and 3D point clouds. Thus, the importance of point clouds is raised to a higher reference hierarchy for the validation of possible related data. 6. Acknowledgements This project was sponsored by the National Science Council, Taiwan, the Republic of China, under the pro- ject number 97-2221-E-011-162 and 98-2221-E-011- 123-MY3. The authors would like to thank the Council for its support of scan works. REFERENCES [1] I. Jazayeri, “Chapter 8: Trends in 3D Land Information Collection and Management,” In: A. Rajabifard, I. Wil- liamson and M. Kalantari, Eds., A National Infrastructure for Managing Land Information—Research Snapshot, The University of Melbourne, 2012, pp. 81-87. [2] R. Stadler and T. H. Kolbe, “Spatio-Semanti Coherence in the Integration of 3D City Models,” Commission II, WG II/7, 2013. http://130.203.133.150/viewdoc/summary;jsessionid=77 B46D32CB56462266136F4EB89ECD9C?doi=10.1.1.221 .7921 [3] S. Nebiker, S. Bleisch and M. Christen, “Rich Point Clouds in Virtual Globes—A New Paradigm in City Modeling?” Computers, Environment and Urban Systems, Vol. 34, No. 6, 2010, pp. 508-517. http://dx.doi.org/10.1016/j.compenvurbsys.2010.05.002 [4] A. Rajabifard, I. Williamson and M. Kalantari, “A Na- tional Infrastructure for Managing Land Information— Research Snapshot,” The University of Melbourne, 2012. [5] I. D. Bishop, F. J. Escobar, S. Karuppannan, K. Suwar- narat, I. P. Williamson, P. M. Yates and H. W. Yaqub, “Spatial Data Infrastructures for Cities in Developing Countries—Lessons from the Bangkok Experience,” Cities, Vol. 17, No. 2, 2000, pp. 85-96. http://dx.doi.org/10.1016/S0264-2751(00)00004-4 [6] M. Uden and A. Zipf, “Open Building Models: Towards a Platform for Crowdsourcing Virtual 3D Cities,” Progress and New Trends in 3D Geoinformation Sciences, Lecture Notes in Geoinformation and Cartography, 2013, pp. 299-314. http://dx.doi.org/10.1007/978-3-642-29793-9_17 [7] D. Shojaei, “Chapter 9: 3D Visualisation as a Tool to Facilitate Managing Land and Properties,” In: A. Ra- jabifard, I. Williamson and M. Kalantari, Eda., A National Infrastructure for Managing Land Information—Re- search Snapshot, The University of Melbourne, 2012, pp. 88-94. [8] M. Al-Hader, A. Rodzi, A. R. Sharif and N. Ahmad, “Mobile Laser Scanning for Monitoring Polyethylene City Infrastructure Networks,” Journal of Geography and Regional Planning, Vol. 4, No. 6, 2011, pp. 364-370. [9] B. Mao, “Visualisation and Generalisation of 3D City Models,” Ph.D. Dissertation, Royal Institute of Tech- nology, 2011. [10] A. Golovinskiy, V. G. Kim and T. Funkhouser, “Shape- Based Recognition of 3D Point Clouds in Urban Environ- ments,” IEEE 12th International Conference on Com- puter Vision, Kyoto, 2009, pp. 2154-2161. [11] F. Bosche, “Automated Recognition of 3D CAD Model Objects in Laser Scans and Calculation of As-Built Di- mensions for Dimensional Compliance Control in Con- struction,” Advanced Engineering Informatics, Vol. 24, No. 1, 2010, pp. 107-118. http://dx.doi.org/10.1016/j.aei.2009.08.006 [12] J. Heo, S. Jeong, H. K. Park, J. Jung, S. Han, S. Hong and H. G. Sohn, “Productive High-Complexity 3D City Mo- deling with Point Clouds Collected from Terrestrial LiDAR,” Computers, Environment and Urban Systems, Vol. 41, 2013, pp. 26-38. http://dx.doi.org/10.1016/j.compenvurbsys.2013.04.002 Open Access OJCE  N.-J. SHIH ET AL. Open Access OJCE 227 [13] A. Jochem, B. Hofle, V. Wichmann, M. Rutzinger and A. Zipf, “Area-Wide Roof Plane Segmentation in Airborne LiDAR Point Clouds,” Computers, Environment and Urban Systems, Vol. 36, No. 1, 2012, pp. 54-64. http://dx.doi.org/10.1016/j.compenvurbsys.2011.05.001 [14] Parks and Street Lights Office, the Public Works Depart- ment of Taipei City Government, “Street Lamp Map,” 2011. http://english.pslo.taipei.gov.tw/ [15] M. Fumarola and R. Poelman, “Generating Virtual En- vironments of Real World Facilities: Discussing Four Different Approaches,” Automation in Construction, Vol. 20, No. 3, 2011, pp. 263-269. http://dx.doi.org/10.1016/j.autcon.2010.08.004 [16] Parking Management and Development Office, Depart- ment of Transportation, Taipei City Government, “Park- ing Facility Map,” 2011. http://www.pma.taipei.gov.tw/ct.asp?xItem=117894&ctN ode=8817&mp=117021 [17] Public Works Department, Taipei City Government, “Un- derground Construction Site Map,” 2011. http://english.pwd.taipei.gov.tw/ [18] T. Hao, C. D. F. Rogers, N. Metje, D. N. Chapman, J. M. Muggleton, K. Y. Foo, P. Wang, S. R. Pennock, P. R. Atkins, S. G. Swingler, J. Parker, S. B. Costello, M. P. N. Burrow, J. H. Anspach, R. J. Armitage, A. G. Cohn, K. Goddard, P. L. Lewin, G. Orlando, M. A. Redfern, A. C. D. Royal and A. J. Saul, “Condition Assessment of the Buried Utility Service Infrastructure,” Tunnelling and Underground Space Technology, Vol. 28, 2012, pp. 331- 344. http://dx.doi.org/10.1016/j.tust.2011.10.011 [19] O. Aydana and R. Ulusay, “Geotechnical and Geoen- vironmental Characteristics of Man-Made Underground Structures in Cappadocia, Turkey,” Engineering Geology, Vol. 69, No. 3-4, 2003, pp. 245-272. http://dx.doi.org/10.1016/S0013-7952(02)00285-5 [20] Ö. Kaşmer, R. Ulusay and M. Geniş, “Assessments on the Stability of Natural Slopes Prone to toe Erosion, and Man-Made Historical Semi-underground Openings Carved in Soft Tuffs at Zelve Open-Air Museum (Cappadocia, Turkey),” Engineering Geology, Vol. 158, 2013, pp. 135- 158. http://dx.doi.org/10.1016/j.enggeo.2013.03.010 [21] Public Construction Commission Executive Yuan, “City Underground Utility Piping Specification,” 2011. http://www.pcc.gov.tw/pccap2/TMPLfronted/EngIndex.d o?site=004
|