Paper Menu >>
Journal Menu >>
 Journal of Service Science and Management, 2013, 6, 273-282 Published Online December 2013 (http://www.scirp.org/journal/jssm) http://dx.doi.org/10.4236/jssm.2013.65031 Open Access JSSM Does Human Resource Management Help a Company’s Financial Operating Result? Rob. C. H. van Otterlo Faculty of Law, University of Amsterdam, Amsterdam, Netherlands. Email: robvanotterlo@icloud.com Received October 2nd, 2013; revised November 1st, 2013; accepted November 25th, 2013 Copyright © 2013 Rob. C. H. van Otterlo. This is an open access article distributed under the Creative Commons Attribution License, which permits unrestricted use, distribution, and reproduction in any medium, provided the original work is properly cited. In accor- dance of the Creative Commons Attribution License all Copyrights © 2013 are reserved for SCIRP and the owner of the intellectual property Rob. C. H. van Otterlo. All Copyright © 2013 are guarded by law and by SCIRP as a guardian. ABSTRACT Human Resource Management (HRM) is widely believed to have a positive effect on the performance of company. However, empirical proof of this is hard to come by. In this study, we try to establish a linkage between HRM and fi- nancial output of two case studies in the profit sector. To do this, we have developed a performance measurement sys- tem that is tailored to the specific needs of measuring HRM-performance in for-profit of company. Although we do not try to generalize the outcome of this study, it looks promising in the way that more case studies should be conducted using this specific performance measurement system. If nothing else, management and controllers could use the system to evaluate the performance of their HRM-tools. Keywords: HRM; Return on Investment; Finance 1. Introduction As HRM has become increasingly popular in manage- ment ranks, there are growing calls to make HRM efforts measurable and thus subject to direction. Several HRM theories associate HRM performance and organisational performance with each other. They assume, based on empirical research or not, that HRM has a positive im- pact on a company’s operating result. Up to now, how- ever, the “evidence” that HRM has a positive impact on the operating result has often been insufficiently “hard”. This article presents a theoretical model which partly fills this “gap” in the literature. We wish to answer the ques- tion: are the effects of HRM measurable and can they be assessed quantitatively? We also hope that the model will furnish a practical tool enabling controllers to measure the effect of HRM in companies. Based on such effectiveness measurements, a controller can advise the board and HR manager on how best to manage the company to optimise the HRM efforts. In this manner, HRM should be able to make a useful contribution to the particular organisation’s bottom-line objectives. 2. Structure of This Article In Sections 3 and 4, we will start with a brief overview of the various research schools regarding HRM perform- ance measurement. After this, in Sections 5 through 9, we will present our performance measurement model, which relates to measuring a business’s general per- formance, and then, in Sections 10 and 11, we will pre- sent the specific HRM performance measurement model. Next, we will offer specific recommendations in Section 12 on how controllers and management might use the model in practice, and, finally, in Section 13, we will make some concluding remarks. 3. HRM in Relation to Performance The relationship between HRM and performance has been the subject of a growing number of studies during the past thirty years, particularly in the English-speaking world. Dutch researchers have shown increased interest in this theme as well [1-5]. HRM also appears to be gaining ground as an opera- tional issue meriting attention by management. More and more, the HRM departments within large companies are  Does Human Resource Management Help a Company’s Financial Operating Result? 274 being led by a director or manager who is a top executive at the organisation. These departments thereby have a greater interest in making clear the part HRM plays in the overall business operations. The time seems ripe for no longer being satisfied with implicit assumptions about HRM/PM’s impact on the company’s operating result, but instead, to start searching for empirically-supported HRM performance theories which are as explicit as pos- sible. 4. Performance Theories It is generally assumed today that there is a positive rela- tionship between HRM and corporate performance [6-9]. There are various theories, however, concerning the way in which PM supposedly affects a company’s operating result. Three major schools of thought are reflected in Table 1: These actually represent three HRM performance ap- proaches: 1) strategic fit; 2) broad HRM approach with implicit assumptions about HRM performance and 3) normative theory. None of these schools, however, has been successful to now in providing sufficiently hard evidence demonstrating the connection between HRM and company performance. In this connection, Guest has stated, “There may be an association between HRM practices and company profit (one of the potential cor- porate objectives, RvO), but without some linkages (be- tween the performance indicators, RvO), we will not know why: we have no theory.”[10] 5. Company Performance: A Model The research described here provides a model for testing the effects of HRM policy against the operating results. This article is limited to for-profit organisations. All the models and performance indicators presented in this article have been derived from a previous case study [11]. Figure 1 shows in diagram form how, under our model, the effectiveness performance measurement is ultimately determined. The operating result is assessed based on a number of characteristics which, after being multiplied by a weight, are clustered into effectiveness criteria. In this manner, operating results within the same sector can be compared to one another. 6. The Performance Measurement Model In order to ultimately measure the performance of per- sonnel management in practice, we developed a theo- retical model, which can be tested empirically [11]. The model includes five “effectiveness criteria”, namely, financial added value; efficiency; needs met; self-main- tenance and satisfaction. These effectiveness criteria in turn consist of 21 performance indicators, the “effective- ness characteristics”. Effectiveness criteria and charac- teristics must be formulated differently for each industry and/or company. The effectiveness criteria and charac- teristics from which they are composed, as used in the empirical study mentioned earlier, are shown in Table 2. In terms of business operations, these characteristics will not all have the same importance in every instance. To assign a weight to these now, we asked 12 industry experts to assign a value to each characteristic for pur- poses of the case studies. The 12 experts evaluated the different effectiveness criteria on a scale of 1 - 5 {1 = irrelevant; 2 = unimpor- tant; 3 = neutral; 4 = important; 5 = very important} with regard to their perceived importance for their organisa- tions’ business operations [11]. The results shown in Ta- ble 2 are rounded-off averages. Table 1. HRM schools. “School” Theory Performance definition assumption/hypothesis Hendry & Pettigrew; Miles & Snow; Schuler & Jackson. (“Strategic Theory”, Michigan model) Focuses on strategy: the relationship between possible external, uncertain factors and HRM policy and practice. A good “fit” between HRM and its context (corporate strategy and corporate structure) results in superior “performance”. Performance is defined primarily in financial terms. Beer; Kochan; Katz & McKersie. (‘Descriptive Theory’, Harvard model) Broad HRM approach. Very general specification of the HRM field and the related outcomes. Strong focus on the different interests of employees in organisations. No clear picture of the relationship between HRM and performance. Walton; Lawler; Pfeffer; Guest. (“Normative Theory”) Normative. Based on “best practices”, and implies “one best way”. - If an integrated ‘set’ of HRM practices (best practices) focuses on the normative objectives commitment, quality and flexibility, employees will automatically perform better, resulting in better organisational performance. Open Access JSSM 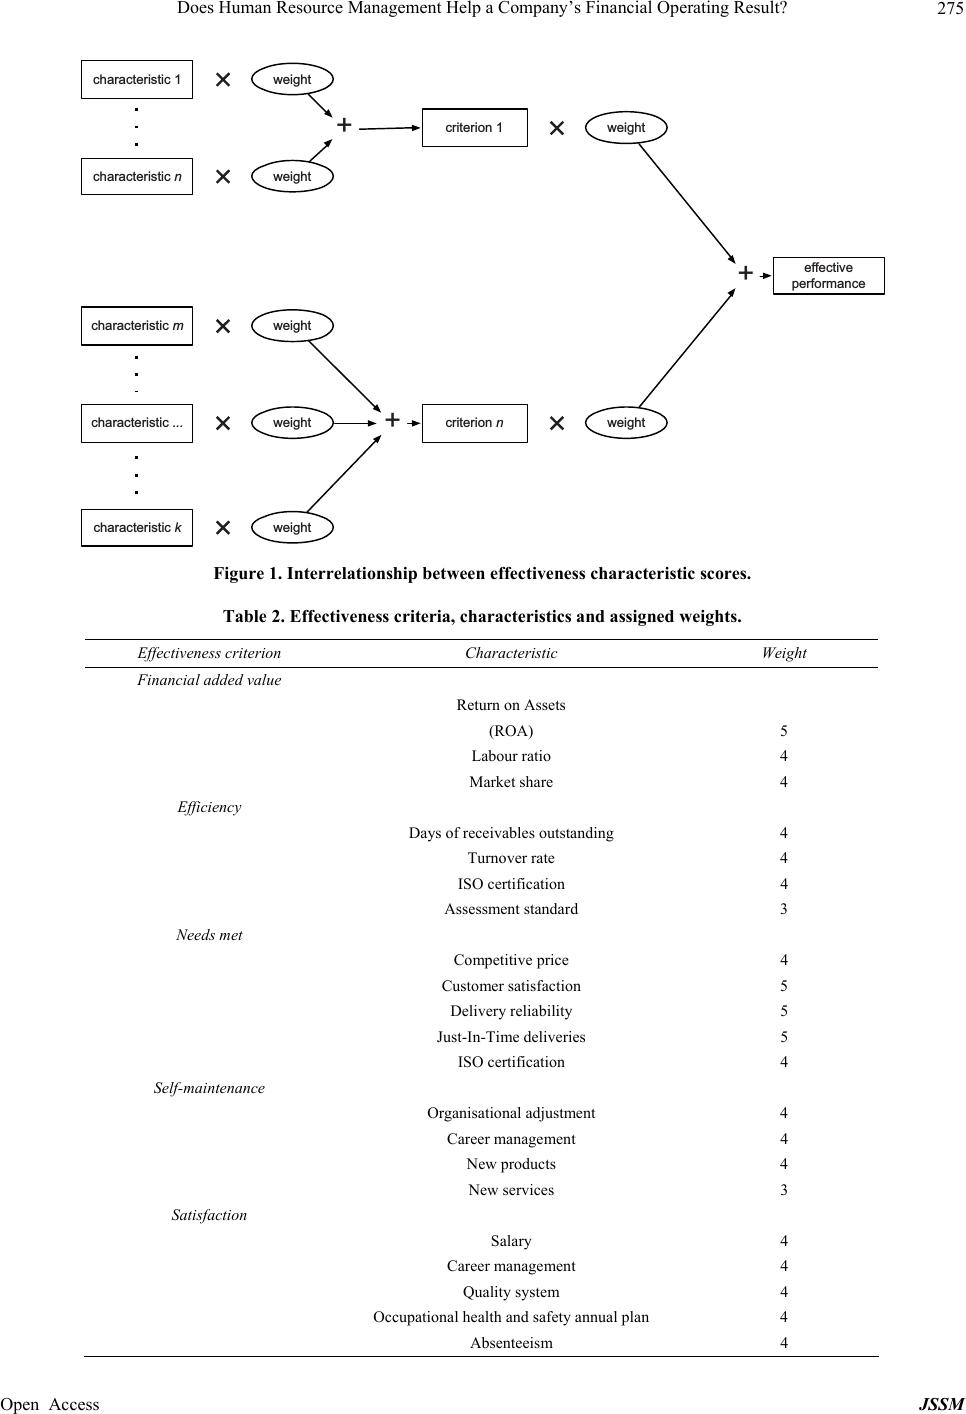 Does Human Resource Management Help a Company’s Financial Operating Result? 275 characteristic 1weight + characteristic nweight + characteristic mweight characteristic ... weight characteristic kweight criterion 1weight criterion nweight +effective performance Figure 1. Interrelationship between effectiveness characteristic scores. Table 2. Effectiveness criteria, characteristics and assigned weights. Effectiveness criterion Characteristic Weight Financial added value Return on Assets (ROA) 5 Labour ratio 4 Market share 4 Efficiency Days of receivables outstanding 4 Turnover rate 4 ISO certification 4 Assessment standard 3 Needs met Competitive price 4 Customer satisfaction 5 Delivery reliability 5 Just-In-Time deliveries 5 ISO certification 4 Self-maintenance Organisational adjustment 4 Career management 4 New products 4 New services 3 Satisfaction Salary 4 Career management 4 Quality system 4 Occupational health and safety annual plan 4 Absenteeism 4 Open Access JSSM 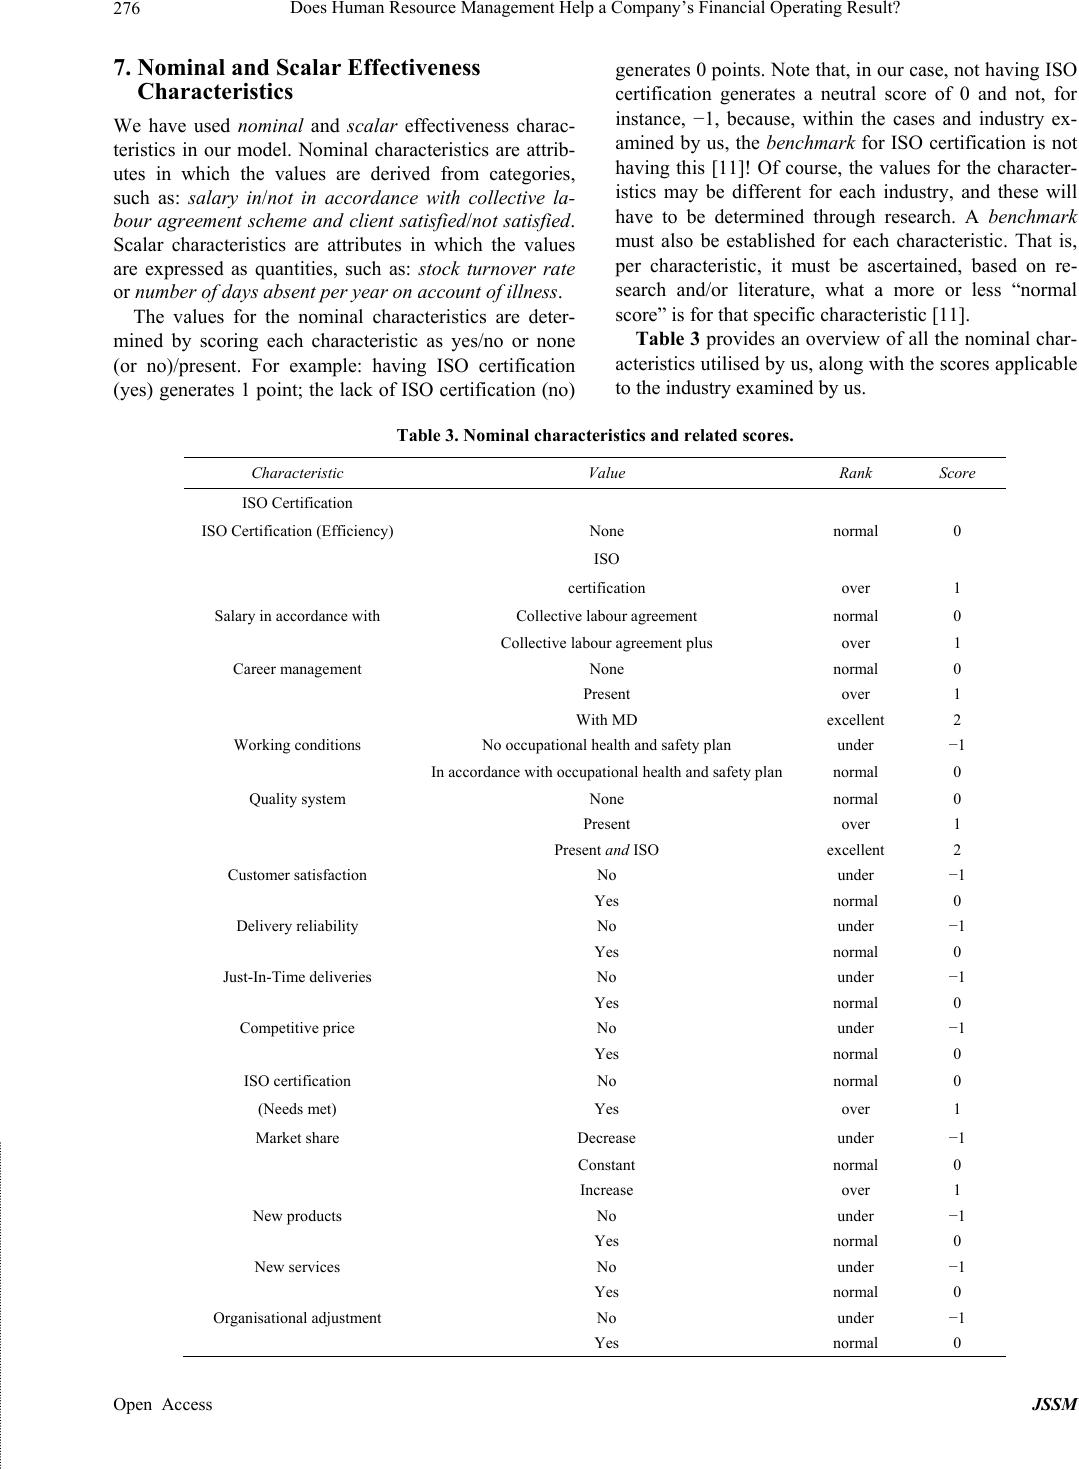 Does Human Resource Management Help a Company’s Financial Operating Result? 276 7. Nominal and Scalar Effectiveness Characteristics We have used nominal and scalar effectiveness charac- teristics in our model. Nominal characteristics are attrib- utes in which the values are derived from categories, such as: salary in/not in accordance with collective la- bour agreement scheme and client satisfied/not satisfied. Scalar characteristics are attributes in which the values are expressed as quantities, such as: stock turnover rate or number of days absent per year on account of illness. The values for the nominal characteristics are deter- mined by scoring each characteristic as yes/no or none (or no)/present. For example: having ISO certification (yes) generates 1 point; the lack of ISO certification (no) generates 0 points. Note that, in our case, not having ISO certification generates a neutral score of 0 and not, for instance, −1, because, within the cases and industry ex- amined by us, the benchmark for ISO certification is not having this [11]! Of course, the values for the character- istics may be different for each industry, and these will have to be determined through research. A benchmark must also be established for each characteristic. That is, per characteristic, it must be ascertained, based on re- search and/or literature, what a more or less “normal score” is for that specific characteristic [11]. Table 3 provides an overview of all the nominal char- acteristics utilised by us, along with the scores applicable to the industry examined by us. Table 3. Nominal characteristics and related scores. Characteristic Value Rank Score ISO Certification ISO Certification (Efficiency) None normal 0 ISO certification over 1 Salary in accordance with Collective labour agreement normal 0 Collective labour agreement plus over 1 Career management None normal 0 Present over 1 With MD excellent 2 Working conditions No occupational health and safety plan under −1 In accordance with occupational health and safety plan normal 0 Quality system None normal 0 Present over 1 Present and ISO excellent 2 Customer satisfaction No under −1 Yes normal 0 Delivery reliability No under −1 Yes normal 0 Just-In-Time deliveries No under −1 Yes normal 0 Competitive price No under −1 Yes normal 0 ISO certification No normal 0 (Needs met) Yes over 1 Market share Decrease under −1 Constant normal 0 Increase over 1 New products No under −1 Yes normal 0 New services No under −1 Yes normal 0 Organisational adjustment No under −1 Yes normal 0 Open Access JSSM  Does Human Resource Management Help a Company’s Financial Operating Result? 277 The values of the scalar characteristics are determined by scoring each characteristic beforehand as to its spe- cific performance falling within a ranking order. This specific performance is measured against the benchmark applicable to that characteristic. The ranking order is shown in Table 4. The score for the various scalar characteristics is de- termined based on a benchmark (this is also true, by the way, for the nominal characteristics) [11]. The following items are examined for each characteristic: What constitutes a “normal” score within the industry concerned? What are the worst and best realistic scores within the industry concerned, in other words: What is the lower limit and upper limit for each characteristic? To give two examples: Within the industry examined by us, Return on Assets, or ROA, is a scalar characteris- tic. ROA is expressed as a percentage. The scores associ- ated with the scalar categories in this case are as follows (Table 5). If we look, for example, at the characteristic days of receivables outstanding (see Table 6), then the bench- mark is 30 days (this is the payment period which sup- pliers themselves utilise in their delivery conditions) [11]. Excellent performance is achieved with a score of less than 20 days, while more than 45 days results in a bad performance score. We score all scalar characteristics in this manner. Table 6 sets forth all the scalar characteristics used by us. 8. Calculation of Overall Performance We cannot regard the total score as an absolute value, but must see it as an indication on a standard range made up of two hypothetical extremes, namely, the bad performer and the excellent performer (see Table 7) in the business sector. The total score is thus standardised and results in a figure between −100% and +100%. Table 7 shows the effectiveness performance classes in which an operating Table 4. Ranking order for scalar categories. Least important Most important bad under normal over excellent −2 −1 0 1 2 Table 5. ROA scores for scalar categories. Characteristic Lower limit Upper limit Rank Score ROA - 6% bad −2 6% 9% under −1 9% 12% normal 0 12% 20% over 1 20% - excellent 2 Table 6. Scalar characteristics and related scores. Characteristic Lower limit Upper limit Rank Score ROA - 6% bad −2 6% 9% under −1 9% 12% normal 0 12% 20% over 1 20% - excellent2 Labour ratio 45% excellent2 45% 48% over 1 48% 52% normal 0 52% 55% under −1 55% - bad −2 Stock turnover rate 2 bad −2 2 3.15 under −1 3.15 3.85 normal 0 3.85 4.5 over 1 4.5 - excellent2 Days of receivables outstanding - 20 excellent2 20 27 over 1 27 33 normal 0 33 45 under −1 45 - bad −2 Assessment standard- 70 bad −2 70 75 under −1 75 85 normal 0 85 90 over 1 90 - excellent2 Absenteeism - 4% excellent2 4% 7.5% over 1 7.5%8.5% normal 0 8.5%10% under −1 10% - bad −2 Table 7. Effectiveness performance classification (EP = ef- fectiveness performance). Effectiveness performance classes bad under normal over excellent EP < −30% −30% ≤ EP < −10% −10% ≤ EP < 10% 10% ≤ EP < 30% EP ≥ 30% result may be classified based on the standardised per- centage score. 9. Relative Performance Score To be able to give a relative value now to the scores of Open Access JSSM  Does Human Resource Management Help a Company’s Financial Operating Result? 278 the cases to be studied, we must place the total scores from such cases within the two extremes, best case and worst case (Table 8). Table 8 provides an overall summary. The relation- ship between the effectiveness score and the standard range is expressed as a percentage thereof. The “normal” scores from cases X and Y are completely arbitrary and do not represent actual scores. If, in the manner described above, the performance of companies is measured and placed within realistically selected extremes within the industry, a relative per- formance score will be obtained for the company or companies examined. Hence, as part of the measurement, all nominal and scalar characteristics are given a score. The final score will be determined by multiplying the value of each characteristic by the weight of the charac- teristic concerned. The scores thereby obtained for the various effectiveness criteria will then be added together to come up with a total score which falls within a certain range, with a related rating. In Table 9, we have applied this method to a fictional example. Table 8. Final comparison for effectiveness score. Case Eff. Score bad −30% under −10% normal 0% over 10% excellent 30% Best case 56 Case X X% Case Y Y% Worst case −44 Table 9. Scoring table for “De Eik” (best case). (Best Case) De Eik Value Weight Score Financial added value 1 26 26 ROA 21% 5 10 Labour ratio 44% 4 8 Market share Increase 4 8 Efficiency 1 26 26 Turnover rate 5 4 8 Days of receivables outstanding 8 4 8 ISO certification Yes 4 4 Assessment standard 91% 3 6 Needs met 1 9 9 Competitive price Yes 4 0 Customer satisfaction Yes 5 0 Delivery reliability Yes 5 0 Just-In-Time deliveries Yes 5 5 ISO certification Yes 4 4 Self-maintenance 1 11 11 Organisational adjustment Yes 4 0 Career management Yes 4 4 New products Yes 4 4 New services Yes 3 3 Satisfaction 1 24 24 Salary Collective labour agreement plus 4 8 Career management Yes 4 4 Quality system QM and ISO 4 4 Working conditions Occupational health and safety plan 4 0 Absenteeism 3% 4 8 Total score 96 Open Access JSSM  Does Human Resource Management Help a Company’s Financial Operating Result? 279 If, for example, we take a look at the effectiveness cri- terion financial added value, the total score of 26 was determined as follows: In the first column, “21%” is shown for the scalar characteristic ROA (return on assets). This 21% is an excellent score within the industry and generates a score of 2 (see Table 7). Next, based on the benchmark, a weight of 5 (=very important) is assigned to this specific key indicator by experts [11]. If we now multiply the ROA value from the first column in Table 9, namely, 2 (21% = score 2), by the score from the weight in column two, namely, 5, we get a score of 10 (column three). The same calculation method applies to the nominal characteristic market share in Table 9, which also falls within the effectiveness area financial added value, although the value of the concept ‘in crease’ (of market share) here results in a score of 2. Market share increase is a three-category question generating −1, 1 or 2 points for decrease, constant or increase respectively (see Table 4). When added together, all the scores in the financial added value effectiveness area in Table 9 result in a total score of 26. When added together, all the total scores in the dif- ferent effectiveness areas result in a final score of 96 for ‘De Eik’. This total score of 96 represents a maximum score (= 100%) as the best case. The same exercise for a fictional worst case results in a minimum score of −74 (= −/−100%). [12]. The standard range [11] is thus 170 (distance be- tween −/−74 and +96). Every ‘real’ case will therefore have a score some- where within this standard range [11]. For instance, if a certain case results in an effectiveness score of 2 (= −/−10%), this case will fall within the ‘under’ classi- fication (between −10% and 10%, see Table 7). In principle, the performance of any for-profit com- pany can be measured in this manner. Different effect- tiveness characteristics with their own specific bench- marks may apply, though, to different industries and companies. 10. The Performance of HRM After having presented a theoretical performance meas- urement model above which can be used to measure a for-profit company’s overall performance, we will now adjust this model to measure the performance of person- nel management, the purpose of this article. The model is essentially the same as the performance measurement model presented earlier. An additional element is the degree of influence which HRM can exert on the per- formance of the various performance characteristics. To measure the performance of personnel management, we have to determine first the degree to which personnel management is capable of influencing the key effective- ness indicators formulated by us earlier. We need to bear in mind that it is nearly impossible to determine whether the key indicators or performance indicators used by us are in fact comprehensive enough [13,14]. Our key indicators can be considered actual indicators, that is, aspects of research objects which cannot be measured in a direct sense, but which can be considered key data or measured values based on which perform- ance can be measured [15]. 11. The Degree of Influence Personnel Management has on the Key Effectiveness Indicators Because, as stated in Section 10, it is nearly impossible to determine precisely the degree to which personnel management influences the various key indicators, we used a simple five-point classification, in which the po- tential influence of personnel management on the par- ticular key indicator is reflected as a percentage between 0% (not at all) and 100% (to the highest degree); see Ta- ble 10. Table 10 below provides an overall summary of the key effectiveness indicators and the extent to which they are influenced by personnel management. For purposes of the ultimate measurement of personnel management’s performance, we will not include key in- dicators with a 0% score. To assess personnel management’s overall perform- ance, we will use the same performance class classifica- tion as we used earlier to measure the company’s overall performance (see Table 11). Here, too, the performance measurement for personnel management is relative. Realistically selected scores for fictional best and worst cases indicate the extremes for bad and excellent performers respectively (see Table 11). 12. HRM Performance Measurement: An Application A controller who is faced in practice with issues con- cerning HRM’s effectiveness will, with the model pre- sented here by us, be able to present a substantiated evaluation of the quality of the HR policy to his or her particular client. He or she will, however, have to adjust the model for each client and possibly for each industry; for different companies and/or industries, different per- formance indicators and key indicators are necessary to gain a proper picture of company performance and HRM erformance. The performance areas or effectiveness p Open Access JSSM  Does Human Resource Management Help a Company’s Financial Operating Result? 280 Table 10. Degree to which key effectiveness indicator is subject to influence by personnel management, expressed as a per- centage. Key effectiveness indicator Degree influenced by personnel management Financial added value ROA 75% = to a high degree (direct) Labour ratio 100% = to the highest degree (direct) Market share 0% = not at all Efficiency Stock turnover rate 0% Days of receivables outstanding 50% = to a certain extent (indirect/direct) ISO certification 25% = somewhat Assessment standard 100% Needs met Competitive price 0% Customer satisfaction 50% Delivery reliability 0% Just-In-Time deliveries 0% ISO certification 25% Self-maintenance Organisational adjustment 75% Career management 100% New products 0% New services 0% Satisfaction Salary 100% Career management 100% Quality system 25% Working conditions 75% Absenteeism 75% Table 11. Effectiveness performance classification (P = effectiveness performance). HRM/PM performance classes bad under normal over excellent P < −30% −30% ≤ P < −10% −10% ≤ P < 10% 10% ≤ P < 30% P[≥]30% criteria financial added value, efficiency, needs met and self-maintenance will remain the same, at least for for-profit companies. Moreover, it is likely that other benchmarks will be needed and that the manner of for- mulating financial performance may differ by company. In the “Koninklijke Jongeneel” and “Houtgroep Van Drimmelen” cases studied by me, we used such key in- dicators as Return on Assets (ROA) for financial per- formance. Of course, it is a well-known fact that entirely different key indicators can also be utilised for financial performance. For meaningful comparisons to be made within an industry with regard to a specific company’s financial performance, the indicators must therefore al- ways be adapted to a single manner of calculating profits. This will require some conversion work if companies within an industry use different methods to calculate profits. The various key indicators providing direction for a certain company can, of course, largely be taken from the annual financial and social reports. In addition, the controller will have to determine the benchmark for each key indicator. He or she can do this by, for example, having various experts within the industry concerned make a valuation for each key indicator. This will enable the controller to fill the model with relevant information, from which he or she can then ultimately quantitatively analyse the company’s overall performance, and the Open Access JSSM  Does Human Resource Management Help a Company’s Financial Operating Result? 281 HRM performance in particular, in the manner described by us in this article. Based on this analysis, the controller can advise the management of the company concerned as to which specific operational and HRM aspects must be given attention to, so that the company will be an ex- cellent performer in the end. It should be clear that, after such an analysis, the client must be consulted to determine the right strategy for boosting the effectiveness criteria and the related key indicators responsible for insufficient performance up to the right level. If, for example, an unfavourable ratio between personnel costs and gross profit (profit before taxes) appears to be a major cause of an insufficient re- turn, the reasons for these high or excessive personnel costs will have to specifically be analysed further. For instance, the company in question may be utilising an assessment system which is not appropriate for this type of company. An industry which is sensitive to market fluctuations may, for example, have an assessment sys- tem which is rigid and inflationary and which is linked to a fixed remuneration system, in which too many ‘good’ evaluations drive up wages each year while the market does not afford much latitude for sufficient turnover growth. In such a case, implementing flexible remunera- tion for the commercial jobs may provide a solution. In another situation, if the number of days of receivables outstanding is too high, this may lead the company con- cerned to underperform. It must then be examined whether collection training for administrators can help lower this score, so that the company’s profitability in- creases. In short, the model offers enough insight into per- formance to be able to pinpoint, together with the board, the particular company’s weaknesses and to provide this board with a well-founded recommendation concerning the action to be taken. In these discussions, maintaining a clear idea of the bottom-line objectives of the organisa- tion in question is always critical. 13. Concluding Remarks At the beginning of this article, it is said that there is a general assumption within the HRM literature that a positive relationship exists between HRM and corporate performance. It seems obvious that there is a relationship between HRM and performance, just as there is a rela- tionship between financial management and performance or between logistical management and performance. Up to now, however, an empirically testable theoretical mo- del to measure this relationship was lacking. It is only with such a model that HRM’s role in the overall opera- tions can be clarified, with the premise that HRM is one of the tools of management and not the pre-eminent tool for improving company performance. As is true for other management tools, HRM can have both positive and negative impacts on company performance. HRM should therefore not just be celebrated as a management tool, which seems to occur as a matter of course especially in the American literature [8-10,14], but can best be “sim- ply” measured and then be assessed as to its quality within its own particular corporate context. This is the only way for HRM and personnel managers to get an idea of the HRM areas they must pay attention to, if they want to be able at all to make a favourable contribution to their companies’ bottom-line objectives. The questions we pose at the start, to wit: “is the per- formance of HRM/PM measurable and can it be assessed quantitatively and are we capable of developing a practi- cal tool enabling controllers to furnish their clients with useful advice in practice concerning the HRM policy to be followed?” now can be answered with a “yes”. REFERENCES [1] G. R. A. de Jong, “Effectief Personeelsmanagement, Een Interventiestrategie,” 2nd Edition, Deventer, Kluwer, 1988. [2] A. Th. Leijten, “Stimulerend Personeelsmanagement, Een Interventiestrategie,” Dissertation, Universiteit Twente, 1991. [3] J. Leget, “Personeelbeleid en Succes van Organisaties. Resultaatgericht Human Resource Management in Ne- derland,” Kluwer, Deventer, 1997. [4] J. Paauwe, “HRM and Performance: The Linkage be- tween Resources and Institutional Context. Unique Ap- proaches in Order to Achieve Competitive Advantage,” Discussion, BathUniversity, 1996. [5] R. C. H. van Otterlo, “De Invloed van Personeels Man- agement op de Prestatie van ondernemingen. Een The- oretisch-Empirisch Onderzoek Naar de Mate van Succes van Personeels Management in Traditionele Bedrijven Binnen de Profit-Sector,” Dissertation, Vrije Universiteit, Amsterdam, 1999. [6] G. R. A. de Jong, “Effectief Personeelsmangement. Een interventiestrategie,” 2nd edition, Kluwer, Deventer, 1988. [7] A. Th. Leijten, “Stimulerend Personeelsmanagement. Een Effectiviteitsdiagnose,”Tilburg University, Dissertation, Amsterdam, 1991. [8] J. B. Arthur, “The Effects of Human Resource Systems on Manufacturing Performance and Turn-Over,” The Academy of Management Journal, Vol. 37, No. 3, 1994, pp. 670-687. [9] M. A. Huselid, “The Impact of Human Resource Manage- ment Practices on Turnover, Productivity, and Corporate Financial Performance,” Academy of Management Jour- nal, Vol. 38, No. 3, 1995, pp. 635-672. [10] D. E. Guest, “Human Resource Management and Per- formance: A Review and Research Agenda,” The Inter- national Journal of Human Resource Management, Vol. 8, No. 3-6, 1997, pp. 263-276. [11] R. C. H. van Otterlo, “De Invloed van Personeels- Open Access JSSM  Does Human Resource Management Help a Company’s Financial Operating Result? Open Access JSSM 282 management op de Prestatie van Onderne-Mingen. Een Theoretisch-Empirisch Onderzoek Naar de Mate van Succes van Personeelsmanagement in Traditionele Bed- rijven Binnen de Profit-Sector,” Dissertation, Vrije Uni- versiteit, Amsterdam, 1999. [12] R. C. H. van Otterlo, “De Invloed van Personeels- management op de Prestatie van Onderne-Mingen. Een Theoretisch-Empirisch Onderzoek Naar de Mate van Succes van Personeelsmanagement in Traditionele Bed- rijven Binnen de Profit-Sector,” Dissertation, Vrije Uni- versiteit, Amsterdam, 1999, pp. 115-116. [13] P. R. Baarda, C. P. M. Kouwenhoven and J. A. Werk- hoven, “Kenenstuurgetallen voor Personeelsmanagement. Cijfers Voor Diagnose en Besturing,” Kluwer, Deventer, 1994, p. 52. [14] A. S. Tsui and L. R. Gomez-Mejia, “Evaluating Human Resource Effectiveness,” In: L. Dyer, Ed., Human Re- source Management Evolving Roles and Responsibilities, The Bureau of National Affairs, Washington DC, 1988, pp. 187-227. [15] W. Mastenbroek, “Verandermanagement. Sturen op Ve- rantwoordelijkheid. Resultaatverbetering Door Meer Zel- forganisatie én Betere Sturing. Organisatievernieuwing als Relatie-Management. Bestuurlijke Civilisatie en Ged- rags-Verandering,” Holland Business Publications, Heem- stede, 1997. |