An Early Warning Model with Technical Indicators: The Case of Ise (Istanbul Stock Exchange)
180
00
10
ˆ
ˆ
H
H
A t-test was accomplished: 0
stat
ˆ
ˆ
tS
By the fulfillment of the condition tstat < ttable the H0
hypothesis is not rejected and the stability of the esti-
mated parameter values of the regarded 32 shares was
confirmed.
The estimated parameter values and stability test de-
termined for the selected 32 shares are in the appendix.
The results displays that the change of the number of
collections do not cause statistic change of the estimated
parameter values.
5. Conclusions
In summary, we can say that during the derivative of NSI
E: NSI C takes the value (−1) assumes that it is smaller
as it is; NSI C takes the value (0) if it lies between; NSI
C takes the value (+1) if it is larger as it is.
For all technical indicators with the computation of the
variables one day lagged, values are used. The conclu-
sion values of 250 shares are raised for the calculations
of the technical indicators. The technical indicators as the
argument were used for the determination of the parame-
ter values, and thereby altogether 250 models are set up.
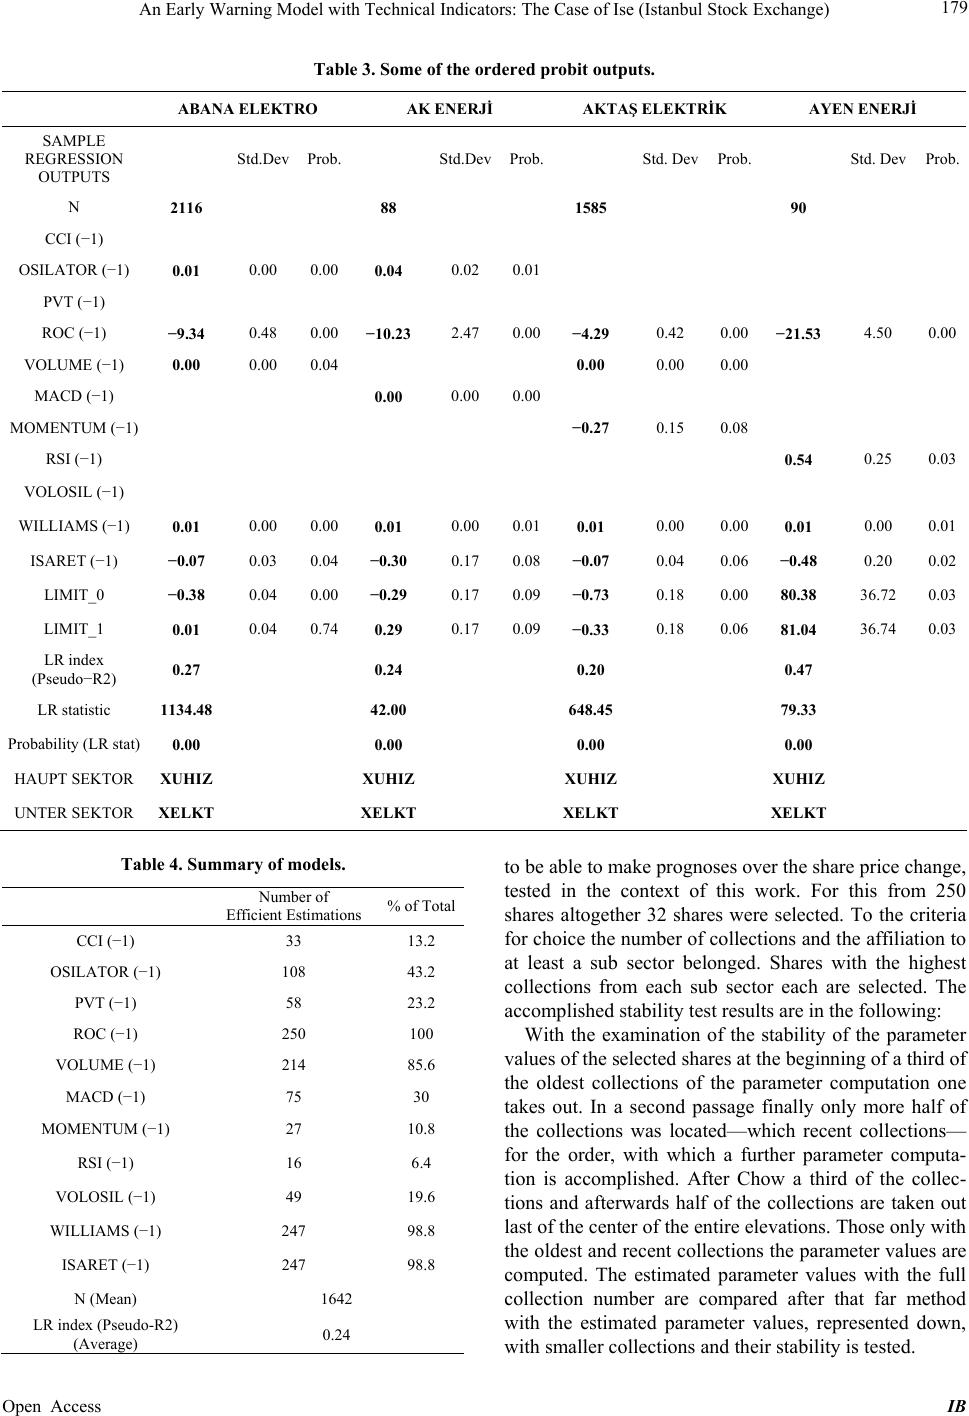
It participated interesting that the estimated parameter
values of the 250 shares were close. The CCI variable for
33 models, the OSILATOR variable for 108 models, the
PVT variable for 58 models, the ROC variable for all
models, the volume variable for 214 models, the MACD
variable for 75 models, the moment around variable for
27 models, the RSI variable for 16 models, the volume
OS IL variable for 49 models, the WILLIAMS variable
for 247 models and the NSI (−1) variable for 247 models
are efficient.
With those models, in which the technical indicators
represent the arguments, Turkcell, Anadolu Efes and
Ayen Enerji had extreme parameter values. Since the
number of collections is very small with these shares,
one can meet the acceptance that iterated parameter val-
ues are not reached.
5.1. Model Prognoses
With above the 32 shares select for the stability test of
the estimated parameter values, prognoses become for
one period of three months (10 October to 24 January
2007) accomplished. With these prognoses, the “NSI R”
(NSI calculated) of values is determined and derived
from these the “NSI E” (NSI estimated). The derived
“NSI E” of values is compared afterwards with the “NSI
R” (NSI real) values.
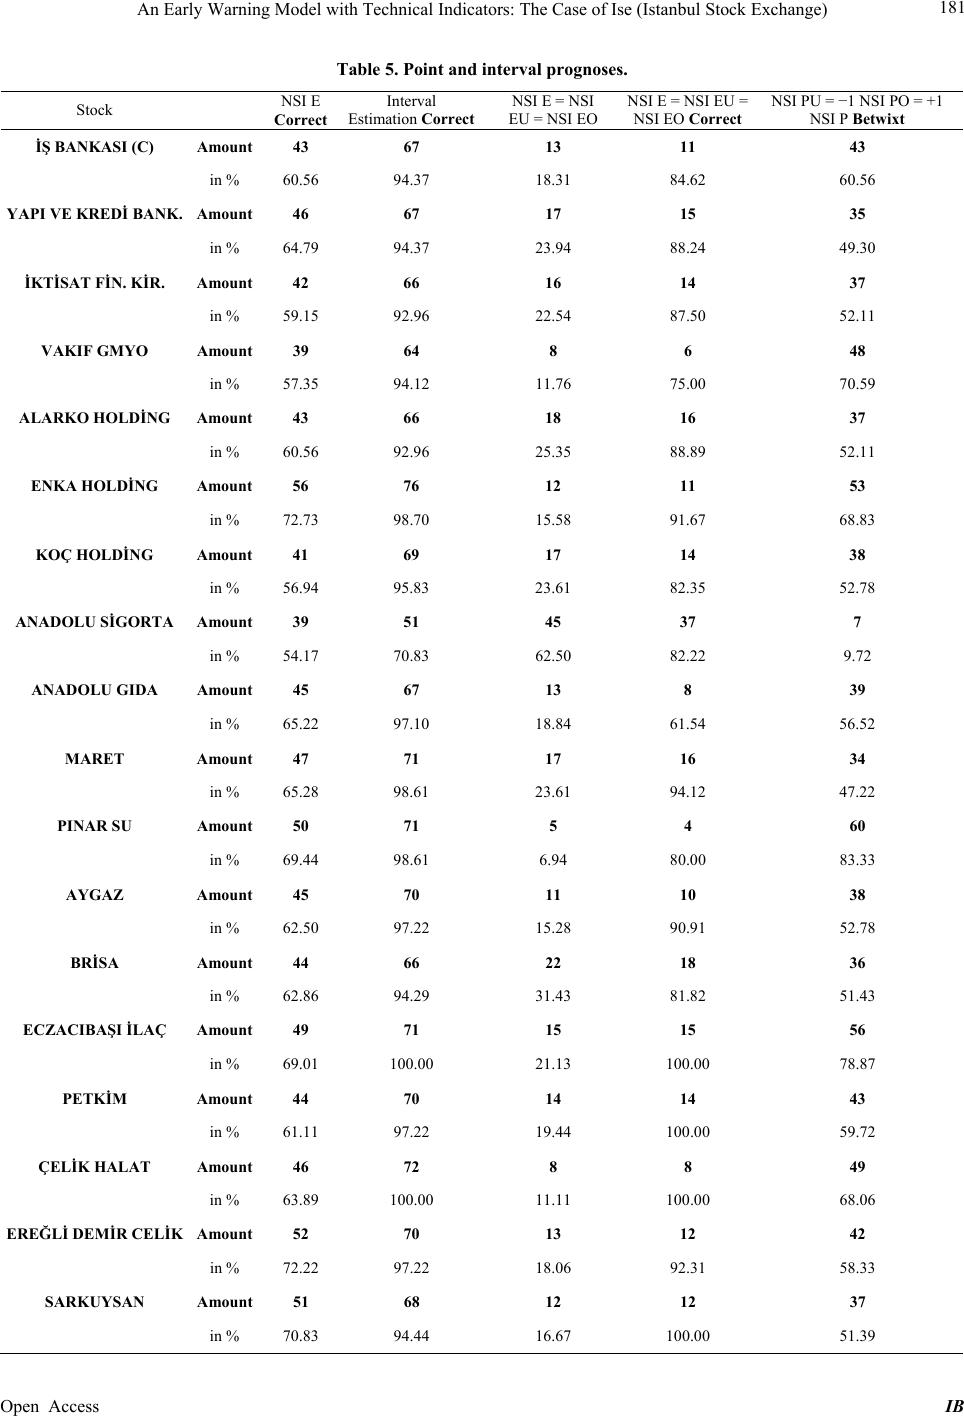
Point prognoses and interval prognoses are accom-
plished. In the context of the point prognosis, the values
of “NSI C” were determined with the Limit_0 and
Limit_1 being compared and “NSI E” derives from it.
“NSI C” was under Limit_0 to “NSI P” on (−1) and was
then specified. With the “NSI C” between Limit_0 and
Limit_1, “NSI E” is specified on (0) with a “NSI C” over
Limit_1 on (+1). After derivative of “NSI E”, it is com-
pared with “NSI R” and prognosis accuracy is deter-
mined. In the case of the point, prognoses resulted is
prognosis accuracy between 54 to 72 percent.
For the execution of the interval prognoses, addition-
ally the “NSI still becomes CU” value (NSI calculated
lower one limit) and “the NSI CO” value (NSI calculated
upper one border) is determined. With the help of these
two limit values, during the derivative of the “NSI E”,
the “NSI of EU” values (NSI prognosticated lower ones
limit) and “NSI of EO” values (NSI prognosticated upper
one border) are derived. It was checked whether the “NSI
R”-value is within these two values (between “NSI EU”
and “NSI PO”). With the regarded 32 models (ever a
model per share), “NSI R” is observed within these in-
terval values with a frequency from 70 to 96 percent.
The intervals (“NSI EU” and “NSI EO”) failed some-
times very closely and again very broadly. With very
close intervals (ex.: “NSI EU” = +1 and “NSI EO” = +1).
“NSI E” can speak with the interval borders of safe prog-
noses with the agreement of the point prognosis. On the
other side the interval borders far apart (“NSI EU” = −1
and “NSI EO” = +1) cannot be made safe statements
about the point prognosis “NSI E”. The reason for the far
interval borders lies in the high standard deviation and
the Limit_0 and Limit_1 values, for which again as in-
fluence of external factors is lying far apart, speculation
behavior is responsible.
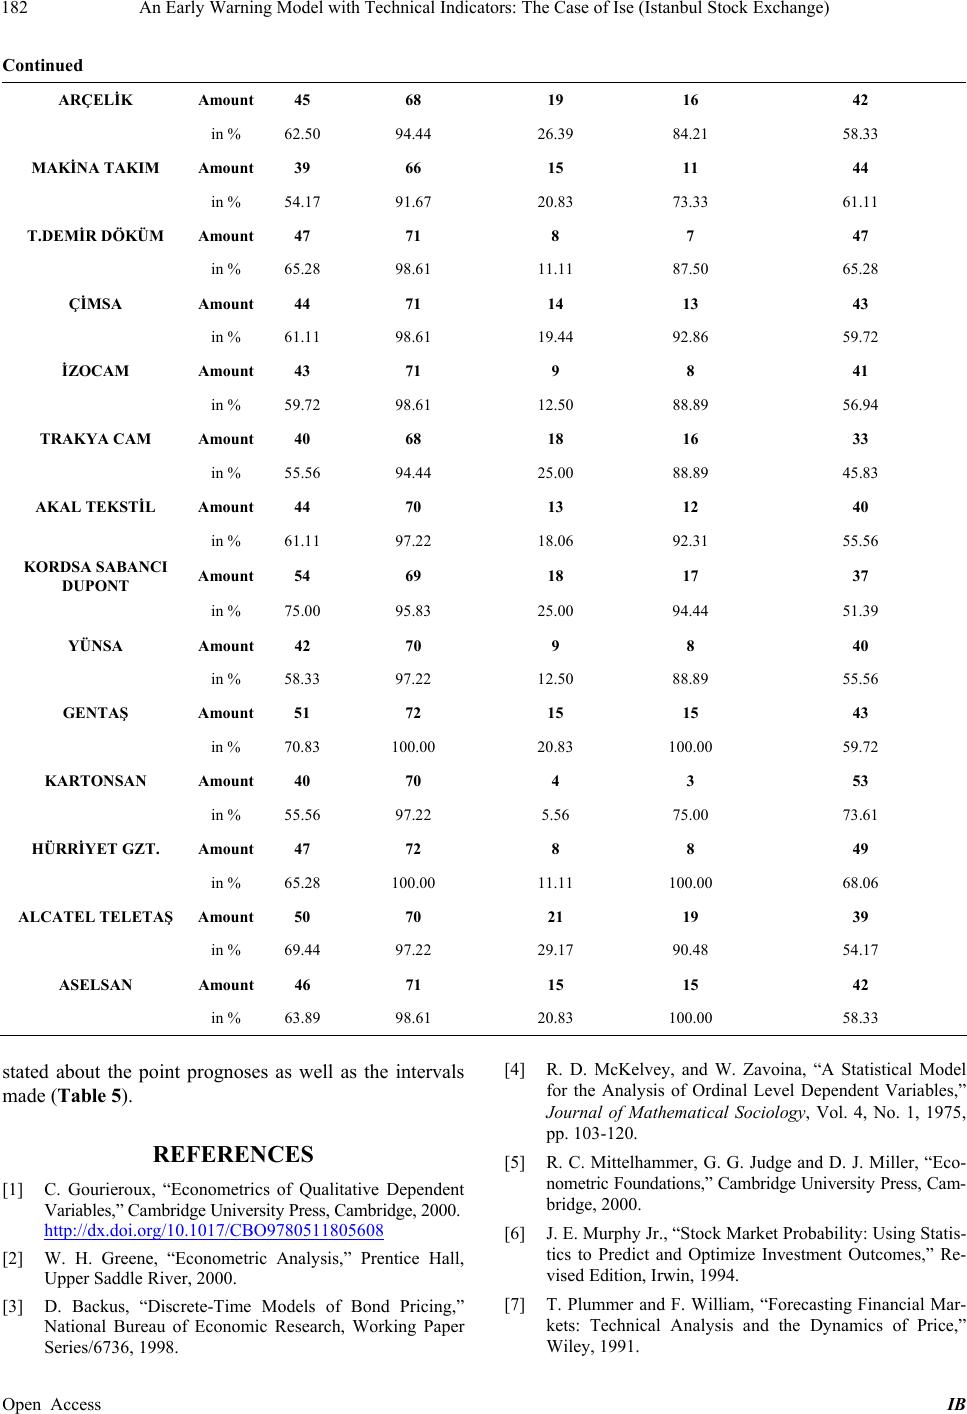
With the regarded 32 shares, one could observe the in-
terval width of “NSI EU” within the observed period of 3
months = −1 to “NSI EO” = +1 between 9 percent and 83
percent, an average value of 57.4 percent for 32 shares
results. “NSI EU” = +1 to “NSI EO” = +1 was observed
with the 32 shares within the period by 3 months with a
frequency from 5.5 to 62.5 percent, and resulted in an
average value of 20.1 percent. When agreeing the “NSI
E”, “NSI EU” and “NSI EO” value an agreement with
“NSI R” which is determined between 61 and 100 per-
cent, i.e. with an average value of 89 percent.
In principle, one can say that with all securities with
18 (= 0.201 * 0.89) percent of probability safe prognoses
can be accomplished. In summary, we can say that one
with 63 percent of correct point prognoses altogether
with approx. 57 percent of all prognoses about no safe pro-
gnoses to talk can lie apart, and there the interval borders
far and with approx. 18 percent about safe prognoses to
tal can lie apart. 25 percent of the remaining can be k
Open Access IB