Paper Menu >>
Journal Menu >>
 iBusiness, 2013, 5, 167-172 Published Online December 2013 (http://www.scirp.org/journal/ib) http://dx.doi.org/10.4236/ib.2013.54021 Open Access IB 167 Research on Routing Optimization of Regional Logistics Based on Gravity Model: A Case of Blue and Yellow Zones* Haiqing Hu, Yang Li Shandong Yingcai University, Jinan, China. Email: huhqkelly@163.com, cnjnly@163.com Received November 4th, 2013; revised November 20th, 2013; accepted December 5th, 2013 Copyright © 2013 Haiqing Hu, Yang Li. This is an open access article distributed under the Creative Commons Attribution License, which permits unrestricted use, distribution, and reproduction in any medium, provided the original work is properly cited. ABSTRACT The structure is the basic attribute of everything. The structure of logistics network is composed of logistics nodes and logistics routes, however the logistics cost mainly happens on the function the logistics route undertakes. So logistics routing optimization is the key to reduce logistics cost. As logistics is the hygiene factor of regional economic devel- opment, this article studied on logistics routing optimization by applying the demand of the regional economic devel- opment as a starting point, using the spatial interaction theory, building a method of the regional logistics link optimiza- tion based on the gravity model, and taking blue and yellow zones as the background to illustrate the rationality and feasibility of this method. Keywords: Gravity Model; Routing Optimization; Blue and Yellow Economic Zones; Logistics Network 1. Introduction Logistics is the hygiene factor of social and economic development, so the regional logistics must meet the de- mand of the regional economic development. As a basic economic activity, logistics is also one of industries con- stituting the regional economy. Seen in this light, the logistics of the regional economic development is not only a hygiene factor, but also an incentive factor of the regional economic development. So first of all, logistics should be set as the security condition of the regional economic development and secondly it can be an indus- try as a key support in the area with logistics advantages. Structure is the basic attribute of everything. Accord- ing to the system science, it is relatively stable contact way of the inhere nt manifestations of organization al pro- cedures and temporal relationship between the various elements within the system. Logistics network structure is the basic problem of the logistics network. It is com- posed of logistics nodes and logistics routes. Logistics nodes assume the function of logistics pauses while lo- gistics routes assume the function of logistics spatial transference, logistics activities of transport and delivery carried out on the routing distribution, and transportation costs account for a majority of logistics costs, so the lo- gistics routing optimization is the key to reduce logistics costs [1]. Based on the logic above, this article proposed ideas and methods of optimizing logistics routes by using the spatial interaction theory and demonstrated the prac- ticality and feasibility of this method through analyzing the case of logistics routing optimization of blue and yel- low zones. 2. Theoretical Basis Regional logistics should be able to meet the needs of regional economic development at first based on the rela- tionship between regional logistics and regional economy. Region involves a number of economies, the spatial in- teraction theory is a basic theory of explaining economic spatial linkage between economies, it mainly studies on locating potential energy, regional polarization and dif- fusion mechanism, spatial interaction model as well as the change and effect of factor flow. This theory can be used to explain whether the association exists, associa- tion strength and how to associate relevance between cities, between city and region , between regions, in addi- tion the influence and influencing factors of the associa- tion strength and association way in the spatial system. *Supported by Shandong Province, College of Humanities and Social Science Research Program (No. J13WG58) and Zhejiang Provincial N atural Science Foundation (No. 13YJC630221). The gravity model is a mathe matical expression of the  Research on Routing Optimization of Regional Logistics Based on Gravity Model: A Case of Blue and Yellow Zones 168 spatial interaction theory. Gravitational interaction be- tween cities is a key element of the gravity model. The urban flow is the economic activity generated by connec- tion outside and the intensity of the urban flow is used to measure the connection of city from the outside world. The intensity of urban flow refers to the energy generated by urban extroverted function (agglomeration and radia- tion) and the number of mutual influence relations be- tween cities. In this paper, we adopted the urban flow intensity to represent th e force between single city an d its adjacent city. Specific formula is: F NE (1) F means the intensity of urban flow, N means the city functional benefit, it is the actual impact generated by unit extroverted function among cities, E means urban extroverted function, it is composed of economic activity generated by the city contacting with the outside world. Considering the representation of indicators and data availability, this paper adopts the practitioners engage in export-oriented economic activity as indicators of the amount of urban functions. It is represented by the loca- tion quotient engaging in export-oriented economic ac- tivity. Specific formula is: 1, 2,,;1, 2,, ij i ij j GG Lqin jm GG (2) If , city department j do not have external function, ; If city department do have external function, because the allocation propor- tion of practitioners exceed the national allocation pro- portion, it can provide services outside the city area. Thus, the extern al fun ction of city department can be expressed as: 1 ij Lq ij Ei 01 ij Lq ij ij ijiji j EGGGG (3) So the total amount of extroverted function of m de- partments in city is: ii E 1 m i j E i j E (4) The function efficiency of city can be expressed by GDP per capit a: i i NGDPGi (5) So the intensity of urban flow of city is: i iii iii (6) FNE GDPGE Defining the distance is another key factor of the grav- ity model, under the condition of market economy, the distance has alienated to the combination concept of monetary cost and time cost .Therefore, distance can be expressed as [2]: 1 n ijij ij ij i d cT (7) Including means the th way of transportation between and ; ij i i ij means the weight of the ith way of transportation between and ; ij means the monetary cost of the th way of transportation be- tween and ; ij means the time cost the th way of transportation between and . i j jc i i i ijT 3. Study Design The general idea about routing optimization of regional logistics can be summarized as: The regional logistics routing optimization should be based on the logistics demand volume, according to the logistics demand vol- ume, we can determine the regional logistics demand, then determine the supply ability of regional logistics route in light of the road traffic conditions. In the end, optimization recommendations can be put forward based on the matching of demand and supply situation of logis- tics route. 3.1. Logistics Demand Analysis Regional logistics demand should include two parts, the first is to grasp the current logistics demand, and the second is the logistics demand forecast for the future. Considering the regional logistics demand is in order to meet the needs of the development of regional economy at first. When it comes to intra-region or inter-city, its logistics flow in a certain degree can represent the strength of the association between cities or within re- gion, and the gravity model which belongs to the spatial interaction theory can reflect the strength of the associa- tion between cities or within region in order to measure the correlation between cities in th e region. Then we can use the industrial structure analysis method (location quotient) to study the leading industry of the cities in the area, according to the leading industry to determine the main city logistics functional requirements, finally, ana- lyzing the relation between the city industry cooperation to determine the city logistics demand at present, also in the future by setting high degree of correlation city as the object. 3.2. Investigation of Logistics Supply To conduct a full in vestigation of the city logistics supply situation in the region, the investigation content includes the current logistics infrastructure supplies and the plans for the future supplies. Current supply situ ation is mainly to analyze the overview of the main logistics corridor in the region and to analyze main logistics nodes. Logistics activities of the logistics nodes are mainly concentrated in the logistics park, and the logistics node should be Open Access IB  Research on Routing Optimization of Regional Logistics Based on Gravity Model: A Case of Blue and Yellow Zones 169 highlighted in the general situation of logistics park. The future supplies mainly based on the planning of regional and intra-regional city logistics. 3.3. Optimizing Opinion Intra-regional correlation close ties to the city industry, the logistics route supply present situation and the future plan is the basis of the regional logistics routing optimi- zation. Experience measures suitable for this region can be refined to put forward the regional logistics routing optimization and improvement opinions through analyz- ing and summarizing the su ccessful cases of international and domestic regional logistics. 4. Application Example In 2009 the state council approved the Yellow River delta efficient ecological economic zone development planning, and in 2011 approved the Shandong peninsula blue economic zone planning. So far the integrative de- velopment of the blue and yellow economic zone has become the focus of atten tion from all walks of life and it is also inseparable from the support of modern logistics. So this article took the optimization of the blue and yel- low zone logistics route to illustrate the ap plicability and feasibility of the gravity model. 4.1. Urban Gravity of the Blue and Yellow Economic Zone Using export-oriented department practitioner index to measure the intensity of urban flow, urban flow intensity of Dongying ,Weifang, Dezhou is higher, it shows that the export-oriented economy of the city, in addition to meeting the local needs and more surplus capacity to undertake external demand. There are four main modes of transportation between cities, highway transportation, railway transportation, water transport and air transport, and yellow blue eco- nomic zone is in the range of road transportation eco- nomic mileage, a large number of transportation is as- sumed by road transportation in the blue yellow eco- nomic zone, so this article selected the inter-city highway as basis of the main distance. Distance formula can be expressed as: ijij ij dcT (8) Including ij means the monetary cost of the road transportation between i and j; ij means the time cost of the highway transportation between i and j. cT Monetary cost of highway transportation was ex- pressed by road freight rate, nearly three months of 218 times transport data was collected through the transporta- tion enterprise investigation. Statistics showed that the road freight rate floating 0.20 yuan/ton.Km nearby, of which 71% of freight rate fluctuating in the rang e of 0.20 + 0.02, the concentration degree of the freight rate was higher. The remaining 29% of the data was divided into two groups, higher than the average and below average. It was found that the higher freight rate in respects of transportation distance had significant difference with the rest of the sample. Then, regression analysis was carried out on the transportation by using the transportation dis- tance and vehicle type, etc. It was found that the coeffi- cient of determination was as high as 95%, after the variable vehicle type added, the coefficient of determina- tion increased less than 1%. So it can be seen that trans- portation cost mainly related to the transportation dis- tance. According to the results of regression, the mone- tary cost of transportation is a function of the transport distance and it can be concretely expressed as: 0.98 ij ij cD (9) Including ij means the actual physical distance between i and j. D This article used baidu map (http://map.baidu.com) to query the distance between i and j. As the distance was the main factors influencing the transport monetary cost, this article chose the shortest distance between i and j as query condition s when qu erying on th e b aidu map, in th is way, the distance between city and city in the blue yel- low economic zone can be obtained. At the same time, Shandong province traffic tourist map published by map publishing house of Shandong provin ce in 2012 was also collected to verify the accuracy. Vehicle running speed is important influence factor in the vehicle operating costs, and the main factor influenc- ing the vehicle running speed is road technology level. As the roads with different technology levels have dif- ferent requirements in the design of surface evenness, Slope, turning radius, the higher the road technical level is, the faster the speed is, and the greater the impact made on operating costs [3]. According to the road technology standard of the People’s Republic of China (JTGB01~ 2003) which regulated different types of road driving speed, and combined with the blue economic zone road actual situation, set the highway 120 km/h, state road 80 km/h, provincial highway and the following road 60 km/h. The freight time (unit: h) between cities can be calculated by Using the various road mileage between each city. According to the gravitational model of cities, setting urban flow intensity as the interaction force of each city, using the distance between the cities, computing th e mu- tual attraction between cities, Table 1 can be obtained. From Table 1, the gravity of cities in the blue an d yel- low economic zone in total to Weifang, Dongying, De- zhou, Qingdao, Rizhao, Yantai, Zibo, Weihai in a de- Open Access IB 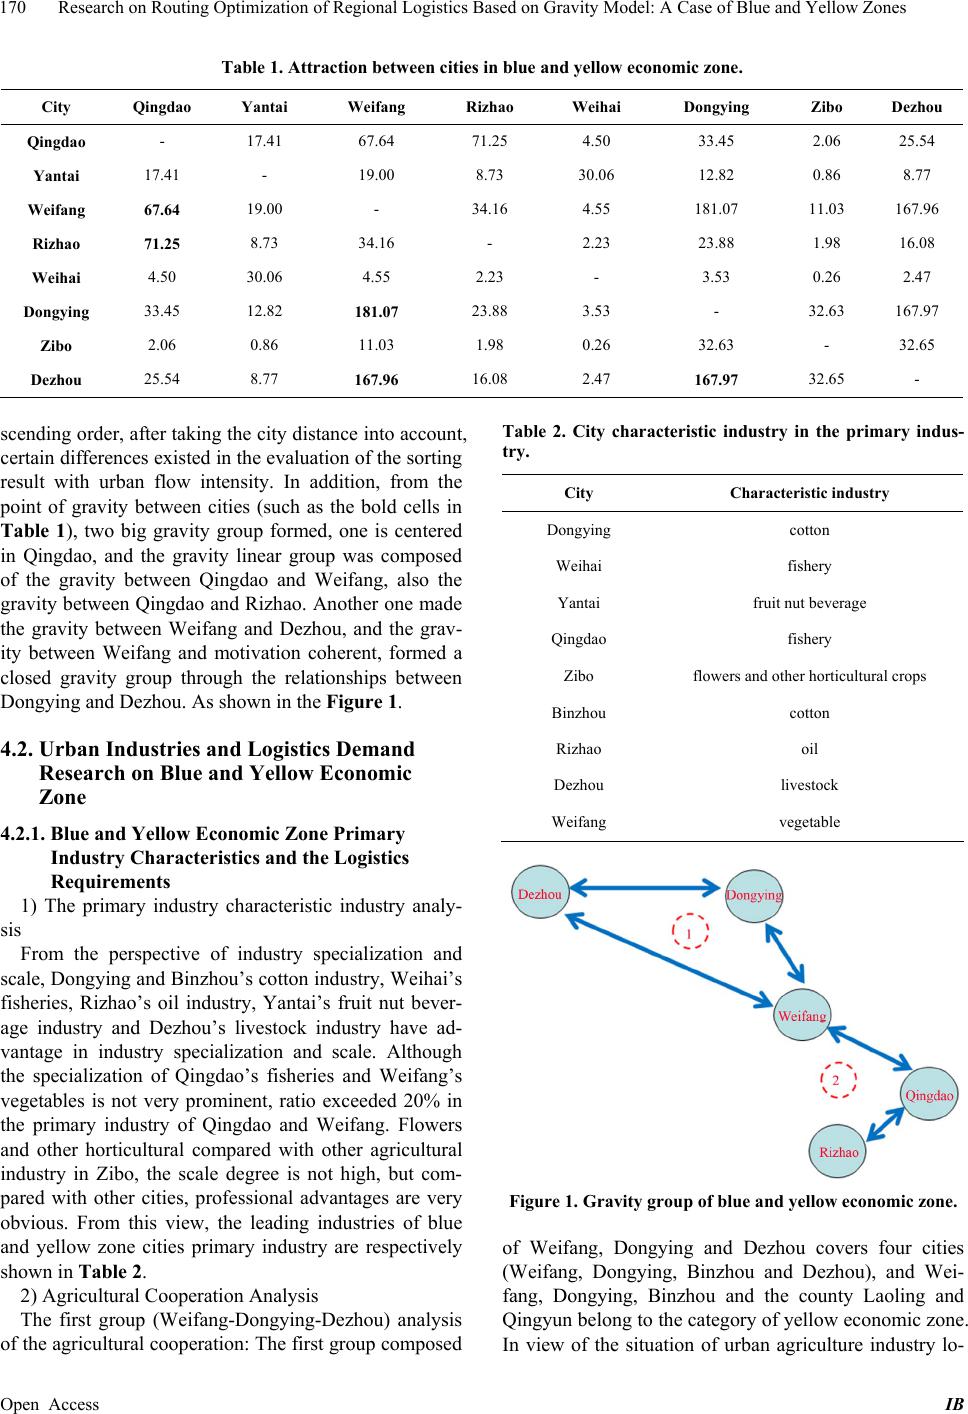 Research on Routing Optimization of Regional Logistics Based on Gravity Model: A Case of Blue and Yellow Zones Open Access IB 170 Table 1. Attraction betwee n citie s in blue and yellow ec onomic zone. City Qingdao Yantai Weifang Rizhao Weihai Dongying Zibo Dezhou Qingdao - 17.41 67.64 71.25 4.50 33.45 2.06 25.54 Yantai 17.41 - 19.00 8.73 30.06 12.82 0.86 8.77 Weifang 67.64 19.00 - 34.16 4.55 181.07 11.03 167.96 Rizhao 71.25 8.73 34.16 - 2.23 23.88 1.98 16.08 Weihai 4.50 30.06 4.55 2.23 - 3.53 0.26 2.47 Dongying 33.45 12.82 181.07 23.88 3.53 - 32.63 167.97 Zibo 2.06 0.86 11.03 1.98 0.26 32.63 - 32.65 Dezhou 25.54 8.77 167.96 16.08 2.47 167.97 32.65 - Table 2. City characteristic industry in the primary indus- try. scending order, after taking the city distance in to account, certain differences existed in the evaluation of th e sorting result with urban flow intensity. In addition, from the point of gravity between cities (such as the bold cells in Table 1), two big gravity group formed, one is centered in Qingdao, and the gravity linear group was composed of the gravity between Qingdao and Weifang, also the gravity between Qingdao and Rizhao. Another one made the gravity between Weifang and Dezhou, and the grav- ity between Weifang and motivation coherent, formed a closed gravity group through the relationships between Dongying and Dezhou. As shown in th e Figure 1. City Characteristic industry Dongying cotton Weihai fishery Yantai fruit nut beverage Qingdao fishery Zibo flowers and other horticultural crops Binzhou cotton Rizhao oil Dezhou livestock Weifang vegetable 4.2. Urban Industries and Logistics Demand Research on Blue and Yellow Economic Zone 4.2.1. Blue and Yellow Economic Zone Primary Industry Characteristics and the Logistics Requirements 1) The primary industry characteristic industry analy- sis From the perspective of industry specialization and scale, Dongying and Bin zhou’s cotton industry, W eihai’s fisheries, Rizhao’s oil industry, Yantai’s fruit nut bever- age industry and Dezhou’s livestock industry have ad- vantage in industry specialization and scale. Although the specialization of Qingdao’s fisheries and Weifang’s vegetables is not very prominent, ratio exceeded 20% in the primary industry of Qingdao and Weifang. Flowers and other horticultural compared with other agricultural industry in Zibo, the scale degree is not high, but com- pared with other cities, professional advantages are very obvious. From this view, the leading industries of blue and yellow zone cities primary industry are respectively shown in Table 2. Figure 1. Gravity group of blue and yellow economic zone. of Weifang, Dongying and Dezhou covers four cities (Weifang, Dongying, Binzhou and Dezhou), and Wei- fang, Dongying, Binzhou and the county Laoling and Qingyun belong to the categor y of yello w econo mic zone. In view of the situation of urban agriculture industry lo- 2) Agricultural Cooperation Analysis The first group (Weifang-Dongying-Dezhou) analysis of the agricultural coo peration: The first grou p composed  Research on Routing Optimization of Regional Logistics Based on Gravity Model: A Case of Blue and Yellow Zones 171 4.2.2. Blue and Yellow Economic Zone Secondary Industry Characteristics and the Logistics Requirements cation quotient in the blue and yellow economic zone, the agricultural characteristic industries of Weifang, Dong- ying, Dezhou respectively are vegetables, cotton and livestock. Vegetables and livestock sales link needs the support of cold chain logistics, so it is suggested that the cold chain logistics system should be established and developed in the first group (It was consistent with the cold storage needs of ecological animal husbandry in- dustry chain which was in mentioned the Dongying 12th five-year plan). Dongying and Binzhou’s cotton advan- tage is obvious, and the Binzhou’s textile industry loca- tion quotient is higher in its secondary industry, so the integrative development of the primary industry and the secondary industry can be formed in the first group. Bin- zhou’s textile industry sho uld be set as the core to estab- lished industrial chain (cotton production—cotton proc- essing—sale). The additional value of cotton can be im- proved through the textile and the industry chain can ex- tend forwards and backwards. Backward can develop bam- boo forest planting (Binzhou Haosheng Group which has industrial base), forwar d can develop clothing industry. 1) The secondary industry characteristic industry ana- lysis The proportion of each city industry in its secondary industry shows the scale of the industry in this city, and the location quotient of the blue and yellow zone shows the degree of specialization of the industry in the region. Considering the double perspective (Specialization and scale), the main industries of cities are shown in Table 3. 2) The secondary industry grou p cooperation analysis The first group (Weifang-Dongying-Dezhou) analysis of the industry cooperation: As the degree of specializa- tion of agricultural products and byproducts process is only 0.8, it is necessary to continue improving its indus- try specialization, but th e specialization of indu stry needs a process. Therefore, in the short term, the agricultural products and byproducts processing of Binzhou need to rely on the processing capacity of Weifang. The second group (Weif ang-Qingdao-Rizhao) analysis of the industry cooperation: The black metal smelting and rolling processing industry of Rizhao have not yet been forming, the location quotient is only 0.1 which cannot be self-sufficient. And the location quotient of ferrous metals mining and dressing is 11.91. When it comes to Zibo, the location quo tient is 6.02, but the lo ca- tion quotient of the Black metal smelting and rolling processing is 2.61. Compared with Zibo, the scale of The second group (Weif ang-Qingdao-Rizhao) analysis of the agricultural cooperation: Qingdao characteristic agriculture is fishery, it also needs the support of cold chain logistics to achieve high additional value. So the cold-chain logistics network of the first group is sup- posed to extend to Qingdao, Form cold chain logistics network system that its core logistics node is Weifang, main logistics nodes are Qingdao, Weifang and Dezhou. Table 3. Main industries of cities in sec o ndary industry . City Both specialty and strength Qingdao Developmental Emphases: transportation equipment manufacturing industry; Electrical machinery and equipment manufacturing industrialization Yantai Communication equipment, computers and other electronic devices; Non-ferrous metal smelting and rolling processing industry; Developing the nonferrous me t al industry acquisi tion and processing of industrialization Weihai Manufacture of Rubber, artware and other Manufacturing, Agricultural Products and Byproducts Processing; Promoting instrumentation of cultural and educational sporting goods manufacturing and cultural office machinery manufacturing scale Rizhao Ferrous Metals Mining and Dressing, Wood processing and products, Metal Products,Electric heat production and supply industry, agricultural Products and Byproducts Processing; Improving the degree of specialization food processing Dongying Petroleum and Natural Gas Extraction, Oil processing and coking and nuclear fuel processing industry, Chemical raw materials and chemical manufacturing, Rubber pr oducts Develo pmental Emphases: Oil production, processing and deep processing industry industrialization Weifang Developmental Emphases: Industrialization of agricultural food processing Binzhou Textiles, leather and fur feathers (fine hair) and manufacturing Developmental Emphases: Textile industry industrialization Zibo Chemical raw materials and chemical manufacturing; Nonmetal Mineral Products; Oil processing and coking and nuclear fuel processing industry Dezhou Extractive industry Open Access IB  Research on Routing Optimization of Regional Logistics Based on Gravity Model: A Case of Blue and Yellow Zones 172 In addition, except the logistics routes, the logistics node construction should be given full consideration to the group cooperation between two cities, Such as the demand for cold chain logistics network in the group cooperation of primary industry, and the demand for railway logistics network in the group cooperation of secondary industry. Rizhao black metal smelting and rolling processing in- dustry is too small and metal logistics co st is higher, so it is the best way to process nearby. As Rizhao is close to Qingdao, it is the lowest logistics cost strategy to choose Qingdao as downstream processing site of the black metal smelting and rolling processing. From the perspective of the cooperation of the first group and second group, it is prominent in the first group that Binzhou cooperates with Weifang and it is the same with the cooperation of Qingdao and Rizhao in the sec- ond group. Because the distance between Binzhou and Weifang is close as well as Qingdao and Rizhao, which is in the range of road transportation economic mileage, it is necessary to strengthen the road transport capacity between Binzhou and Weifang, Rizhao and Qingdao. 4.3. The Present Situation of Logistics Supply of Blue and Yellow Economic Zone The distance between cities in the main group which be- long to the blue yellow economic zone can be obtained, as shown in Table 4. 4.4. Blue and Yellow Zone Logistics Route Optimization Suggestions From the distance between main group cities of blue and yellow economic zone, the highway distance between two cities is shorter than the national road distance, ex- cept Weifang-Binzhou and Weifang-Dezhou. The condi- tions and the highest speed limit of highway are superior to the national road, so it can largely save transportation time when choosing highway. The highway between Weifang and Dezhou is equivalent to going around the two edges of the rectangle of which diagonal is Weifang to Dezhou, so the distance is longer than the national road. Therefore, we suggest establishing transverse con- nection between G3 Jingtai highway and G25 Changshen highway. So it can not only shorten the distance from Dezhou to Weifang, but also benefit the three cities (Binzhou, Jinan and Dezhou). Table 4. The distance contrast between mainly contrast group cities of blue yellow zone. City-City Highway distance National road distance Weifang-Dongying 106 km 127 km Dongying-Dezhou 219 km 254 km Dezhou-Weifang 233 km 179 km Binzhou-Weifang 180 km 134 km Rizhao-Qingdao 134 km 188 km Qingdao-Weifang 135 km 179 km 5. The Conclusion and Prospect This article studies on logistics routing optimization by applying the demand of the regional economic develop- ment as the starting point, using spatial interactio n theory, building a method of a regional logistics link optimiza- tion based on the gravity model, and taking blue and yel- low zones as the background to illustrate the rationality and feasibility of this method. Supporting the economic development is only one of the goals of the regional lo- gistics development. As an independent economic activ- ity, logistics is also one component of regional econo- mies. Therefore the research on logistics route optimiza- tion whose goal is the future logistics industry develop- ment has certain theoretical value and practical signifi- cance. REFERENCES [1] H.-Q. Hu, J. Zhou and Z.-Z. Zheng, “Blue and Yellow Zone Logistics Network Nodes Optimization Research,” Shandong Social Science, Vol. 2, 2013, pp. 116-119. [2] W. Zhou, B. Zhang, B. Zhang, et al., “Spatial Relation- ship between Dual-core Cities Based on Gravity Model— A Case of Chengdu and Chongqing City,” Resource De- velopment & Market, Vol. 26, No. 11, 2010, pp. 82-85. [3] W.-L. Lan, S.-P. Tan and Y.-Q. Ma, “An Analysis of Costs of Roads in different Grades,” Journal of Wuhan Institute of Shipbuilding Technology, Vol. 6, 2009, pp. 74-78. Open Access IB |