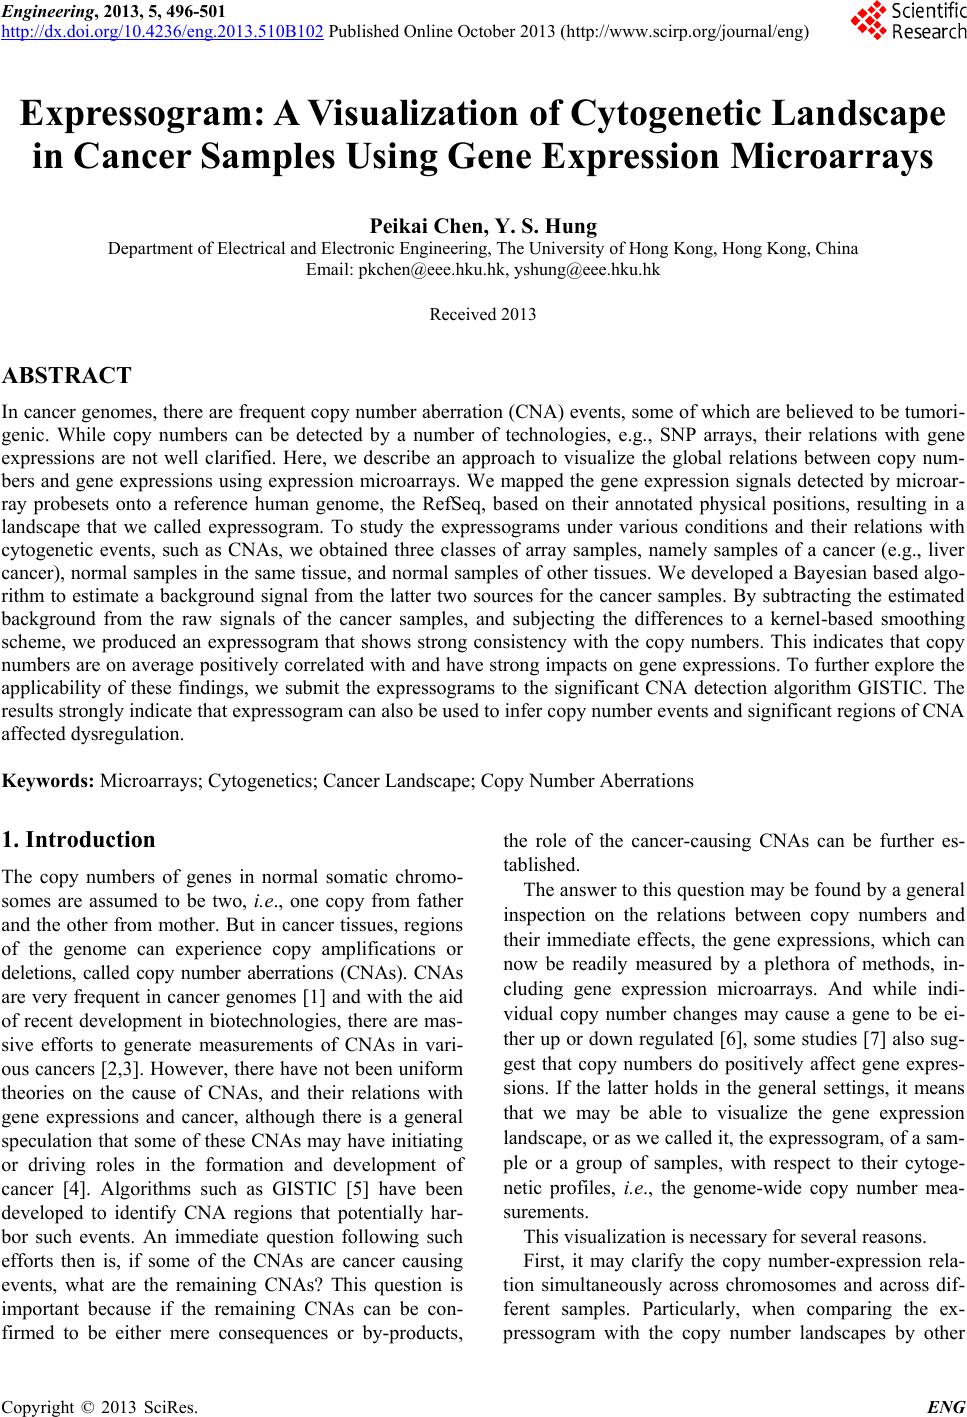
 Engineering, 2013, 5, 496-501 http://dx.doi.org/10.4236/eng.2013.510B102 Published Online October 2013 (http://www.scirp.org/journal/eng) Copyright © 2013 SciRes. ENG Expres sogram: A Visualization of Cytogenetic Lan dscape in Cancer Samples Using Gene Expression Microarrays Peikai Chen, Y. S. Hung Department of Electrical and Electronic Engineering, The University of Hong Kong, Hong Kong, China Email: pkchen@eee.hku.hk, yshung@eee.hku.hk Received 2013 ABSTRACT In cancer genomes, there are frequent copy number aberration (CNA) events, some of which are believed to be tumori- genic. While copy numbers can be detected by a number of technologies, e.g., SNP arrays, their relations with gene expressions are not well clarified. Here, we describe an approach to visualize the global relations between copy num- bers and gene expressions using expression microarrays. We mapped the gene expression signals detected by microar- ray probesets onto a reference human genome, the RefSeq, based on their annotated physical positions, resulting in a landscape that we called expressogram. To study the expressograms under various conditions and their relations with cytogenetic events, such as CNAs, we obtained three classes of array samples, namely samples of a cancer (e.g., liver cancer), normal samples in the same tissue, and normal samples of other tissues. We developed a Bayesian based algo- rithm to estimate a background signal from the latter two sources for the cancer samples. By subtracting the estimated background from the raw signals of the cancer samples, and subjecting the differences to a kernel-based smoothing scheme, we produced an expressogram that shows strong consistency with the copy numbers. This indicates that copy numbers are on average positively correlated with and have strong impacts on gene expressions. To further explore the applicability of these findings, we submit the expressograms to the significant CNA detection algorithm GISTIC. The results strongly indicate that expressogram can also be used to infer copy number events and significant regions of CNA affected dysregulation. Keywords: Microarrays; Cytogenetics; Cancer Landscape; Copy Number Aberrations 1. Introduction The copy numbers of genes in normal somatic chromo- somes are assumed to be two, i.e., one copy from father and the other from mother. But in cancer tissues, regions of the genome can experience copy amplifications or deletions, called copy number aberrations (CNAs). CNAs are very frequent in cancer genomes [1] and with th e aid of recent development in biotechnologies, there are mas- sive efforts to generate measurements of CNAs in vari- ous cancers [2,3]. However, there have not been uniform theories on the cause of CNAs, and their relations with gene expressions and cancer, although there is a general speculation that some of these CNAs may have initiating or driving roles in the formation and development of cancer [4]. Algorithms such as GISTIC [5] have been developed to identify CNA regions that potentially har- bor such events. An immediate question following such efforts then is, if some of the CNAs are cancer causing events, what are the remaining CNAs? This question is important because if the remaining CNAs can be con- firmed to be either mere consequences or by-products, the role of the cancer-causing CNAs can be further es- tablished. The answer to this question may be found by a general inspection on the relations between copy numbers and their immediate effects, the gene expressions, which can now be readily measured by a plethora of methods, in- cluding gene expression microarrays. And while indi- vidual copy number changes may cause a gene to be ei- ther up or down regulated [6], some studies [7] also sug- gest that copy numbers do positively affect gene expres- sions. If the latter holds in the general settings, it means that we may be able to visualize the gene expression landscape, or as we called it, the expressogram, of a sam- ple or a group of samples, with respect to their cytoge- netic profiles, i.e., the genome-wide copy number mea- surements. This visualization is necessary for several reasons. First, it may clarify the copy number-expression rela- tion simultaneously across chromosomes and across dif- ferent samples. Particularly, when comparing the ex- pressogram with the copy number landscapes by other  P. K. CHEN, Y. S. HUNG Copyright © 2013 SciRes. ENG means of measurements, such as SNP arrays, it can re- veal how copy numbers are generally affecting gene ex- pressions. Second, it may help pinpoint regions of disease-spe- cific dysregulation. CNAs typically harbor tens, hun- dreds, or even thousands of genes, all of which have uniform copy number states. But the impact on individu- al genes, and regions may be different. For example, some genes may be physically adjacent and share some regulating mechanisms [8], as a result of which, these genes tend to show region specific co-regulations. These co-regulations by CNAs are oft e n important in cancer. Third, conventional CNA inferences are mostly based on array CGH, SNP arrays, etc., but some of them suffer from errors [9]. This visualization technique may serve as an independent source of measurements to help con- firm that certain regions are real CNAs. Fourth, instead of relying on SNP arrays for detection of recurrent CNAs for search of potential cancer causing events, the expressogram signals may be used to search for genes that are directly and recurrently affected by copy numbers. These genes may be more directly related to the cancer process than those candidates uncovered by SNP arrays. Toward this end, we propose an approach to visualize gene expression landscapes, i.e., expressograms, in can- cers using gene expression microarrays. The following sections discuss the algorithms and results of this ap- proach. 2. Algorithm A direct approach to visualize the expressions in the chromosome positions is to plot the signals against the cytogenetic positions, such as in the work by [10], which may be subject to huge noises and biases. Here, we use a two-stage approach. First, a background landscape is estimated. Second, the estimated background is sub- tracted from the diseased samples under study, before the difference signals are subjected to a smooth ing filter . 2.1. Background Estimation Three gene expression datasets are obtained, n amely, the dataset of samples under study, often from a disease (e.g., certain cancers), denoted as ; the dataset of normal samples in the same tissue as the studying disease, de- noted as ; and the dataset of samples in other normal tissues that will be used as the prior information for the background, denoted as . For a probeset , where is the total number of probesets, the objective is to derive a probe- set-specific background signal from and . The reason for using both and is that very often, the dataset is small and not really normal because these normal references are often tissues donated by patients dying of other reasons, or patients having other conditions in the s ame tissue. As a result, they may not truly reflect the normal conditions in the studying tissue in the population. Also, most of the genes are sup- posed to be tissue-non-specific, i.e., their expressions are not tissue-dependent. Therefore, expressions of a gene (or probeset) from other tissues may be used as a prior information for a Bayesian inference of the true back- ground signal . Specifically, let the mean signal from be , the Bayesian estimate of the true signal is given by : (|) ()(|)/() jjj jjj PssPs PssPs= (2.1) where is a constant. Assuming a Gaussian dis- tributions for , the maximum a posteriori (MAP) [11] estimation of , , is given by: 2 2 (/) ˆ1 (/) j jjj jjj Ns sN µ σσ σσ + =+ (2.2) where is the number of samples in , is the mean of probeset in , and is the standard deviati o n of p r obeset in and that in . From Equation (2.2), it can be seen that if and/or are small, the estimate will largely depend on the population estimate, i.e., . This is favorable be- cause often the normal samples are noisy and have small sample sizes. Hopefully, this will produce a more stable estimate of the background signals. 2.2. Subtracting Background and Smoothing the Signals Suppose there are samples in . Given a sample , and the expression for the -th probeset in , , the difference sign al with bac kground sub trac ted is given by: . Assuming that the probesets were pre-arranged in such an order that , f and represent the signals of two physically adjacent probesets in the human genome (e.g., NCBI RefSeq Build 37.1), then the series represents the gene expression landsca pe of , referred to as the expressogram. A major issue in visualizing is that on top of cytogenetic factors, it is also regulated by a large number of other unknown factors, producing tremendous high- frequency noises across the chromosomal positions. Fur- ther, the background estimate from previous step is non- samp l e-specific (i.e., all disease samples use the same background signals), which may produce some bias for the studying samples. To reduce these effects, a kernel- based smoothing scheme using the Nadaraya-Watson algorithm [12] is adopted. Specifically, given a cytoge- netic position , the smoothed difference signal is given by:  P. K. CHEN, Y. S. HUNG Copyright © 2013 SciRes. ENG () () hj j j xhj j K Xxf fKX x ∈ ∈ − =− ∑ ∑ (2.3) where h is a kernel function with window width , is the set of points in the window and is the chromosomal position for . Wh en the Gau ss i a n k er n el is used, is the variance parameter . Equation (2.3) acts as a low-pass 1-D spatial filter and the resulting sig - nal represents a location-dependent signal that may also reflect the impact of cytogenetic factors on ex- pressions. 3. Results To test the proposed visualization method, we applied it to microarray measurements of a cancer, hepatocellular carcinoma (HCC), i.e., liver cancer. The dataset con- sists of 90 samples by Chiang et al. [13] (GE O accession number: GSE9829), and the dataset consists of 58 normal liver microarray expressions collected from six studies (GEO accession numbers: GSE7117, GSE14951, GSE19665, GSE23343, GSE29722 and GSE14668). To construct the dataset for estimating the prior values of the probesets, we select a number of tissues, including normal colorectal (GSE9254), pancreatic (GSE22780), thyroid (GSE3678), ovarian (GSE14407), endometrial (GSE7305), breast (GSE30010), skin (GSE14905) and esophageal (GSE26886) tissues from the controls of dis- ease studies, or from the samples of non-disease studies. Most of these selected tissues are made up of epithelial cells and share some common attributes with hepatocytes (liver cells), such as fast proliferation rates. Finally, 100 samples were collected for . All samples in the th ree datasets are from a single microarray platform, i.e., the Human Genome U133 Plus 2.0 array (Affymetrix, CA), and are pre-processed with the RMA algorithm [14]. Another 90 SNP arrays matching with the 90 expres- sions arrays in were also downloaded from GSE9829 and preprocessed with the Affymetrix CNAT algorithm [15]. Figure 1A shows the copy number landscape of these 90 samples. The background signal estimation and smoothing were conducted as described in the previous section. To see that the two-step approach does result in better distinc- tion between the expression probesets with CNAs and those without, we use the SNP array inferred copy num- bers as ground truth, and assigned each expression pro- beset a copy number state based on the measurement of its closest SNP probeset. The three solid-line distribu- tions (from left, in blue, black and red) in Figure 2 re- present the difference signals of genes having copy number losses, normal (i.e., two) and gains, respectively. It can be seen that there is a clear positive correlation between the SNP-inferred copy number states and the gene expressions. The background signals used in these curves are based on , i.e., without Bayesian updates. The three dashed-line curves in the same colors corres- pond to the difference signals undergoing the Bayesian procedure using Equation (2.2). It is very clear that the Bayesian step greatly increases the contrast among dif- ference signals with different copy n umber st a t e s . We then used the difference signals obtained by Equa- tion (2.3) to produce an expressogram, i.e., a visualiza- tion of the landscape of gene expression by heatmap tools. Figure 1 B shows the result. It can be seen that there is a strong consistency between the copy number landscapes and the expressogram in Figure 1. Next, we submitted the difference signals to GISTIC [5] (provided by genepattern.broadinstitute.org), a tool used in SNP arrays to identify recurrent CNAs, to find the recurrent up- or down-regulations. Figure 3 shows the result. Comparing the results in Figure s 3A and B, it can be seen that most of the features are very similar. This suggests that the expressogram can be used to pin- point regions of recurrent dysregulations that are caused by CNAs. 4. Conclusions In summary, we have described a novel visualization of gene expressions in the cancer genomes. We make use of extensive information, both from samples of normal tis- sue under study and those from other normal human tis- sues to predict the background signal before it is sub- tracted from the raw signal. The resulting difference signals are subjected to Kernel-based smoothing. The expresso- gram provides a wonderful visualization of gene expres- sion across the genome. This study is meaningful in sev- eral aspects. First, the expressogram clearly corresponds to the cy- togenetic changes, e.g., CNAs. This indicates that copy numbers of most genes do affect their expressions. But the effect is marginal, i.e., it becomes obvious only after the background signals are subtracted. And how some of these effects go on to produce cancer-driving conse- quences is yet to be determined. Second, the recurrent regions of gene expressions ar- rays are highly consistent with that from SNP arrays. This suggests that in cases where SNP arrays are not available, our method provides an alternative to generate the GISTIC landscape for identification of recurrent CNAs. Particularly, this method has advantage over the sample landscape by SNP arrays, as it directly shows the recurrence at the expression level, which is believed to have more biological importance. 5. Acknowledgements The work described in this paper is partially supported by  P. K. CHEN, Y. S. HUNG Copyright © 2013 SciRes. ENG Figure 1. The copy number landscape of hepatocellular carcinoma (HCC) by SNP arrays. (B) Expressogram of the same samples by our algorithm using gene expression microarrays. Color codes for (A): red, copy number gains; blue, copy num- ber losses. Color codes for (B): red, up-regulation; black or dark green, neutral; light green, down-regulation. In both (A) and (B), the horizontal axes represent the chromosomal positions and the vertical dashed lines represent chromosomal boundaries. Each row in both plots represents an HCC sample. (C) The raw difference signals (dots) and smoothed signals (green) of a specific example, B25. Also shown is the copy number profile of B25 by SNP array. Note the effects of CNAs on the raw and smoothed signals. 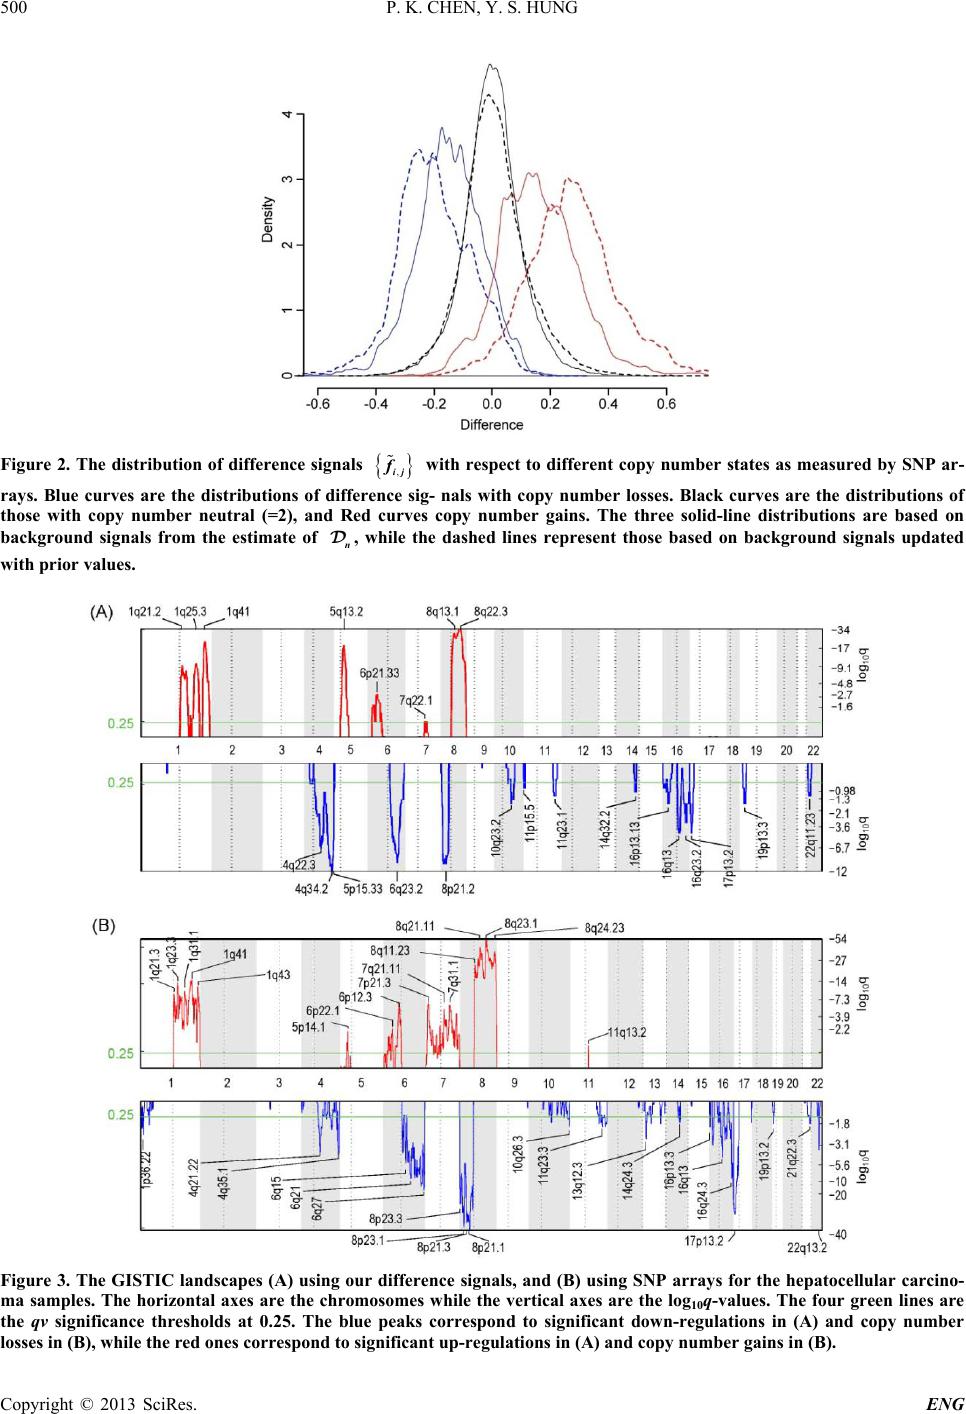 P. K. CHEN, Y. S. HUNG Copyright © 2013 SciRes. ENG Figure 2. The distribution of difference signals with respect to different copy number states as measured by SNP ar- rays. Blue curves are the distributions of difference sig- nals with copy number losses. Black curves are the distributions of those with copy number neutral (=2), and Red curves copy number gains. The three solid-line distributions are based on background signals from the estimate of , while the dashed lines represent those based on background signals updated with prior val ues. Figure 3. The GISTIC land scapes (A) using our difference signals, and (B) using SNP arrays for the hepatocellular carcino- ma samples. The horizontal axes are the chromosomes while the vertical axes are the log10q-values. The four green lines are the qv significance thresholds at 0.25. The blue peaks correspond to significant down-regulations in (A) and copy number losses in (B), while the red ones correspond to significant up-regulations in (A) and copy number gains in (B). 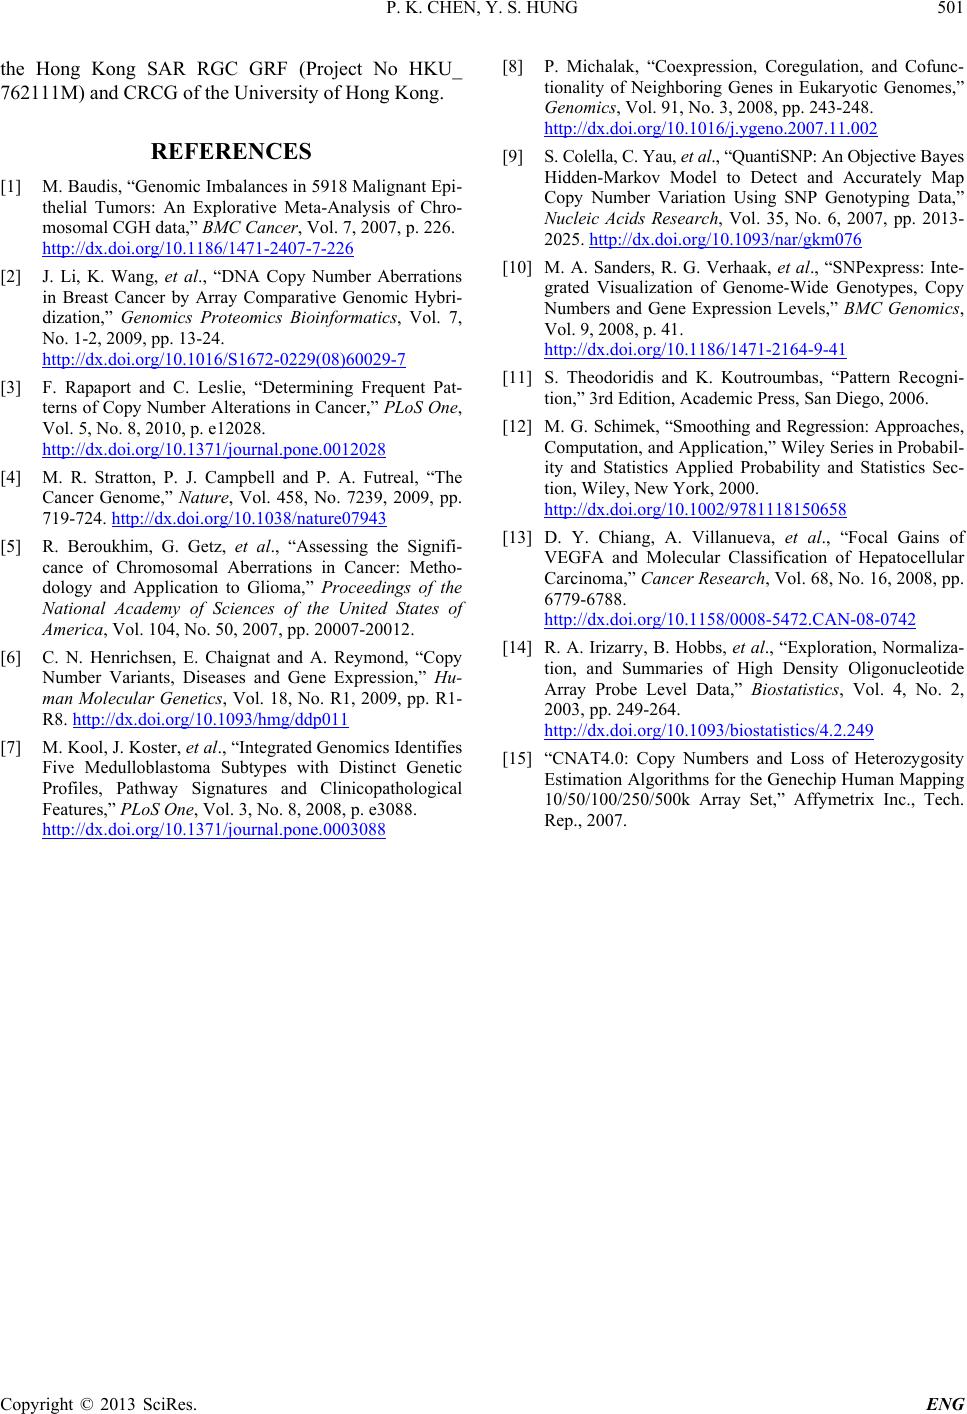 P. K. CHEN, Y. S. HUNG Copyright © 2013 SciRes. ENG the Hong Kong SAR RGC GRF (Project No HKU_ 762111M) and CRCG of the University of Hong Kong. REFERENCES [1] M. Baudis, “Genomic Imbalances in 5918 Malignant Epi- thelial Tumors: An Explorative Meta-Analysis of Chro- mosomal CGH data,” BMC Cancer, Vol. 7, 2007, p. 226. http://dx.doi.org/10.1186/1471-2407-7-226 [2] J. Li, K. Wang, et al., “DNA Copy Number Aberrations in Breast Cancer by Array Comparative Genomic Hybri- dization,” Genomics Proteomics Bioinformatics, Vol. 7, No. 1-2, 2009, pp. 13-24. http://dx.doi.org/10.1016/S1672-0229(08)60029-7 [3] F. Rapaport and C. Leslie, “Determining Frequent Pat- terns of Copy Number Alterations in Cancer,” PLoS One, Vol. 5, No. 8, 2010, p. e12028. http://dx.doi.org/10.1371/journal.pone.0012028 [4] M. R. Stratton, P. J. Campbell and P. A. Futreal, “The Cancer Genome,” Nature, Vol. 458, No. 7239, 2009, pp. 719-724. http://dx.doi.org/10.1038/nature07943 [5] R. Beroukhim, G. Getz, et al., “Assessing the Signifi- cance of Chromosomal Aberrations in Cancer: Metho- dology and Application to Glioma,” Proceedings of the National Academy of Sciences of the United States of America, Vol. 104, No. 50, 2007, pp. 20007-20012 . [6] C. N. Henrichsen, E. Chaignat and A. Reymond, “Copy Number Variants, Diseases and Gene Expression,” Hu- man Molecular Genetics, Vol. 18, No. R1, 2009, pp. R1- R8. http://dx.doi.org/10.1093/hmg/ddp011 [7] M. Kool, J. Koster, e t al ., “Integrated Genomics Identifies Five Medulloblastoma Subtypes with Distinct Genetic Profiles, Pathway Signatures and Clinicopathological Features,” PLoS One, Vol. 3, No. 8, 2008, p. e3088. http://dx.doi.org/10.1371/journal.pone.0003088 [8] P. Michalak, “Coexpression, Coregulation, and Cofunc- tionality of Neighboring Genes in Eukaryotic Genomes,” Genomics, Vol. 91, No. 3, 2008, pp. 243-248. http://dx.doi.org/10.1016/j.ygeno.2007.11.002 [9] S. Colella, C. Yau, et al., “QuantiSNP: An Objective Bayes Hidden-Markov Model to Detect and Accurately Map Copy Number Variation Using SNP Genotyping Data,” Nucleic Acids Research, Vol. 35, No. 6, 2007, pp. 2013- 2025. http://dx.doi.org/10.1093/nar/gkm076 [10] M. A. Sanders, R. G. Verhaak, et al., “SNPexpress: Inte- grated Visualization of Genome-Wide Genotypes, Copy Numbers and Gene Expression Levels,” BMC Genomics, Vol. 9, 2008, p. 41. http://dx.doi.org/10.1186/1471-2164-9-41 [11] S. Theodoridis and K. Koutroumbas, “Pattern Recogni- tion,” 3rd Edition, Academic Press , San Diego, 2006. [12] M. G. Schimek, “Smoothing and Regression: Approaches, Computation, and Application,” Wiley Series in Probabil- ity and Statistics Applied Probability and Statistics Sec- tion, Wiley, New York, 2000. http://dx.doi.org/10.1002/9781118150658 [13] D. Y. Chiang, A. Villanueva, et al., “Focal Gains of VEGFA and Molecular Classification of Hepatocellular Carcinoma,” Cancer Research, Vol. 68, No. 16, 2008, pp. 6779-6788. http://dx.doi.org/10.1158/0008-5472.CAN-08-0742 [14] R. A. Irizarry, B. Hobbs, e t al., “Exploration, Normaliza- tion, and Summaries of High Density Oligonucleotide Array Probe Level Data,” Biostatistics, Vol. 4, No. 2, 2003, pp. 249-264. http://dx.doi.org/10.1093/biostatistics/4.2.249 [15] “CNAT4.0: Copy Numbers and Loss of Heterozygosity Estimation Algorithms for the Genechip Human Mapping 10/50/100/250/500k Array Set,” Affymetrix Inc., Tech. Rep., 2007.
|