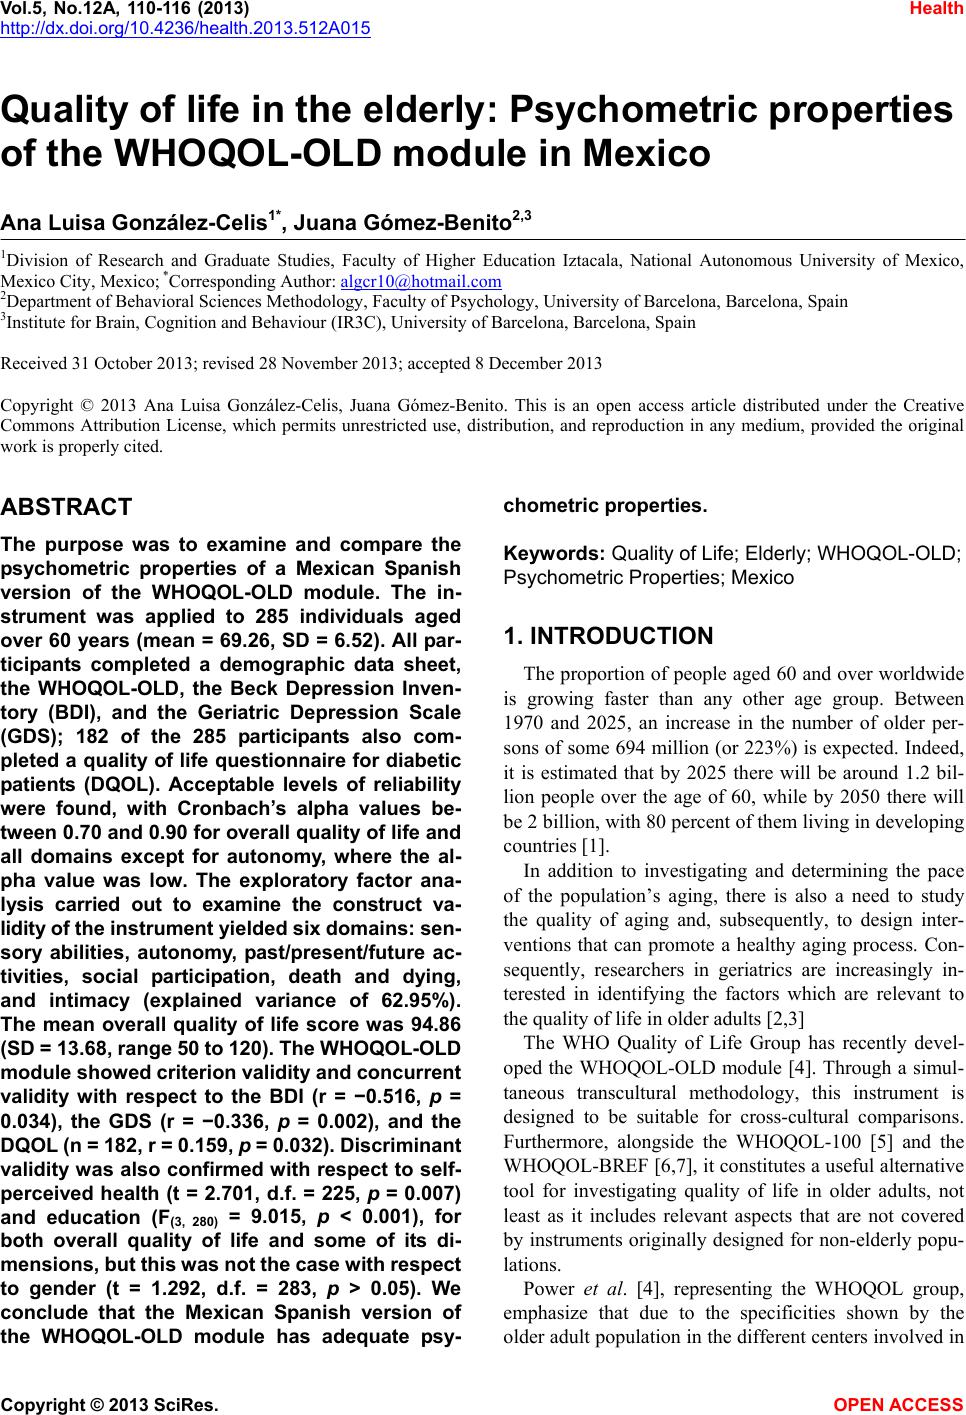
 Vol.5, No.12A, 110-116 (2013) Health http://dx.doi.org/10.4236/health.2013.512A015 Quality of life in the elderly: Psychometric properties of the WHOQOL-OLD module in Mexico Ana Luisa González-Celis1*, Juana Gómez-Benito2,3 1Division of Research and Graduate Studies, Faculty of Higher Education Iztacala, National Autonomous University of Mexico, Mexico City, Mexico; *Corresponding Author: algcr10@hotmail.com 2Department of Behavioral Sciences Methodology, Faculty of Psychology, University of Barcelona, Barcelona, Spain 3Institute for Brain, Cognition and Behaviour (IR3C), University of Barcelona, Barcelona, Spain Received 31 October 2013; revised 28 November 2013; accepted 8 December 2013 Copyright © 2013 Ana Luisa González-Celis, Juana Gómez-Benito. This is an open access article distributed under the Creative Commons Attribution License, which permits unrestricted use, distribution, and reproduction in any medium, provided the original work is properly cited. ABSTRACT The purpose was to examine and compare the psychometric properties of a Mexican Spanish version of the WHOQOL-OLD module. The in- strument was applied to 285 individuals aged over 60 years (mean = 69.26, SD = 6.52). All par- ticipants completed a demographic data sheet, the WHOQOL-OLD, the Beck Depression Inven- tory (BDI), and the Geriatric Depression Scale (GDS); 182 of the 285 participants also com- pleted a quality of life questionnaire for diabetic patients (DQOL). Acceptable levels of reliability were found, with Cronbach’s alpha values be- tween 0.70 and 0.90 for overall quality of life and all domains except for autonomy, where the al- pha value was low. The exploratory factor ana- lysis carried out to examine the construct va- lidity of the instrument yielded six domains: sen- sory abilities, autonomy, past/present/future ac- tivities, social participation, death and dying, and intimacy (explained variance of 62.95%). The mean overall quality of life score was 94.86 (SD = 13.68, range 50 to 120). The WHOQOL-OLD module showed criterion validity and concurrent validity with respect to the BDI (r = −0.516, p = 0.034), the GDS (r = −0.336, p = 0.002), and the DQOL (n = 182, r = 0.159, p = 0.032). Discriminant validity was also confirmed with respect to self- perceived health (t = 2.701, d.f. = 225, p = 0.007) and education (F(3, 280) = 9.015, p < 0.001), for both overall quality of life and some of its di- mensions, but this was not the case with respect to gender (t = 1.292, d.f. = 283, p > 0.05). We conclude that the Mexican Spanish version of the WHOQOL-OLD module has adequate psy- chometric properties. Keywords: Quality of Life; Elderly; WHOQOL-OLD; Psychometric Properties; Mexico 1. INTRODUCTION The proportion of people aged 60 and over worldwide is growing faster than any other age group. Between 1970 and 2025, an increase in the number of older per- sons of some 694 million (or 223%) is expected. Indeed, it is estimated that by 2025 there will be around 1.2 bil- lion people over the age of 60, while by 2050 there will be 2 billion, with 80 percent of them living in developing countries [1]. In addition to investigating and determining the pace of the population’s aging, there is also a need to study the quality of aging and, subsequently, to design inter- ventions that can promote a healthy aging process. Con- sequently, researchers in geriatrics are increasingly in- terested in identifying the factors which are relevant to the quality of life in older adults [2,3] The WHO Quality of Life Group has recently devel- oped the WHOQOL-OLD module [4]. Through a simul- taneous transcultural methodology, this instrument is designed to be suitable for cross-cultural comparisons. Furthermore, alongside the WHOQOL-100 [5] and the WHOQOL-BREF [6,7], it constitutes a useful alternative tool for investigating quality of life in older adults, not least as it includes relevant aspects that are not covered by instruments originally designed for non-elderly popu- lations. Power et al. [4], representing the WHOQOL group, emphasize that due to the specificities shown by the older adult population in the different centers involved in Copyright © 2013 SciRes. OPEN ACCESS 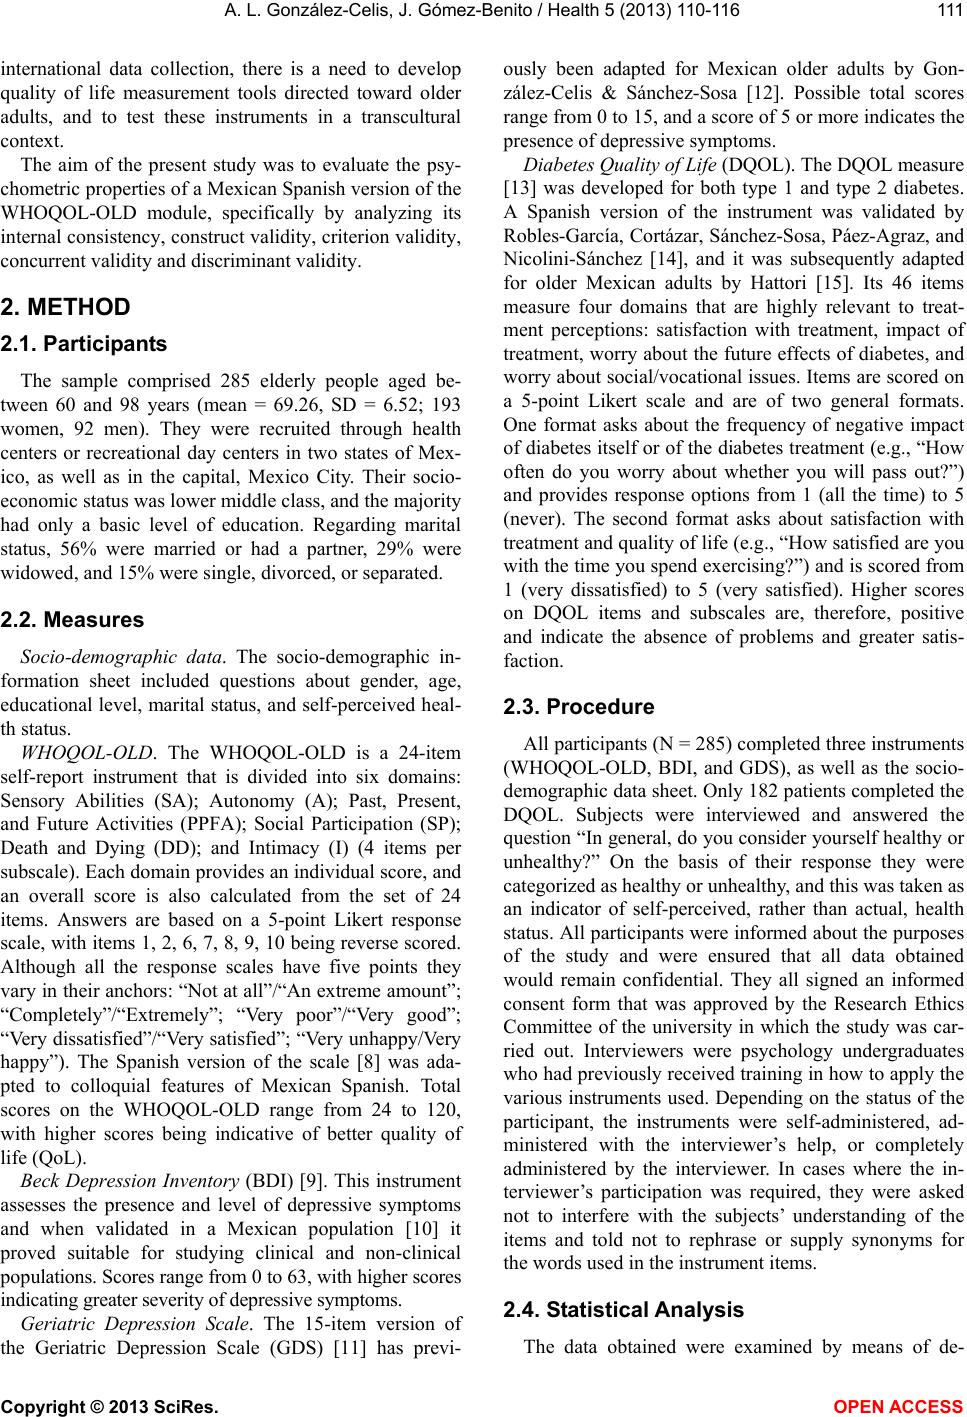 A. L. González-Celis, J. Gómez-Benito / Health 5 (2013) 110-116 111 international data collection, there is a need to develop quality of life measurement tools directed toward older adults, and to test these instruments in a transcultural context. The aim of the present study was to evaluate the psy- chometric properties of a Mexican Spanish version of the WHOQOL-OLD module, specifically by analyzing its internal consistency, construct validity, criterion validity, concurrent validity and discriminant validity. 2. METHOD 2.1. Participants The sample comprised 285 elderly people aged be- tween 60 and 98 years (mean = 69.26, SD = 6.52; 193 women, 92 men). They were recruited through health centers or recreational day centers in two states of Mex- ico, as well as in the capital, Mexico City. Their socio- economic status was lower middle class, and the majority had only a basic level of education. Regarding marital status, 56% were married or had a partner, 29% were widowed, and 15% were single, divorced, or separated. 2.2. Measures Socio-demographic data. The socio-demographic in- formation sheet included questions about gender, age, educational level, marital status, and self-perceived heal- th status. WHOQOL-OLD. The WHOQOL-OLD is a 24-item self-report instrument that is divided into six domains: Sensory Abilities (SA); Autonomy (A); Past, Present, and Future Activities (PPFA); Social Participation (SP); Death and Dying (DD); and Intimacy (I) (4 items per subscale). Each domain provides an individual score, and an overall score is also calculated from the set of 24 items. Answers are based on a 5-point Likert response scale, with items 1, 2, 6, 7, 8, 9, 10 being reverse scored. Although all the response scales have five points they vary in their anchors: “Not at all”/“An extreme amount”; “Completely”/“Extremely”; “Very poor”/“Very good”; “Very dissatisfied”/“Very satisfied”; “Very unhappy/Very happy”). The Spanish version of the scale [8] was ada- pted to colloquial features of Mexican Spanish. Total scores on the WHOQOL-OLD range from 24 to 120, with higher scores being indicative of better quality of life (QoL). Beck Depression Inventory (BDI) [9]. This instrument assesses the presence and level of depressive symptoms and when validated in a Mexican population [10] it proved suitable for studying clinical and non-clinical populations. Scores range from 0 to 63, with higher scores indicating greater severity of depressive symptoms. Geriatric Depression Scale. The 15-item version of the Geriatric Depression Scale (GDS) [11] has previ- ously been adapted for Mexican older adults by Gon- zález-Celis & Sánchez-Sosa [12]. Possible total scores range from 0 to 15, and a score of 5 or more indicates the presence of depressive symptoms. Diabetes Quality of Life (DQOL). The DQOL measure [13] was developed for both type 1 and type 2 diabetes. A Spanish version of the instrument was validated by Robles-García, Cortázar, Sánchez-Sosa, Páez-Agraz, and Nicolini-Sánchez [14], and it was subsequently adapted for older Mexican adults by Hattori [15]. Its 46 items measure four domains that are highly relevant to treat- ment perceptions: satisfaction with treatment, impact of treatment, worry about the future effects of diabetes, and worry about social/vocational issues. Items are scored on a 5-point Likert scale and are of two general formats. One format asks about the frequency of negative impact of diabetes itself or of the diabetes treatment (e.g., “How often do you worry about whether you will pass out?”) and provides response options from 1 (all the time) to 5 (never). The second format asks about satisfaction with treatment and quality of life (e.g., “How satisfied are you with the time you spend exercising?”) and is scored from 1 (very dissatisfied) to 5 (very satisfied). Higher scores on DQOL items and subscales are, therefore, positive and indicate the absence of problems and greater satis- faction. 2.3. Procedure All participants (N = 285) completed three instruments (WHOQOL-OLD, BDI, and GDS), as well as the socio- demographic data sheet. Only 182 patients completed the DQOL. Subjects were interviewed and answered the question “In general, do you consider yourself healthy or unhealthy?” On the basis of their response they were categorized as healthy or unhealthy, and this was taken as an indicator of self-perceived, rather than actual, health status. All participants were informed about the purposes of the study and were ensured that all data obtained would remain confidential. They all signed an informed consent form that was approved by the Research Ethics Committee of the university in which the study was car- ried out. Interviewers were psychology undergraduates who had previously received training in how to apply the various instruments used. Depending on the status of the participant, the instruments were self-administered, ad- ministered with the interviewer’s help, or completely administered by the interviewer. In cases where the in- terviewer’s participation was required, they were asked not to interfere with the subjects’ understanding of the items and told not to rephrase or supply synonyms for the words used in the instrument items. 2.4. Statistical Analysis The data obtained were examined by means of de- Copyright © 2013 SciRes. OPEN ACCESS 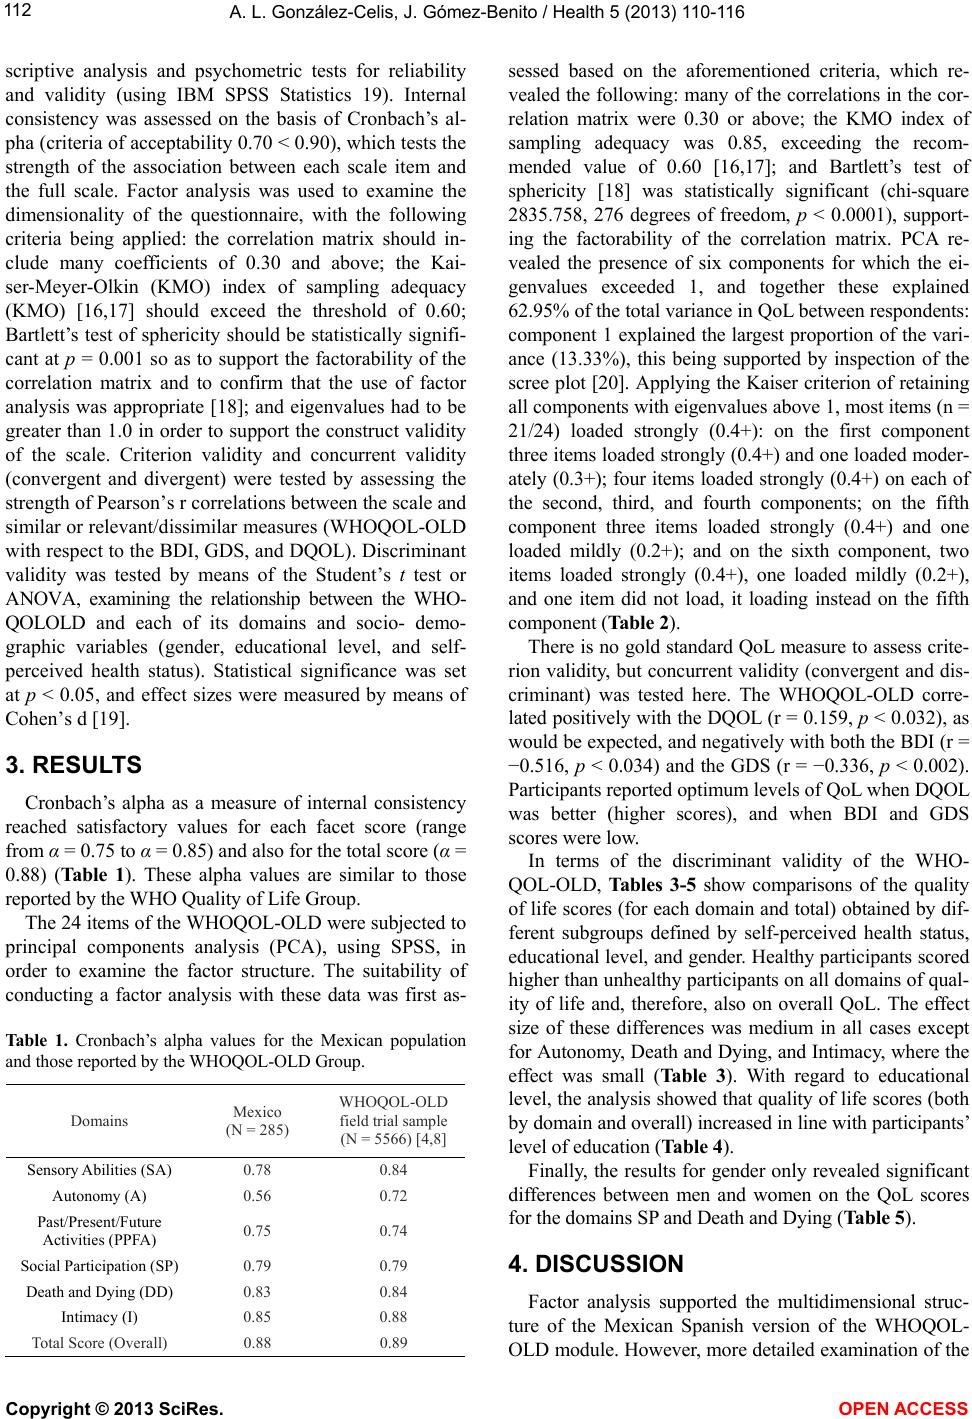 A. L. González-Celis, J. Gómez-Benito / Health 5 (2013) 110-116 112 scriptive analysis and psychometric tests for reliability and validity (using IBM SPSS Statistics 19). Internal consistency was assessed on the basis of Cronbach’s al- pha (criteria of acceptability 0.70 < 0.90), which tests the strength of the association between each scale item and the full scale. Factor analysis was used to examine the dimensionality of the questionnaire, with the following criteria being applied: the correlation matrix should in- clude many coefficients of 0.30 and above; the Kai- ser-Meyer-Olkin (KMO) index of sampling adequacy (KMO) [16,17] should exceed the threshold of 0.60; Bartlett’s test of sphericity should be statistically signifi- cant at p = 0.001 so as to support the factorability of the correlation matrix and to confirm that the use of factor analysis was appropriate [18]; and eigenvalues had to be greater than 1.0 in order to support the construct validity of the scale. Criterion validity and concurrent validity (convergent and divergent) were tested by assessing the strength of Pearson’s r correlations between the scale and similar or relevant/dissimilar measures (WHOQOL-OLD with respect to the BDI, GDS, and DQOL). Discriminant validity was tested by means of the Student’s t test or ANOVA, examining the relationship between the WHO- QOLOLD and each of its domains and socio- demo- graphic variables (gender, educational level, and self- perceived health status). Statistical significance was set at p < 0.05, and effect sizes were measured by means of Cohen’s d [19]. 3. RESULTS Cronbach’s alpha as a measure of internal consistency reached satisfactory values for each facet score (range from α = 0.75 to α = 0.85) and also for the total score (α = 0.88) (Table 1). These alpha values are similar to those reported by the WHO Quality of Life Group. The 24 items of the WHOQOL-OLD were subjected to principal components analysis (PCA), using SPSS, in order to examine the factor structure. The suitability of conducting a factor analysis with these data was first as- Table 1. Cronbach’s alpha values for the Mexican population and those reported by the WHOQOL-OLD Group. Domains Mexico (N = 285) WHOQOL-OLD field trial sample (N = 5566) [4,8] Sensory Abilities (SA) 0.78 0.84 Autonomy (A) 0.56 0.72 Past/Present/Future Activities (PPFA) 0.75 0.74 Social Participation (SP) 0.79 0.79 Death and Dying (DD) 0.83 0.84 Intimacy (I) 0.85 0.88 Total Score (Overall) 0.88 0.89 sessed based on the aforementioned criteria, which re- vealed the following: many of the correlations in the cor- relation matrix were 0.30 or above; the KMO index of sampling adequacy was 0.85, exceeding the recom- mended value of 0.60 [16,17]; and Bartlett’s test of sphericity [18] was statistically significant (chi-square 2835.758, 276 degrees of freedom, p < 0.0001), support- ing the factorability of the correlation matrix. PCA re- vealed the presence of six components for which the ei- genvalues exceeded 1, and together these explained 62.95% of the total variance in QoL between respondents: component 1 explained the largest proportion of the vari- ance (13.33%), this being supported by inspection of the scree plot [20]. Applying the Kaiser criterion of retaining all components with eigenvalues above 1, most items (n = 21/24) loaded strongly (0.4+): on the first component three items loaded strongly (0.4+) and one loaded moder- ately (0.3+); four items loaded strongly (0.4+) on each of the second, third, and fourth components; on the fifth component three items loaded strongly (0.4+) and one loaded mildly (0.2+); and on the sixth component, two items loaded strongly (0.4+), one loaded mildly (0.2+), and one item did not load, it loading instead on the fifth component (Table 2). There is no gold standard QoL measure to assess crite- rion validity, but concurrent validity (convergent and dis- criminant) was tested here. The WHOQOL-OLD corre- lated positively with the DQOL (r = 0.159, p < 0.032), as would be expected, and negatively with both the BDI (r = −0.516, p < 0.034) and the GDS (r = −0.336, p < 0.002). Participants reported optimum levels of QoL when DQOL was better (higher scores), and when BDI and GDS scores were low. In terms of the discriminant validity of the WHO- QOL-OLD, Ta bl e s 3 -5 show comparisons of the quality of life scores (for each domain and total) obtained by dif- ferent subgroups defined by self-perceived health status, educational level, and gender. Healthy participants scored higher than unhealthy participants on all domains of qual- ity of life and, therefore, also on overall QoL. The effect size of these differences was medium in all cases except for Autonomy, Death and Dying, and Intimacy, where the effect was small (Table 3). With regard to educational level, the analysis showed that quality of life scores (both by domain and overall) increased in line with participants’ level of education (Table 4). Finally, the results for gender only revealed significant differences between men and women on the QoL scores for the domains SP and Death and Dying (Table 5). 4. DISCUSSION Factor analysis supported the multidimensional struc- ture of the Mexican Spanish version of the WHOQOL- OLD module. However, more detailed examination of the Copyright © 2013 SciRes. OPEN ACCESS  A. L. González-Celis, J. Gómez-Benito / Health 5 (2013) 110-116 Copyright © 2013 SciRes. OPEN ACCESS 113 Table 2. Rotated component matrixa. Component Items 1 2 3 4 5 6 Social Participation 18. Satisfied with opportunity to participate in community 0.805 17. Satisfied with level of activity 0.787 16. Satisfied with the way you use your time 0.775 14. Have enough to do each day 0.348 Intimacy 23. Opportunities to love 0.863 24. Opportunities to be loved 0.856 21. Feel a sense of companionship in life 0.735 22. Experience love in your life 0.728 Death and Dying 7. Afraid of not being able to control death 0.863 6. Concerned about the way you will die 0.830 8. Scared of dying 0.811 9. Fear pain before death 0.712 Sensory Abilities 2. Loss of sensory abilities affect participation in activities 0.849 1. Impairments to senses affect daily life 0.838 10. Problems with sensory functioning affect ability to interact 0.678 20. Rate sensory functioning 0.515 Past, Present and Future Activities 12. Satisfied with opportunities to continue achieving 0.618 13. Received the recognition you deserve in life 0.443 19. Happy with things to look forward to 0.438 15. Satisfied with what you’ve achieved in life 0.277 Autonomy 5. People around you are respectful of your freedom 0.738 3. Freedom to make own decisions 0.714 4. Feel in control of your future 0.286 11. Able to do things you’d like 0.716 % of Variance Explained 13.328 11.996 11.537 9.977 9.959 6.152 Cumulative % of Variance Explained 13.328 25.324 36.861 46.837 56.796 62.948 Extraction method: principal component analysis. Rotation method: varimax with Kaiser normalization. a.Rotation converged in 6 iterations. Table 3. Comparison of quality of life scores (domains and overall) by self-perceived health status: Student’s t test, probability values, and effect size d. QOL Domain Health status N Mean SD t df p d Unhealthy 134 15.13 3.11 2.15 225 0.033 0.29** Sensory Abilities Healthy 93 16.06 3.38 Unhealthy 134 16.07 2.80 1.51 225 0.132 0.20* Autonomy Healthy 93 16.63 2.67 Unhealthy 134 15.92 3.18 3.10 225 0.003 0.41** Past/Present/Future Activities Healthy 93 17.10 2.52 Unhealthy 134 15.83 3.21 2.47 225 0.014 0.33** Social Participation Healthy 93 16.83 2.69 Unhealthy 134 15.34 4.52 1.15 225 0.253 0.15* Death And Dying Healthy 93 16.02 4.29 Unhealthy 134 15.48 3.68 1.08 225 0.280 0.14* Intimacy Healthy 93 16.03 3.94 Unhealthy 134 93.77 14.11 2.70 225 0.007 0.36** Total Score QoL Healthy 93 98.68 12.52 Note: Sum of N in each domain does not equal 285 (total sample) due to missing data, *Small effect size, **Medium effect size. 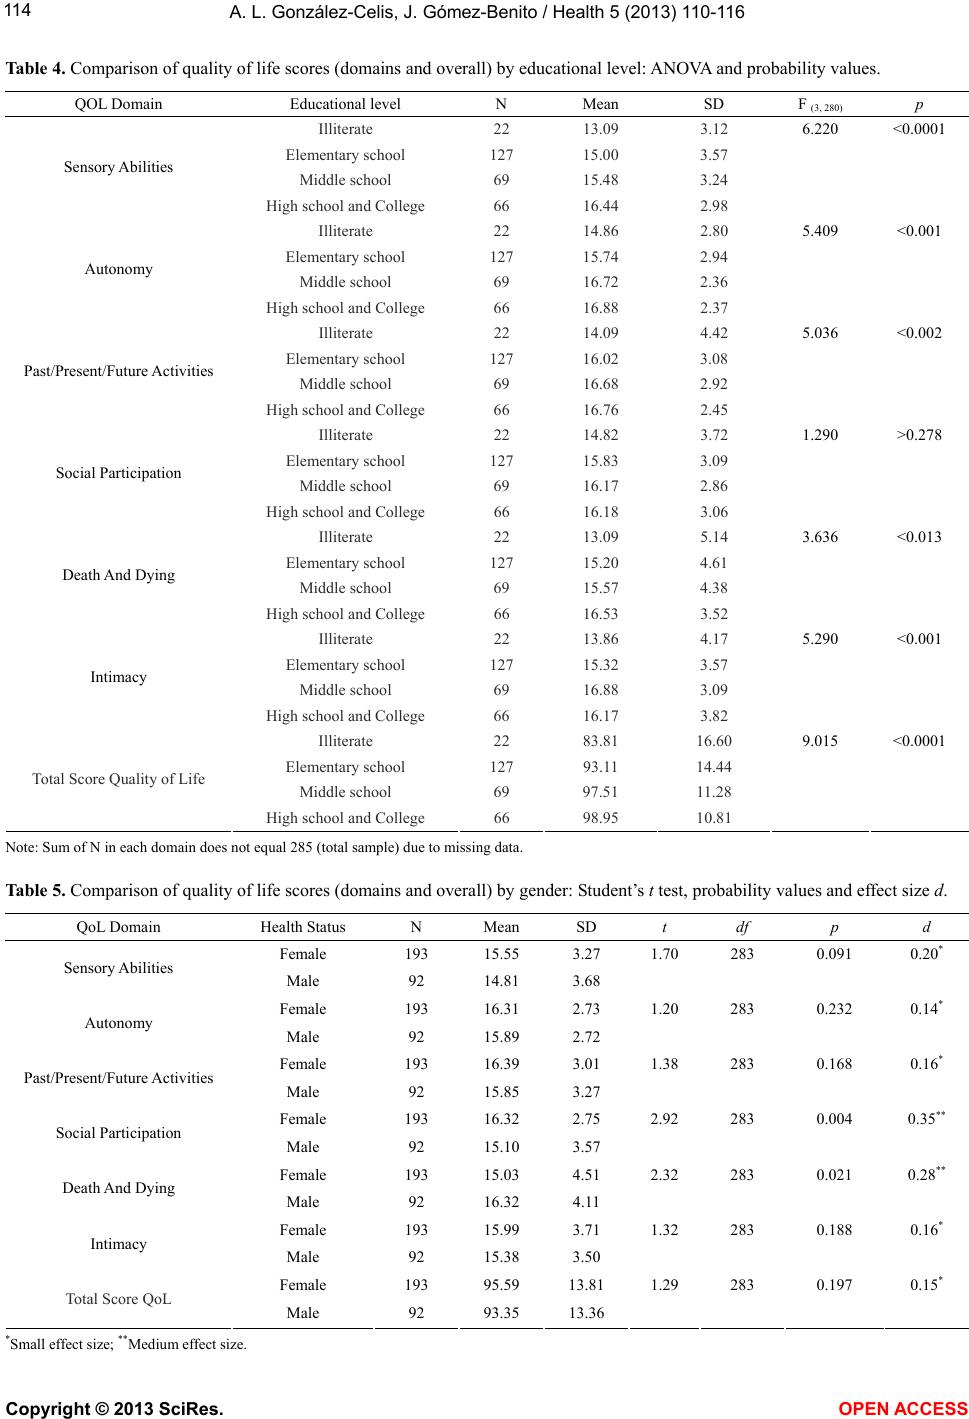 A. L. González-Celis, J. Gómez-Benito / Health 5 (2013) 110-116 114 Table 4. Comparison of quality of life scores (domains and overall) by educational level: ANOVA and probability values. QOL Domain Educational level N Mean SD F (3, 280) p Illiterate 22 13.09 3.12 6.220 <0.0001 Elementary school 127 15.00 3.57 Middle school 69 15.48 3.24 Sensory Abilities High school and College 66 16.44 2.98 Illiterate 22 14.86 2.80 5.409 <0.001 Elementary school 127 15.74 2.94 Middle school 69 16.72 2.36 Autonomy High school and College 66 16.88 2.37 Illiterate 22 14.09 4.42 5.036 <0.002 Elementary school 127 16.02 3.08 Middle school 69 16.68 2.92 Past/Present/Future Activities High school and College 66 16.76 2.45 Illiterate 22 14.82 3.72 1.290 >0.278 Elementary school 127 15.83 3.09 Middle school 69 16.17 2.86 Social Participation High school and College 66 16.18 3.06 Illiterate 22 13.09 5.14 3.636 <0.013 Elementary school 127 15.20 4.61 Middle school 69 15.57 4.38 Death And Dying High school and College 66 16.53 3.52 Illiterate 22 13.86 4.17 5.290 <0.001 Elementary school 127 15.32 3.57 Middle school 69 16.88 3.09 Intimacy High school and College 66 16.17 3.82 Illiterate 22 83.81 16.60 9.015 <0.0001 Elementary school 127 93.11 14.44 Middle school 69 97.51 11.28 Total Score Quality of Life High school and College 66 98.95 10.81 Note: Sum of N in each domain does not equal 285 (total sample) due to missing data. Table 5. Comparison of quality of life scores (domains and overall) by gender: Student’s t test, probability values and effect size d. QoL Domain Health Status N Mean SD t df p d Female 193 15.55 3.27 1.70 283 0.091 0.20* Sensory Abilities Male 92 14.81 3.68 Female 193 16.31 2.73 1.20 283 0.232 0.14* Autonomy Male 92 15.89 2.72 Female 193 16.39 3.01 1.38 283 0.168 0.16* Past/Present/Future Activities Male 92 15.85 3.27 Female 193 16.32 2.75 2.92 283 0.004 0.35** Social Participation Male 92 15.10 3.57 Female 193 15.03 4.51 2.32 283 0.021 0.28** Death And Dying Male 92 16.32 4.11 Female 193 15.99 3.71 1.32 283 0.188 0.16* Intimacy Male 92 15.38 3.50 Female 193 95.59 13.81 1.29 283 0.197 0.15* Total Score QoL Male 92 93.35 13.36 *Small effect size; **Medium effect size. Copyright © 2013 SciRes. OPEN ACCESS  A. L. González-Celis, J. Gómez-Benito / Health 5 (2013) 110-116 Copyright © 2013 SciRes. 115 WHOQOL-OLD (including a confirmatory factor analy- sis with rotation) is required before its factor structure can be confirmed. OPEN ACCESS The Mexican Spanish version of the WHOQOL-OLD module showed acceptable correlations with the DQOL, BDI, and GDS, this being consistent with the literature [21]. All these correlations between the DQOL, BDI, and GDS and scores on the six domains (and overall) of the WHOQOL-OLD were statistically significant. Positive coefficients indicated that higher quality-of-life scores for older persons assessed with the WHOQOL-OLD are associated with higher levels of quality of life in diabetic patients, as measured by the DQOL; furthermore, nega- tive coefficients indicated that the greater the level of depressive symptoms, the poorer the overall and domain scores for quality of life, as measured by the WHOQOL- OLD [22,23]. This indicates that the Mexican Spanish version of the WHOQOL-OLD has criterion validity (convergent and divergent). This version of the WHO- QOL-OLD was also shown to discriminate between self-perceived healthy and unhealthy elders [2], and also on the basis of educational level [24]. This was not case, however, for gender, where the results are conflicting [25]. 5. CONCLUSION The WHOQOL-OLD module is a useful alternative to the WHOQOL-100 or WHOQOL-BREF for investigat- ing the quality of life in older adults, not least as it in- cludes relevant aspects not covered by instruments ori- ginally designed for non-elderly populations. This study has shown that the Mexican Spanish version of the WHOQOL-OLD module (comprising 24 items spread across six domains) has adequate psychometric proper- ties. It may therefore be used to assess the quality of life in relation to different health conditions found among the elderly [26,27]. As such, it can help in considering the needs, perceptions and interests of older adults [28]. 6. ACKNOWLEDGEMENTS This study was supported by grant 2009SGR00822 from the Agency for Management of University and Re- search Grants, Government of Catalonia. REFERENCES [1] World Health Organization (2002) Active ageing: A pol- icy framework. WHO, Geneva. http://whqlibdoc.who.int/hq/2002/WHO_NMH_NPH_02. 8.pdf [2] Browne, J.P., O’Boyle, C.A., McGee, H.M., Joyce, C.R., McDonald, N.J., O’Malley, K., et al. (1994) Individual quality of life in the health elderly. Quality of Life Re- search, 3, 235-244. http://dx.doi.org/10.1007/BF00434897 [3] Bowling, A., Gabriel, Z., Dykes, J. Dowding, L.M., Ev- ans, O. Fleissig, A., Banister, D. and Sutton, S. (2003) Let’s ask them: A national survey of definitions of quality of life and its enhancement among people aged 65 and over. International Journal Aging and Human Develop- ment, 56, 269-306. http://dx.doi.org/10.2190/bf8g-5j8l-ytrf-6404 [4] Power, M., Quinn, K., Schmidt, S. and WHOQOL-OLD Group (2005) Development of the WHOQOL-OLD mod- ule. Quality of Life Research, 14, 2197-2214. http://dx.doi.org/10.1007/s11136-005-7380-9 [5] The World Health Organization (1998) Quality of life as- sessment (WHOQOL): Development and general psy- chometric properties. Social Science and Medicine, 12, 1569-1585. http://dx.doi.org/10.1016/S0277-9536(98)00009-4 [6] World Health Organization (1996) WHOQOL-BREF. introduction, administration, scoring and generic version of the assessment. field trial version. Program on mental health. WHO, Geneva. http://www.who.int/mental_health/media/en/76.pdf [7] Skevington, S.M., Lotfy, M. and O’Connell, K.A. (2004) The World Health Organization’s WHOQOL-BREF qual- ity of life assessment: Psychometric properties and results of the international field trial. A report from the WHO- QOL group. Quality of Life Research, 13, 299-310. http://dx.doi.org/10.1023/B:QURE.0000018486.91360.00 [8] Lucas-Carrasco, R., Laidlaw, K. and Power, M. (2011) Suitability of the WHOQOL-BREF and WHOQOL-OLD for Spanish older adults. Aging & Mental Health, 15, 595-604. http://dx.doi.org/10.1080/13607863.2010.548054 [9] Beck, A.T., Ward, C.H., Mendelson, M., Mock, J. and Erbaugh, J. (1961) An inventory for measuring depress- sion. Archives of General Psychiatry, 4, 561-571. http://dx.doi.org/10.1001/archpsyc.1961.0171012003100 4 [10] González-Celis, A.L. (2009) Composición factorial del inventario de depresión de Beck en ancianos mexicanos. Journal of Behavior, Health & Social Issues, 1, 15-28. http://www.redalyc.org/articulo.oa?id=282221718002# [11] Yesavage, J.A., Brink, T.L., Rose, T.L., Lum, O., Huang, V., Adey, M. and Leiver, V.O. (1983) Development and validation of a geriatric depression screening scale: A preliminary report. Journal of Psychiatric Research, 18, 37-49. http://dx.doi:10.1016/0022-3956(82)90033-4 [12] González-Celis, A.L. and Sánchez-Sosa, J.J. (2003) Efectos de un programa cognitivo-conductual para mejorar la calidad de vida en adultos mayores. Revista Mexicana de Psicología, 20, 43-58. [13] Jacobson, A.M., de Groot, M. and Samson, J. (1994) Quality of life in patients with Type I and Type II diabetes mellitus. Diabetes Care, 17, 167-274. http://dx.doi.org/10.2337/diacare.17.4.267 [14] Robles-García, R., Cortázar, J., Sánchez-Sosa, J.J., Páez- Agraz, F. and Nicolini-Sánchez, H. (2003) Evaluación de la calidad de vida en diabetes mellitus tipo II: Pro- piedades psicométricas de la versión en español del  A. L. González-Celis, J. Gómez-Benito / Health 5 (2013) 110-116 116 DQOL. Psicothema, 15, 247-252. http://redalyc2.uaemex.mx/articulo.oa?id=72715215 [15] Hattori-Hara, M. (2013) Entrenamiento en competencias de afrontamiento al paciente geriátrico con diabetes mel- litus y su cuidador informal. Ph.D. Thesis, National Uni- versity of Mexico, Mexico City. [16] Kaiser, H.F. (1970) A second generation little jiffy. Psy- chometrika, 35, 401-415. http://dx.doi.org/10.1007/BF02291817 [17] Kaiser, H.F. (1974) An index of factorial simplicity. Psy- chometrika, 39, 31-36. http://dx.doi.org/10.1007/BF02291575 [18] Bartlett, M.S. (1954) A note on the multiplying factors for various chi square approximations. Journal of the Royal Statistical Society, Series B, 16, 296-298. [19] Cohen, J. (1992) A power primer. Psychological Bulletin, 112, 155-159. http://dx.doi:10.1037/0033-2909.112.1.155 [20] Catell, R.B. (1966) The screen test for number of factors, Multivariate Behavioral Research, 1, 245-276. http://dx.doi.org/10.1207/s15327906mbr0102_10 [21] Bowling, A. (2005) Measuring health. A review of quality of life measurement scales. 3rd Edition, Open University Press, Berkshire. [22] World Health Organization (2006) WHOQOL-OLD manual. European Office, Copenhagen, WHO, Geneva. http://library.cph.chula.ac.th/Ebooks/WHOQOL-OLD%2 0Final%20Manual.pdf [23] González-Celis, A.L. and Gómez-Benito, J. (2013) Spiri- tuality and quality of life and its effect on depression in older adults in mexico. Psychology, 4, 178-182. http://dx.doi:10.4236/psych.2013.43027 [24] Fleck, M.P., Chachamovich, E. and Trentini, C. (2006) Development and validation of the Portuguese version of the WHOQOL-OLD module, Revista de Saúde Pública, 40, 785-791. http://www.scielo.br/pdf/rsp/v40n5/07.pdf [25] Bowling, A. (2009) The psychometric properties of the older people’s quality of life questionnaire, compared with the CASP-19 and the WHOQOL-OLD. Current Ge- rontology and Geriatrics Research, 2009, Article ID: 298950. http://dx.doi:10.1155/2009/298950 [26] Utzolino, S., Ober, P.A., Kaffarnik, M. Fischer, A., Hopt, U.T. and Baier, P.K. (2010) Short-and long-term health implications of surgical intensive care in the elderly. Health, 2, 1405-1412. http://dx.doi:10.4236/health.2010.212209 [27] Esbensen, B.A. and Thomsen, T. (2011) Quality of life and hope in elderly people with cancer. Open Journal of Nursing, 1, 26-32. http://dx.doi:10.4236/ojn.2011.12004 [28] Gabriel, Z. and Bowling, A. (2004) Quality of life from the perspectives of older people. Ageing and Society, 24, 675-691. http://dx.doi:10.1017/S0144686X03001582. Copyright © 2013 SciRes. OPEN ACCESS
|