S. GOODWIN ET AL.
1264
Wells are separated by type (vertical, horizontal, or
extended horizontal) using Noble’s well naming system
or the number of hydraulic fracturing stages, if available.
Directional and deviated wells are categorized as vertical
wells for this study because of similar water require-
ments. Horizontal wells are separated from extended ho-
rizontal wells by Noble’s well naming system or the
number of hydraulic fracturing stages used when avail-
able. A horizontal well will typically be hydraulically
fractured in 20 stages. Recently, Noble has drilled and
hydraulically fractured longer horizontal wells that can
include over 40 stages to hydraulically fracture. Hori-
zontal wells that require over 25 hydraulic fracturing
stages are defined as extended horizontal wells in this
study.
The type of hydraulic fracturing fluid used and the
number of hydraulic fracturing stages per well are col-
lected from Noble Energy’s WellView software. The well
coordinates, year, and target formation are all collected
COGCC’s online facilities database.
An Anderson-Darling test [11] is used to test the nor-
mality of each subset of data. The difference between
water use for each subset of data is tested using a non-
parametric Kruskal-Wallis test. A Dunn-Šidák post-hoc
comparison [12] is used to compare any differences be-
tween samples that are found using the Kruskal-Wallis
test. A 95% confidence interval is used throughout the
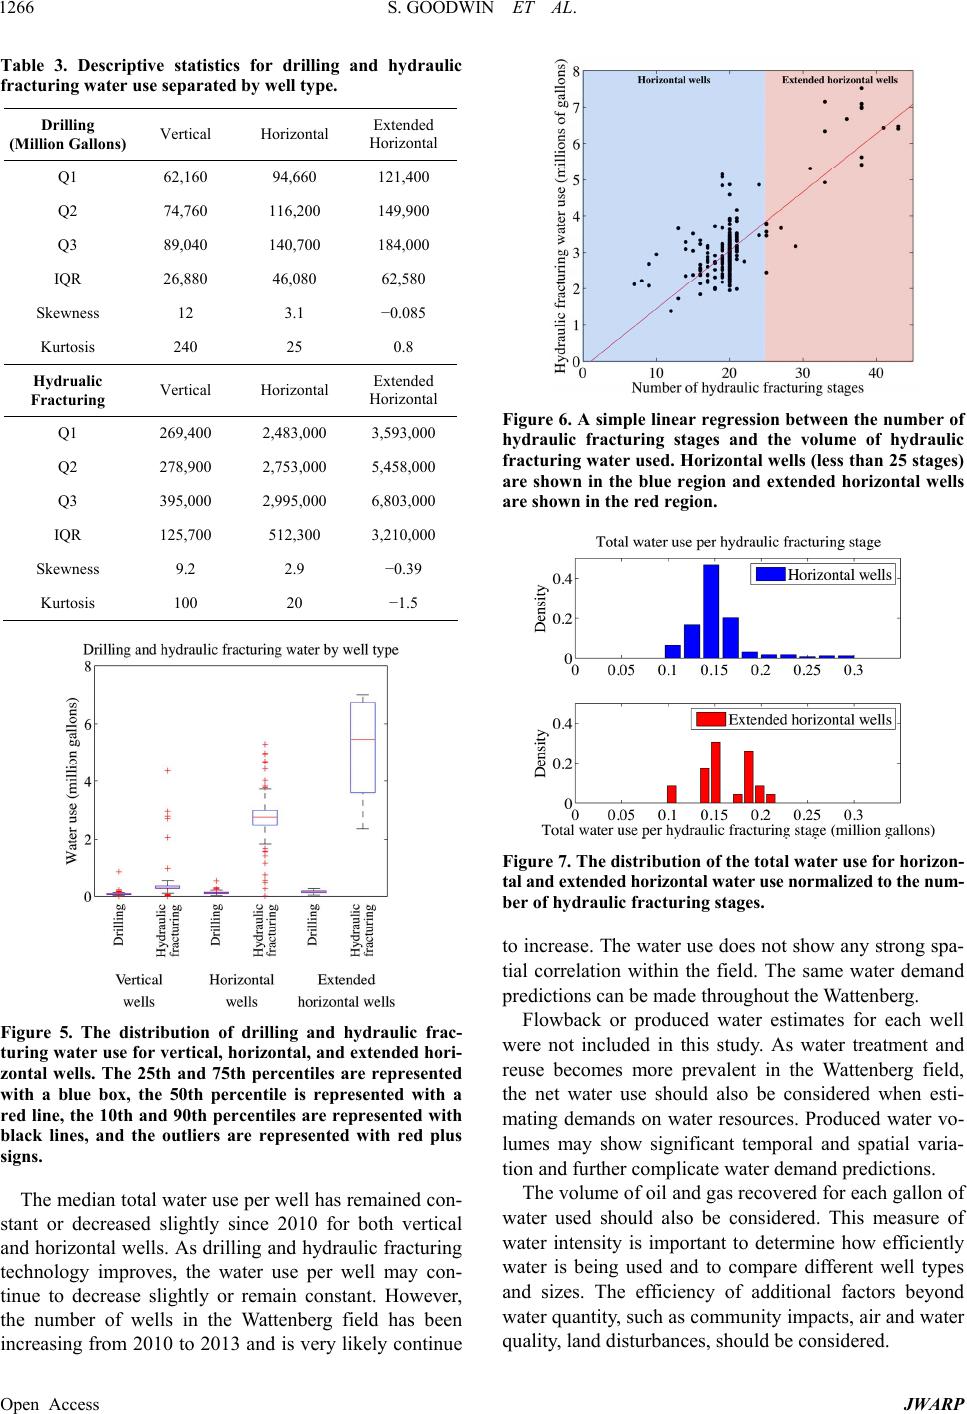
analysis. The number of hydraulic fracturing stages is
correlated using a simple linear regression. A coefficient
of determination is used to measure how well the regres-
sion correlates the hydraulic fracturing water use and the
number of stages. Spatial autocorrelations are measured
with ArcGIS Spatial Analyst tool [13] using Moran’s I
with inverse distance weighting and a 95% confidence
interval.
1220 wells have both drilling and hydraulic fracturing
water and are included in the study. Wells that are drilled
but not hydraulically fractured (260 sampled wells) are
typically conventional wells recovering from an oil and
gas trap. Wells that are hydraulically fractured but not
drilled (25 sampled wells) are typically existing wells
that are reworked or restimulated using hydraulic frac-
turing.
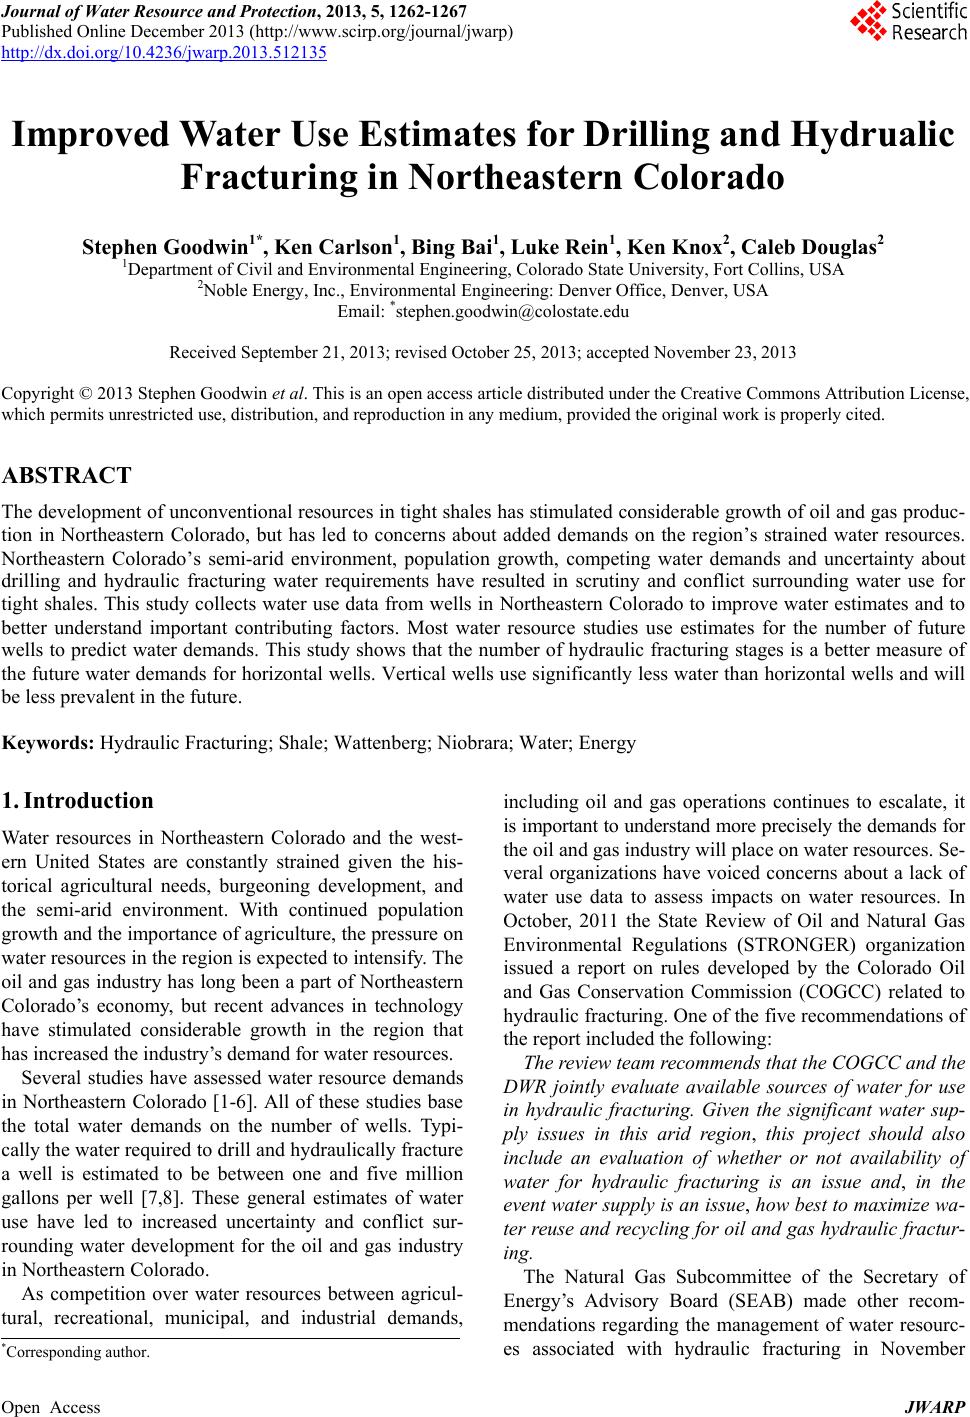
3. Results
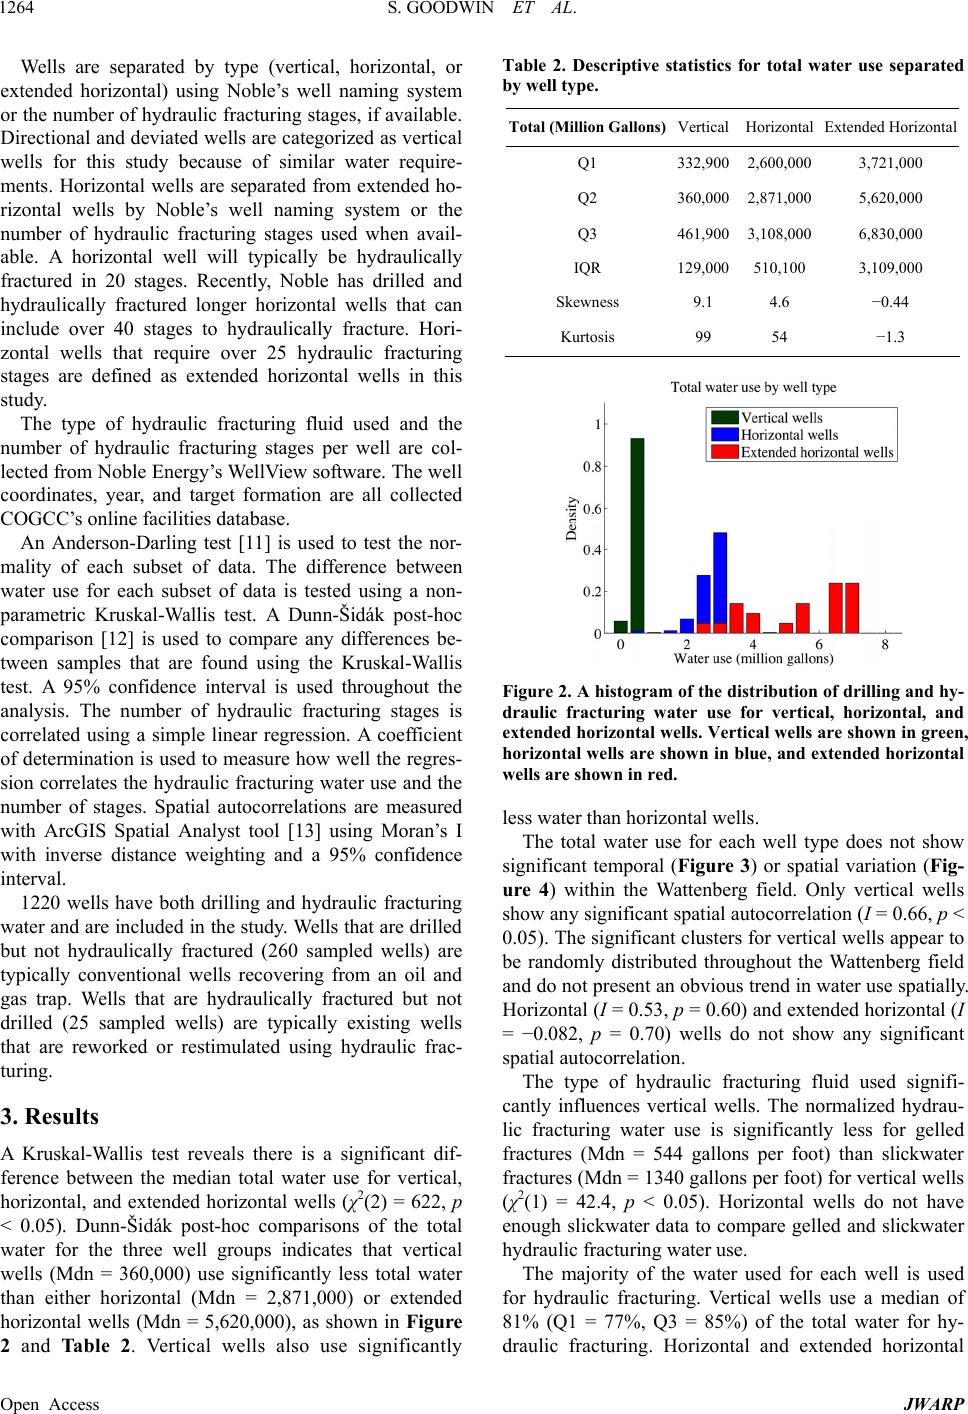
A Kruskal-Wallis test reveals there is a significant dif-
ference between the median total water use for vertical,
horizontal, and extended horizontal wells (χ2(2) = 622, p
< 0.05). Dunn-Šidák post-hoc comparisons of the total
water for the three well groups indicates that vertical
wells (Mdn = 360,000) use significantly less total water
than either horizontal (Mdn = 2,871,000) or extended
horizontal wells (Mdn = 5,620,000), as shown in Figure
2 and Table 2. Vertical wells also use significantly
Table 2. Descriptive statistics for total water use separated
by well type.
Total (Million Gallons)Vertical Horizontal Extended Horizontal
Q1 332,900 2,600,000 3,721,000
Q2 360,000 2,871,000 5,620,000
Q3 461,900 3,108,000 6,830,000
IQR 129,000 510,100 3,109,000
Skewness 9.1 4.6 −0.44
Kurtosis 99 54 −1.3
Figure 2. A histogram of the distribution of drilling and hy-
draulic fracturing water use for vertical, horizontal, and
extended horizontal wells. Vertical we lls are shown in green,
horizontal wells are shown in blue, and extende d horizontal
wells are show n in red.
less water than horizontal wells.
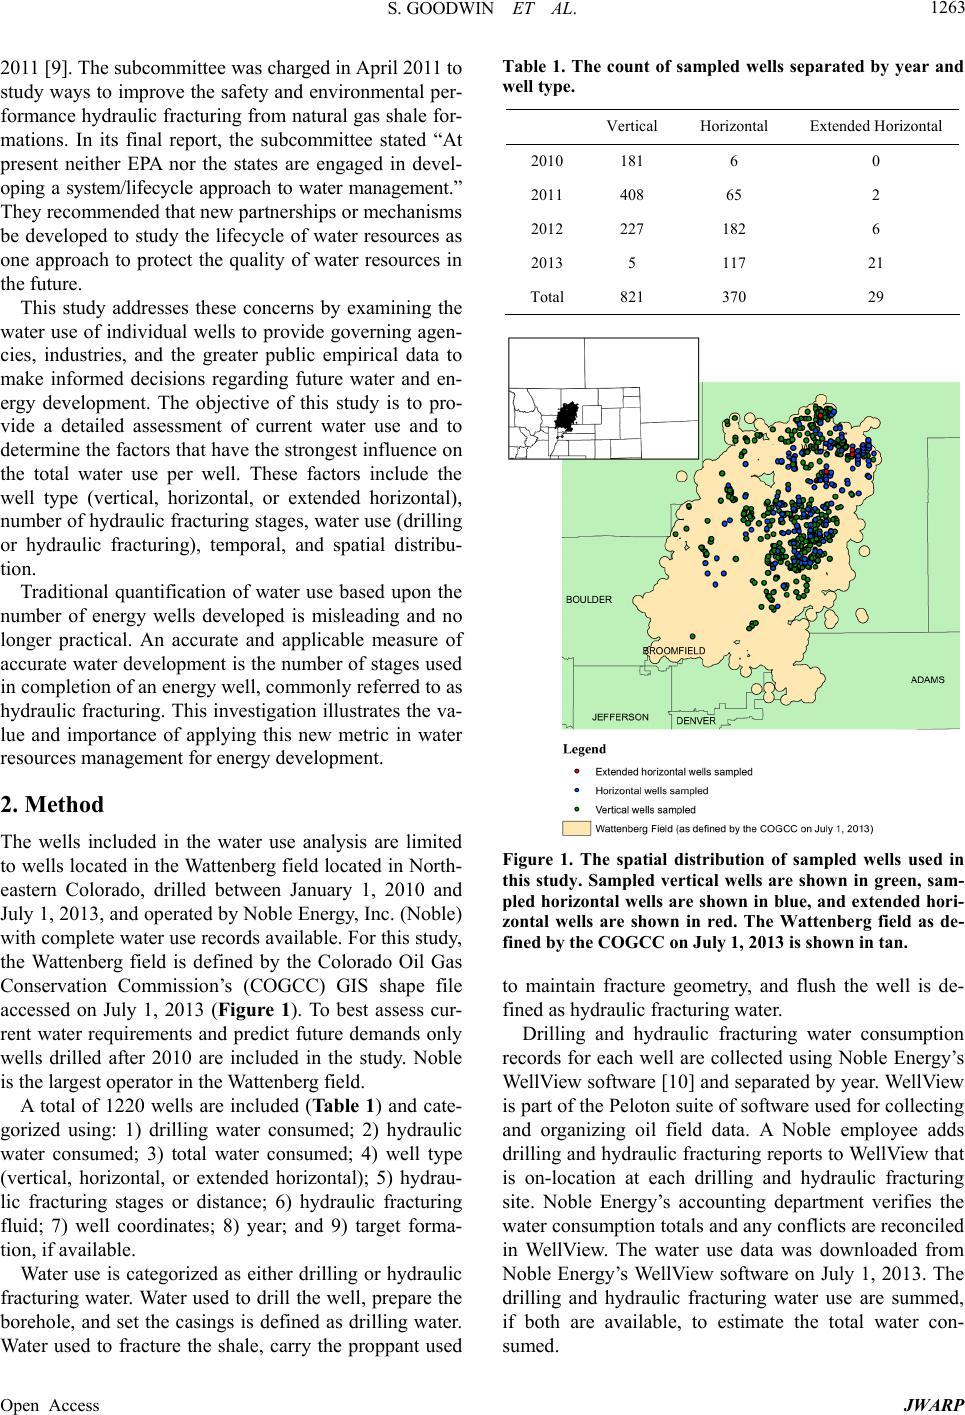
The total water use for each well type does not show
significant temporal (Figure 3) or spatial variation (Fig-
ure 4) within the Wattenberg field. Only vertical wells
show any significant spatial autocorrelation (I = 0.66, p <
0.05). The significant clusters for vertical wells appear to
be randomly distributed throughout the Wattenberg field
and do not present an obvious trend in water use spatially.
Horizontal (I = 0.53, p = 0.60) and extended horizontal (I
= −0.082, p = 0.70) wells do not show any significant
spatial autocorrelation.
The type of hydraulic fracturing fluid used signifi-
cantly influences vertical wells. The normalized hydrau-
lic fracturing water use is significantly less for gelled
fractures (Mdn = 544 gallons per foot) than slickwater
fractures (Mdn = 1340 gallons per foot) for vertical wells
(χ2(1) = 42.4, p < 0.05). Horizontal wells do not have
enough slickwater data to compare gelled and slickwater
hydraulic fracturing water use.
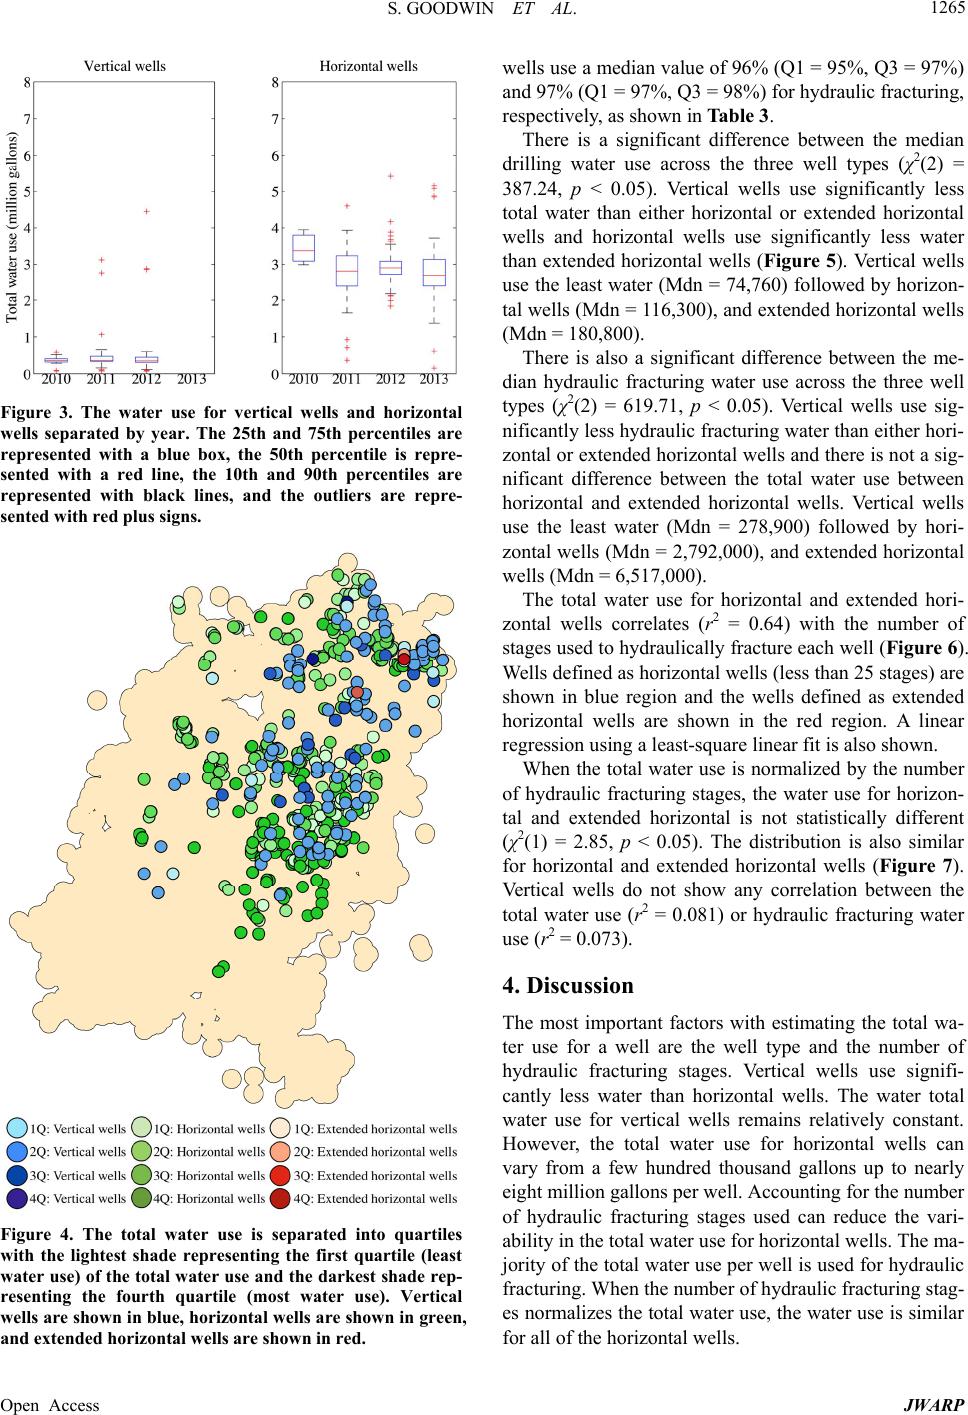
The majority of the water used for each well is used
for hydraulic fracturing. Vertical wells use a median of
81% (Q1 = 77%, Q3 = 85%) of the total water for hy-
draulic fracturing. Horizontal and extended horizontal
Open Access JWARP