C. A. PENSAVALLE, G. SOLINAS
Open Access 771
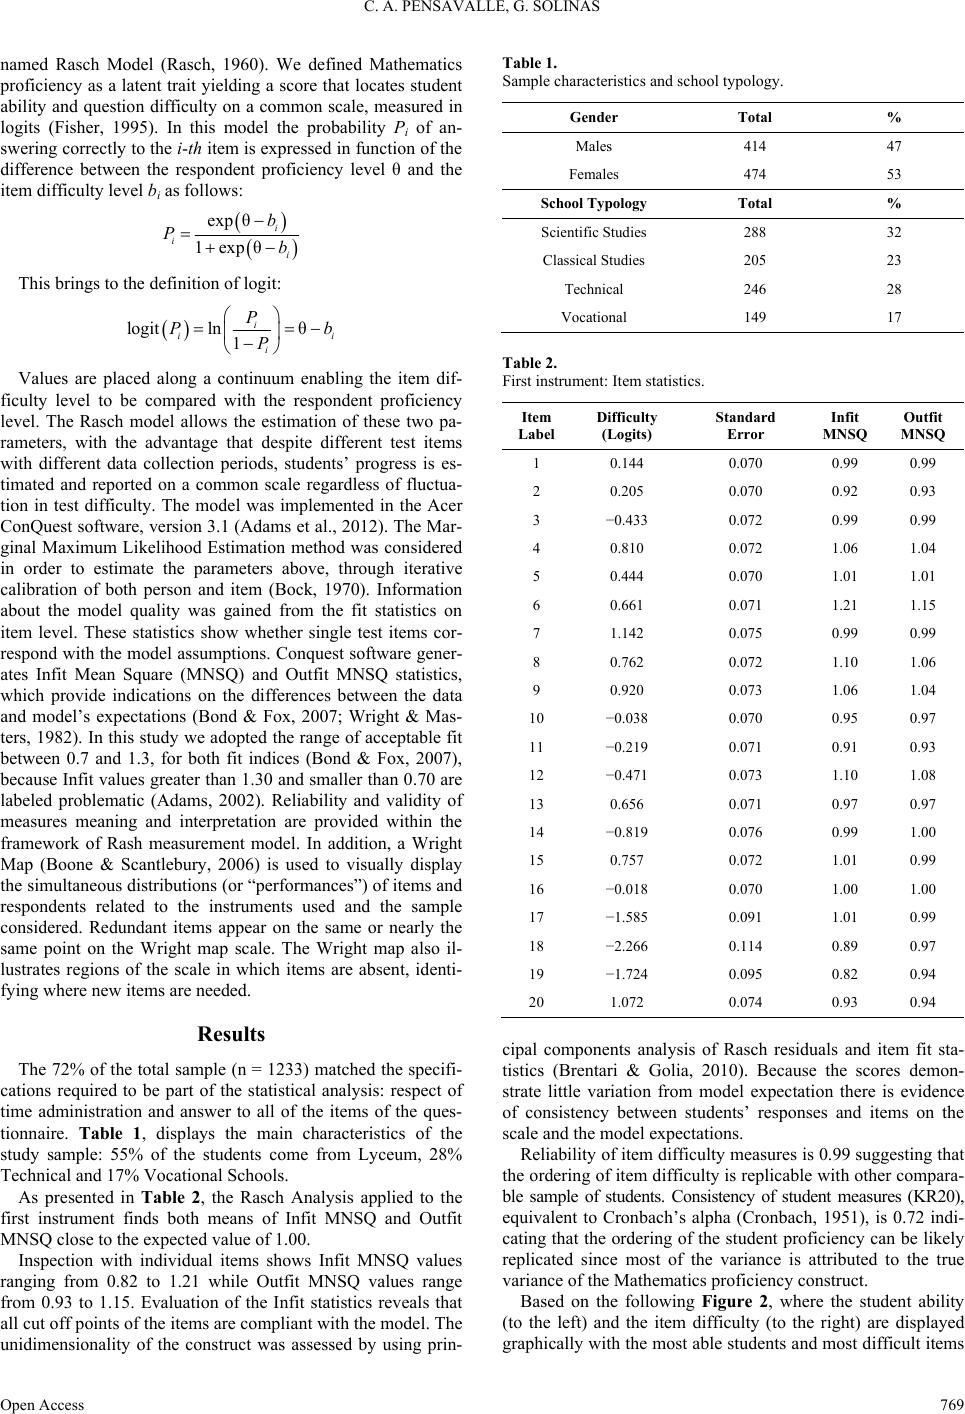
Figure 3.
Wright map of the second instrument.
of the first questionnaire, Item 7 (1.142 logits), was higher in
difficulty as compared to Item 18 that was almost twice as easy
(−2.266 logits). For the second questionnaire, it is difficult to
define the students’ strategic competence because of large gaps
of the scale in which items are absent. These results provide
evidence for construct validity of the second questionnaire. In
particular, the item difficulty measures show that this question-
naire is composed of items whose level of difficulty did not
correspond to the level of Mathematics proficiency of the stu-
dents’ sample. Therefore, in light of these preliminary results,
there is a need for local schools and universities to become
attuned to the full extent of the Mathematics problem as it af-
fects Senior High School Sardinian Students. The diagnostic
testing of new undergraduates is recommended as an effective
means of investigating levels of Mathematics proficiency and
identifying actions to improve quality, equity and efficiency of
Sardinian educational systems.
Acknowledgements
The authors would like to thank the Sardinia Region, the
European Social Fund and the Italian Ministry of Labor and
Social Policies whose funding made this study possible.
REFERENCES
Adams, R. (2002). Scaling PISA cognitive data. In R. Adams, & M.
Wu (Eds.), PISA 2000 technical report (pp. 99-108). Paris: OECD.
Adams, R., Wu, M., & Wilson, M. (2012). ACER ConQuest 3.1. Mel-
bourne: ACER.
Bock, R. D., & Lieberman, M. (1970). Fitting a response model for
dichotomously scored items. Psychometrika, 35, 179-187.
http://dx.doi.org/10.1007/BF02291262
Bond, T. G., & Fox, C. M. (2007). Applying the rasch model: Funda-
mental measurement in the human sciences. Mahwah, New Jersey:
Lawrence Erlbaum Associates.
Boone, W. J., & Scantlebury, K. (2006). The role of Rasch analysis
when conducting science education research utilizing multiple-
choice tests. Science Education, 90, 253-269.
http://dx.doi.org/10.1002/sce.20106
Brentari, E., & Golia, S. (2007). Unidimensionality in the Rasch model:
how to detect and interpret. Statis ti c a , 6 7 , 253-261.
Chiandotto, B., & Giusti, C. (2005). L’abbandono degli studi universi-
tari. In C. Crocetta (Ed.), Modelli statistici per l’analisi della tran-
sizione università-lavoro (pp. 1-22). Padova.
Cingano, F., & Cipollone, P. (2007). University drop-out: The case of
Italy. Temi di discussione del Servizio Studi, 626. Roma: Banca
d’Italia.
Cronbach, L. J. (1951). Coefficient alpha and the internal structure of
tests. Psychometrika, 16, 297-334.
http://dx.doi.org/10.1007/BF02310555
Delvecchio, F., & D’Ovidio, F. (2002). Alcuni fattori di rischio per
l’abbandono degli studi universitari. In L. C. Sardi, & F. Delvecchio
(Eds.), Indicatori e metodi per l’analisi dei percorsi universitari e
postuniversitari (pp. 101-124). Padova: Cleup.
Dunne, T., Long, C., Craig, T., & Venter, E. (2012). Meeting the re-
quirements of both classroom-based and systematic assessment of
mathematics proficiency: The potential of Rasch measurement theory.
Pythagoras, 33, 16 p. http://dx.doi.org/10.4102/pythagoras.v33i3.19
Fisher, G. (1995). Derivations of the Rasch model. In G. H. Fisher, & I.
W. Molenaar (Eds.), Rasch models: Foundations recent develop-
ments and applications (pp. 15-38). Berlin: Springer-Verlag.
http://dx.doi.org/10.1007/978-1-4612-4230-7_2
Hawkes, T., & Savage, M. (2000). Measuring the mathematics problem.
London: Engineering Council.
Kilpatrick, J., Swafford, J., & Findell, B. (2001). Adding it up: Helping
how children learn Mathematics. Washington DC: National Acade-
mic Press.
MIUR/CNVSU (2011). Undicesimo rapporto sullo stato del sistema
universtiario. http://www.cnvsu.it
Mossi, P., Venuleo, C., Tondo, P., & Salvatore, S. (2012). The meas-
urement of students’ performance. The use of an extended Rasch
model for the analysis of predictors of high educational performance.
EJASA, 5, 393-399.
Mouw, J. T., & Khanna, R. K. (1983). Prediction of academic success:
A review of the literature and some recommendations. College Stu-
dent Journal, 27, 328-336.
PISA (2009). Results: What students know and can do. Student per-
formance in reading, mathematics and science (Volume I).
http://dx.doi.org/10.1787/9789264091450-en
Rasch, G. (1960). Probabilistic models for some intelligence and at-
tainments tests. Copenhagen: Danish Institute for Educational Re-
search.
Rohde, T. E., & Thompson, L. A. (2007). Predicting academic achieve-
ment with cognitive ability. Intelligence, 35, 83-92.
http://dx.doi.org/10.1016/j.intell.2006.05.004
Samuelsson, J. (2010). The impact of teaching approaches on students’
mathematical proficiency in Sweden. International Electronic Jour-
nal of Mathematics Education , 5, 61-78.
Solinas, G., Masia, M.D., Maida, G., & Muresu, E. (2012). What really
affects student satisfaction? An assessment of quality through a uni-
versity-wide student survey. Creative Education, 3, 37-40.
http://dx.doi.org/10.4236/ce.2012.31006
Teddlie, C., & Reynolds, D. (2000). International handbook of school
effectiveness. London: Falmer.
Wright, B. D., & Masters, G. N. (1982). Rating scale analysis: Rasch
measurement. Chicago: Mesa Press.