Paper Menu >>
Journal Menu >>
 Advances in Chemical Engineering and Science, 2011, 1, 20-25 doi:10.4236/aces.2011.11004 Published Online January 2011 (http://www.SciRP.org/journal/aces) Copyright © 2011 SciRes. ACES Hydrothermal Synthesis and Characterization of a Novel Zirconium Oxide and Its Application as an Ion Exchanger Mamdouh M. Abou-Mesalam Chemistry Department, Faculty of Science, Al-Baha University, Kingdom Saudi Arabia Nuclear Fuel Technology Department, Hot Labs. Centre, At omic Energy Authority, Cairo, Egypt E-mail: mabumesalam@yahoo.com Received December 25, 2010; revised January 10, 2011; accepted J a nu ary 15, 2011 Abstract A novel hydrothermal zirconium oxide (ZrO2) ion exchange material was successfully synthesized by hydrothermal technique. The material has been characterized using different tools such as thermal analysis (DTA-TGA), FT-IR and X-ray diffraction studies. The results show that the prepared ZrO2 is pure and with a unique shape and it belongs to the hexagonal system. Chemical resistively of the material for various media such as, water, acids and bases have been assessed. The capacity of ZrO2 ion exchanger for Na+, Cu2+, Ni2+ and Zn2+ ions at natural pH has been determined. The effect of heating treatment for ZrO2 on ion exchange capacity was studied. The sorption/ion exchange behaviour of Cu2+, Ni2+ and Zn2+ ions towards ZrO2 in dif- ferent pH media has been investigated. The distribution coefficients and separation factors were determined. Finally, Freundlich isotherms for Cu2+, Zn2+ and Ni2+ ions on hydrothermal ZrO2 ion exchanger were inves- tigated and the Freundlich isotherm constants were conduced. Keywords: Hydrothermal Synthesis, Zirconium Oxide, Ion Exchanger 1. Introduction The methods for the synthesis of metal oxide ion ex- change material mainly include chemical deposition, sol-gel process, chemical vapor decomposition, gas- phase reaction and hydrothermal synthesis. Among these methods, hydrothermal method is a promising method for synthesizing ideal CdO material with special mor- phology via a simple, fast, low cost, low temperature, high yield and scalable process [1]. Additional, high- crystallized powders with narrow grain size-distribution and high purity without heat treatment at high tempera- ture are the advantages of hydrothermal technique [2-5]. Literature show many publications [6-9] on metal oxide ion exchangers such as ZnO and TiO2 that have been used extensively as photocatalyst due to their high photocatalytic activity, non-toxic nature, inexpensive, excellent chemical and mechanical stability. ZnO can be also a suitable alternative to TiO2 because it is lower cost and has the similar band gap energy around 3.2 eV. In addition, ZnO shows better performance compared to TiO2 in the degradation of several organic contaminants in both acidic and basic medium, which has stimulated many researchers to further explore the properties of ZnO in many photocatalytic reactions [6-8]. As we know, the shape, crystalline structure, and size of semiconduc- tors are important elements in determining their physical and chemical properties [9]. On the other hand, recent literature indicates few works carried out on ZrO2 as ion exchange materials. Additional, inorganic ion exchange materials have found extensive applications in analytical and industrial chemistry and played a vital role in the treatment of environmental pollutants. Ion exchange ma- terials with higher selectivities are continuously being investigated [1 0,11]. Hopefully, the results of this work might provide a promising data for the synthesis and characterization of ZrO2 as inorganic ion exchange material and its applica- tions for the removal of some toxic elements from haz- ardous wastewater. 2. Experimental 2.1. Hydrothermal Preparation of ZrO2 Ion Exchanger Zirconium oxide (ZrO2) inorganic ion exchange material was synthesized hydrothermally by the reaction of  M. M. A. Mesala m Copyright © 2011 SciRes. ACES 21 equi-concentrations (5%) solutions of zirconium oxy- chloride (ZrOCl2) and NH4OH with volumetric ration 2:1 under magnetic stirring. After mixing, the reaction mix- ture was further stirred for 60 min under constant stirring rate at room temperature to ensure all of the reagents react completely. Subsequently, the mixture was trans- ferred to a Teflon-lined stainless steel autoclave which were sealed and maintained at 130 1˚C for 24 h, and then it was natural cooled at room temperature. After hydrothermal reaction, the resulting solid products were filtered and washed with deionized water for several times in order to remove Cl- ions. Finally, the solid ZrO2 ion exchanger was dried in drying oven at 70 1˚C for overnight, and then ground, sieved and stored at room temperature. 2.2. Characterization of Prepared ZrO2 Ion Exchanger FTIR spectrum of ZrO2 ion exchange material was car- ried out using FTIR Spectrometer; BOMEN, MB-series and the measurements were carried out using KBr disc method technique. X-ray diffraction pattern of ZrO2 ion exchange material was carried out using SHIMADZO X-ray diffractometer, XD-D1, with a nickel filter and a Cu-K radiation. Differential thermal and Thermogra- vimetric analyses for ZrO2 was carried out using a SHIMADZU (DTA-TG) thermal analyzer obtained from Shimadzu Kyoto “Japan”. The sample was measured for ambient temperature up to 850˚C with heating rate of 5 deg./min. The surface area values of ZrO2 were meas- ured using BET-technique as an adsorption phenomenon of nitrogen gas on the powder surface at 77 K. 2.3. Chemical Resistively of ZrO2 Ion Exchanger The chemical resistively of the ZrO2 in various media H2O, HNO3, HCl, NaOH and KOH was studied by tak- ing 0.5 mg of sample in 50 ml of the particular medium and allowing it to stand for 24 h. The percent of solubil- ity was calculated and summarized in Table 1. 2.4. Sorption Studies: Capacity of ZrO2 for Na+, Cu2+, Ni2+ and Zn2+ Ions: The capacity of ZrO2 ion exchanger for Na+, Cu2+, Ni2+ and Zn2+ ions (in nitrate from) was carried out by equi- librium batch technique. 0.1 g of ion exchanger was equilibrated with 10 ml of 50 ppm of Na+, Cu2+, Ni2+ and Zn2+ ion solutions (natural pH) in a shaker thermostat at 25 1˚C. The capacity value was calculated by the fol- lowing formula; %Vm.mmol g 100 o Uptake Capacity C (1) where % uptake is the percent uptake of metal ions equal 100 ofo CCC , and Co, Cf is the initial and final concentration of the ions in solution, V is the solution volume and m is the sorbent mass. The effect of heating temperature treatment of ion ex- changer on ion exchange capacity of ZrO2 ion exchanger for Na+, Cu2+, Ni2+ and Zn2+ ions was studied by pre- treatment of 1 g portion of the material at different heat- ing temperature for 4 h at temperatures between 50˚C and 600˚C in a muffle furnace. Then the capacity was carried out as described previously. 2.5. Effect of pH Medium on Sorption Behaviour of ZrO2 Ion Exchanger: Effect of pH medium on the sorption behaviour of vari- ous metal ions Cu2+, Ni2+ and Zn2+ (in nitrate from) on ZrO2 ion exchanger was investigated. A series of metal solutions was prepared with concentrations equal 50 ppm at different pH adjusted using nitric acid from pH (1) to (5). The experiment was carried out by equilibration of 0.1 g of ion exchanger with 10 ml of metal ion solution. The mixture shaken for 3 h in shaker thermostat at 25 1˚C. Then the solutions were separated and the metal ion concentrations were determined using the supernatant liquid by atomic absorption spectrometer. The sorption percent, distribution coefficients and separation factors were determined using the following expressio ns; 100 oe o CC Sorption PercentC (2) oe de CC Distribution coefficient KVmmlg C (3) Ad Bd K B Separ ati on factor a K A (4) Where; Kd(A) is the distribution coefficient of (A) ion, Kd(B) is the distribution coefficient of (B) ion, Co is the initial concentration of metal ion, Ce is the final concentration of metal ion, V is the solution volume, m is the mass of ion exchanger. 2.6. Sorption Isotherm For adsorption iso therms for Cu2+, Ni2+ and Zn2+ ions on ZrO2 ion exchanger were investigated, 10 ml metal ion solution of different metal ion concentrations varied from 2 10-2 M to 5 10-4 M were equilibrated for a sp ecific  M. M. A. Mesala m Copyright © 2011 SciRes. ACES 22 period of time (3 h) with 0.1 g of exchanger. After 3 h (time sufficient to attain equilibrium) the supernatant liquid was removed immediately and the metal ion con- centration evaluated by atomic absorption spectrometer. The experiments were carried out in shaker thermostat at 25 1˚C. The equilibrium concentration (Ceq.) and amount uptake (W) were calculated in mmol/g as follows; o WUptake CVmmmolg (5) 1o Uptake C eq C (6) Plot of C against C/W and/or log Ceq. against log W/m were performed to obtain the required isotherm. 3. Results and Discussions Chemical resistively of ZrO2 ion exchange material was checked in different media such as H2O, HNO3, HCl, NaOH and KOH. The data represented in Table 1 indi- cated that ZrO2 is very stable in water and stable in acid medium, maximum tolerable limits being 2 N HNO3 and 2 N HCl, and it is not stable in base medium, maximum tolerable limits being 1 N NaOH and 0.5 N KOH. This means that ZnO2 ion exchange material is chemically stable in acid medium and hence can be used for analyti- cally import ant separat i ons. The FTIR adsorption analysis of the synthesized ZrO2 ion exchanger is represented in Figure 1. Figure 1 shows a broad transmittance peak in the range of 3600-2500 and ~1640 cm-1, which could be assigned to the stretching and the bending modes of water molecules adsorbed on ZrO2 sample [12,13]. The transmittance peak in the range of 500-45 0 cm-1 may be related to Zr-O bond [12,13]. X-ray diffraction pattern of ZrO2 ion exchang er is rep- resented in Figure 2. This figure manifested that the syn- thesized ZrO2 had a crystalline structure and the ma- Table 1. Chemical resistively of ZrO2 ion exchange material for H2O, acid and base media at 25 1˚C (standard error 0.01 %). Me- dium Concen- tration, M % Solu- bility Medium Concen- tration, M % Solu- bility H2O -- -- 0.1 -- 0.1 0.12 0.5 0.25 0.5 0.19 1.0 1.52 1.0 0.25 2.0 3.50 2.0 1.70 4.0 5.40 4.0 2.50 NaOH 6.0 25.25 HNO3 6.0 13.0 0.1 0.15 0.1 -- 0.5 2.5 0.5 0.12 1.0 15.52 1.0 0.22 2.0 18.50 2.0 1.20 4.0 20.23 4.0 2.80 KOH 6.0 26.22 HCl 6.0 4.90 Figure 1. Infrared spectrum of ZrO2 ion ex chang er at 25 1˚C. Figure 2. X-ray diffraction pattern of ZrO2 ion exchanger at 25 1˚C. terial is present in one phase Figure 2. According to Joint Committee for Powder Standard Diffraction (JCPSD) the peaks well matched with these peaks of the hexagonal cards that means ZrO2 was belong to hexago- nal system. Differential thermal and Thermogravimetric analyses for ZrO2 is represented in Figure 3. Figure 3 indicated two endothermic peaks at 92 and 380˚C that may be re- lated to dehydration of free water and interstitial water, respectively. From TG curve we found that the weight firstly is high related to loss of water, then there are gradually stable in the curve during the heating process. These data confirm the thermal stability of ZrO2 com- pared to other organic and inorganic ion exchanger. Also, these data indicates the suitability of application of ZrO2 at higher temperatures. The surface area value of ZrO2 was found to be 33.44 m2/g as determined by the BET adsorption of nitrogen gas. Preliminary studies for the time required for equilib- rium of the studied cations on ZrO2 ion exchange mate- rial was carried out and the results indicated the equilib- rium was attained within 3 h. Wavenumber (cm-1)  M. M. A. Mesala m Copyright © 2011 SciRes. ACES 23 Figure 3. DTA and TG curves for ZrO2 ion exchanger. The capacity of ZrO2 ion exchanger for Na+, Cu2+, Ni2+ and Zn2+ ions was carried out by equilibrium batch technique and the data was represented in Table 2. The data in Table 2 shows that the selectivity sequence of ZrO2 for the studied cations was fond to Na+ Cu2+ Zn2+ Ni2+. This sequence may be due to the generally stronger electrostatic interactions of divalent cations compared to mono valent ones. Also, this sequence is parallel to the order of ionic radii and stated that the studied cations are absorded in hydrated state [14]. The effect of heating temperature of ion exchanger on ion exchange capacity was studied and the data repre- sented in Table 2. The data indicated that as the heating temperature of ZrO2 increased the capacity for Na+, Cu2+, Ni2+ and Zn2+ ions decreased. This may be due to as the heating temperature increased the loss of water content of ZrO2 are increased as shown in DTA-TG curves (Figure 3). This behaviour can be interpreted by the heating effect. Since, in the early stage of the heating only water molecules present in the cavity of the ex- changer will be lost (cavity water), and by increasing the heating temperature the water molecules present in the structure will be lost during condensation (condensation water) leading to shrinkage in the cavity and channels of the exchanger at higher temperatures [14]. This shrink- age in the structure leads to some strike difficulties and decrease in the number of exchangeable active sites of the exchanger. Effect of pH on the sorption behaviour of various metal ions Cu2+, Ni2+ and Zn2+ (in nitrate form) on ZrO2 ion exchanger was carried out at different pH and the data are represented in Figure 4. The data indicated that the sorption percent of Cu2+, Ni2+ and Zn2+ ions on ZrO2 are increased with increasing the pH of the medium. The Kd values of Cu2+, Ni2+ and Zn2+ on ZrO2 ion ex- changer as a f Figure 5. Non-linear relations between log Kd and pH was observed. When the simple ion exchange proceeds by the fol- lowing reaction unction of pH of solution are represented in Table 2. Capacity of ZrO2 for Na+, Cu2+, Ni2+ and Zn2+ ions at Natural pH , V/m = 100 ml/g and t = 25 1˚C. Capacity, mmol/g Cation At 50˚CAt 200˚C At 400˚C At 600˚C Na+ 1.49 1.22 1.1 0.95 Cu2+ 1.33 1.30 1.15 1.03 Ni2+ 0.80 0.74 0.69 0.55 Zn2+ 0.95 0.88 0.80 0.65 12345 2 3 4 5 6 7 8 9 10 11 Cu2+ Zn2+ Ni2+ Figure 4. Effect of pH of the medium on the sorption per- cent of Cu2+, Zn2+ and Ni2+ ions on ZrO2 ion exchanger at 25 1˚C. nn nH MMnH (7) in sufficiently diluted solution, where activity coeffi- cient may be neglected, the selectivity coefficient can be defined by the following equation [15]; n n MHnn MH KHM (8) where n M and H denote to the concentrations of n M and H ions in the exchanger, respectively, and n M and H are their concentrations in solution. Since the Kd value is the ratio between the metal ion concentration in the exchanger an d in the solu- tion, then n MHd n H KK H (9) Or n MHd n H KK H (10) by taking the logarithm of the two sides n M dH logKlogKHnlog H (11) p H Sorption Percent Temp. oC  M. M. A. Mesala m Copyright © 2011 SciRes. ACES 24 12345 0.3 0.4 0.5 0.6 0.7 0.8 0.9 1.0 1.1 Cu2+ Zn2+ Ni2+ Figure 5. Log Kd of Cu2+, Zn2+ and Ni2+ ions versus pH of medium on ZrO2 ion exchanger at 25 1˚C. When n MH and n MH , the magnitude n MH KH is considered constant, thus Equation (11) can be reduced to d logKC npH (1 2) Which implies that a plot of log Kd versus pH should be linear with a slope (n). Figure 5 shows the depend- ency of log Kd values of Cu2+, Zn2+ and Ni2+ ions on pH of the solution with non-ideality of the exchange reaction for Cu2+, Zn2+ and Ni2+ ions on Zr O2 ion exchanger. The non-ideality results may be due to the presence of other mechanism beside the ion exchange mechanism such as the physical adsorption between the metal ions and the exchanger that could be related to the ionic potential of the cations [15]. The distribution coefficients (Kd) and separation fac- tors () for the mentioned cations in different pH me- dium were calculated and tabulated in Table 3. The data in Table 3 indicated that the distribution coefficients have the affinity sequence Cu2+ > Zn2+ > Ni2+ for ZrO2. This sequence supports the sorption of metal ions in hy- drated state. The separation factors for the studied cations were calculated and indicated that Cu2+ ion can easily separated from Zn2+ and Ni2+ ions in waste water solutions. The nature of adsorption processes for Cu2+ , Zn2+ and Ni2+ ions on ZrO2 were investigated by gradual increase of the sorbate concentration and measuring the amount sorbed at each equ ilibrium concentration. The freu ndlich isotherm most widely used mathematical model, given an empirical expression encompassing the surface het- erogeneity and exponential distribution of active sites and their energies was tested in the following form; Table 3. Distribution coefficients and separation factors for Cu2+, Zn2+and Ni2+ ions on ZrO2 in different pH media at 25 1˚C. pH of medium Parameter Cu2+ Zn2+ Ni2+ Kd, ml/g 3.31 2.282.3 0.690.69 1 Separation factor, 1.01 Kd, ml/g 5.82 4.664.60 0.800.79 2 Separation factor, 1.00 Kd, ml/g 8.93 7.537.18 0.840.81 3 Separation factor, 0.95 Kd, ml/g 9.89 9.058.69 0.920.88 4 Separation factor, 0.96 Kd, ml/g 11.73 9.599.19 0.820.78 5 Separation factor, 0.96 1eq logWmLogKnlog C (13) where W: is the amount uptake, Ceq.: the equilibrium concentration, m: mass of the ion exchanger, and, n and K are the freundlich constants measure the adsorption intensity and adsorption capacity of the sorbent, respec- tively, and computed from the slope and intercept of the linear relationship. Plots of log W/m against log Ceq. linear relationships were obtained for Cu2+, Zn2+ and Ni2+ ions on ZrO2 as shown in Figure 6. The data in Figure 6 show the ap- plicability of freundlich isotherm for Cu2+, Zn2+ an d Ni2+ ions on ZrO2 ions and all of these cations are physically sorbed on ZrO2. The values of adsorption capacity (K) and adsorption intensity (n) for Cu2+, Zn2+ and Ni2+ ions on ZrO2 were computed from the linear relationships in Figure 6 and tabulated in Table 4. As seen from Table 4 the numerical values of (0 < n < 1) suggest the surface of the sorbent of heterogeneous type [16]. Also the numeri- cal value of (n) is only reduced at lower equilibrium concentrations. Freundlich sorption isotherm does not predict any saturation of the solid surface thus envisages infinite surface coverage mathe matically. Similar results were also reported for the adsorption of Table 4. Freundlich constants (n and K) for sorption of Cu2+, Zn2+ and Ni2+ ions on ZrO2 at t = 25 1˚C. Freundlich constants Cations n K Cu2+ 0.71 1.80 10-2 Zn2+ 0.67 7.76 10-3 Ni2+ 0.63 4.17 10-3 Log Kd pH 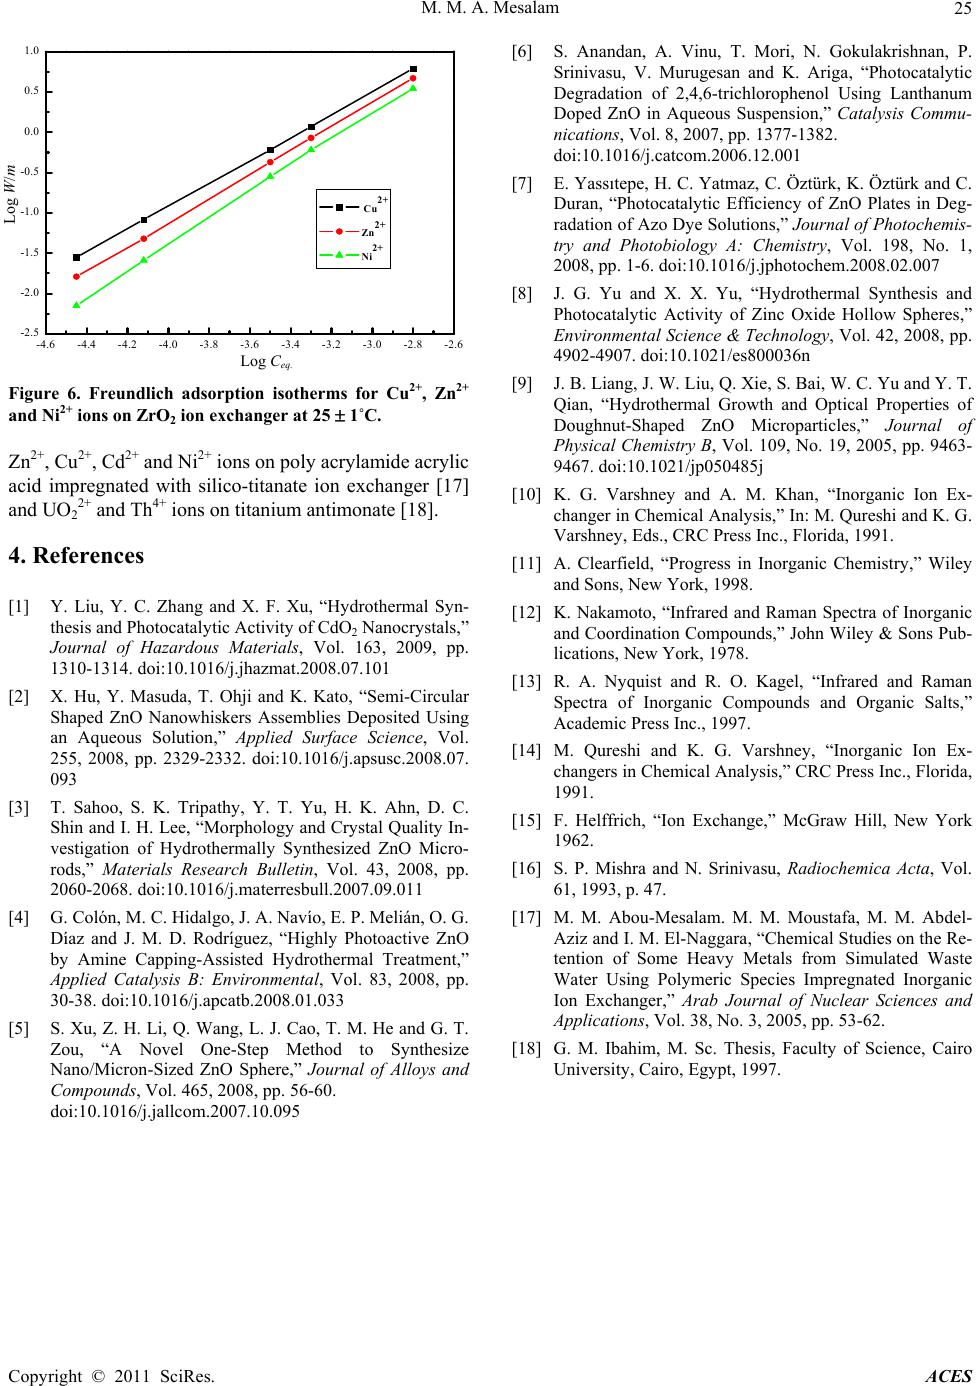 M. M. A. Mesala m Copyright © 2011 SciRes. ACES 25 -4.6 -4.4 -4.2 -4.0 -3.8 -3.6 -3.4 -3.2 -3.0 -2.8 -2.6 -2.5 -2.0 -1.5 -1.0 -0.5 0.0 0.5 1.0 Cu2+ Zn2+ Ni2+ Figure 6. Freundlich adsorption isotherms for Cu2+, Zn2+ and Ni2+ ions on ZrO2 ion exchanger at 25 1˚C. Zn2+, Cu2+, Cd2+ and Ni2+ ions on poly acrylamide acrylic acid impregnated with silico-titanate ion exchanger [17] and UO22+ and Th4+ ions on titan ium antimonate [18]. 4. References [1] Y. Liu, Y. C. Zhang and X. F. Xu, “Hydrothermal Syn- thesis and Photocatalytic Activity of CdO2 Nanocrystals,” Journal of Hazardous Materials, Vol. 163, 2009, pp. 1310-1314. doi:10.1016/j.jhazmat.2008.07.101 [2] X. Hu, Y. Masuda, T. Ohji and K. Kato, “Semi-Circular Shaped ZnO Nanowhiskers Assemblies Deposited Using an Aqueous Solution,” Applied Surface Science, Vol. 255, 2008, pp. 2329-2332. doi:10.1016/j.apsusc.2008.07. 093 [3] T. Sahoo, S. K. Tripathy, Y. T. Yu, H. K. Ahn, D. C. Shin and I. H. Lee, “Morphology and Crystal Quality In- vestigation of Hydrothermally Synthesized ZnO Micro- rods,” Materials Research Bulletin, Vol. 43, 2008, pp. 2060-2068. doi:10.1016/j.materresbull.2007.09.011 [4] G. Colón, M. C. Hidalgo, J. A. Navío, E. P. Melián, O. G. Díaz and J. M. D. Rodríguez, “Highly Photoactive ZnO by Amine Capping-Assisted Hydrothermal Treatment,” Applied Catalysis B: Environmental, Vol. 83, 2008, pp. 30-38. doi:10.1016/j.apcatb.2008.01.033 [5] S. Xu, Z. H. Li, Q. Wang, L. J. Cao, T. M. He and G. T. Zou, “A Novel One-Step Method to Synthesize Nano/Micron-Sized ZnO Sphere,” Journal of Alloys and Compounds, Vol. 465, 2008, pp. 56-60. doi:10.1016/j.jallcom.2007.10.095 [6] S. Anandan, A. Vinu, T. Mori, N. Gokulakrishnan, P. Srinivasu, V. Murugesan and K. Ariga, “Photocatalytic Degradation of 2,4,6-trichlorophenol Using Lanthanum Doped ZnO in Aqueous Suspension,” Catalysis Commu- nications, Vol. 8, 2007, pp. 1377-1382. doi:10.1016/j.catcom.2006.12.001 [7] E. Yassıtepe, H. C. Yatmaz, C. Öztürk, K. Öztürk and C. Duran, “Photocatalytic Efficiency of ZnO Plates in Deg- radation of Azo Dye Solutions,” Journal of Photochemis- try and Photobiology A: Chemistry, Vol. 198, No. 1, 2008, pp. 1-6. doi:10.1016/j.jphotochem.2008.02.007 [8] J. G. Yu and X. X. Yu, “Hydrothermal Synthesis and Photocatalytic Activity of Zinc Oxide Hollow Spheres,” Environmental Science & Technology, Vol. 42, 2008, pp. 4902-4907. doi:10.1021/es800036n [9] J. B. Liang, J. W. Liu, Q. Xie, S. Bai, W. C. Yu and Y. T. Qian, “Hydrothermal Growth and Optical Properties of Doughnut-Shaped ZnO Microparticles,” Journal of Physical Chemistry B, Vol. 109, No. 19, 2005, pp. 9463- 9467. doi:10.1021/jp050485j [10] K. G. Varshney and A. M. Khan, “Inorganic Ion Ex- changer in Chemical Analysis,” In: M. Qureshi and K. G. Varshney, Eds., CRC Press Inc., Florida, 1991. [11] A. Clearfield, “Progress in Inorganic Chemistry,” Wiley and Sons, New York, 1998. [12] K. Nakamoto, “Infrared and Raman Spectra of Inorganic and Coordination Compounds,” John Wiley & Sons Pub- lications, New York, 1978. [13] R. A. Nyquist and R. O. Kagel, “Infrared and Raman Spectra of Inorganic Compounds and Organic Salts,” Academic Press Inc., 1997. [14] M. Qureshi and K. G. Varshney, “Inorganic Ion Ex- changers in Chemical Analysis,” CRC Press Inc., Florida, 1991. [15] F. Helffrich, “Ion Exchange,” McGraw Hill, New York 1962. [16] S. P. Mishra and N. Srinivasu, Radiochemica Acta, Vol. 61, 1993, p. 47. [17] M. M. Abou-Mesalam. M. M. Moustafa, M. M. Abdel- Aziz and I. M. El-Naggara, “Chemical Studies on the Re- tention of Some Heavy Metals from Simulated Waste Water Using Polymeric Species Impregnated Inorganic Ion Exchanger,” Arab Journal of Nuclear Sciences and Applications, Vol. 38, No. 3, 2005, pp. 53-62. [18] G. M. Ibahim, M. Sc. Thesis, Faculty of Science, Cairo University, Cairo, Egypt, 1997. Log Ceq. Log W/m |