Journal of Cancer Therapy, 2013, 4, 1485-1489
Published Online December 2013 (http://www.scirp.org/journal/jct)
http://dx.doi.org/10.4236/jct.2013.410179
Open Access JCT
1485
Clinical Comparison of Pencil Beam Convolution and
Clarkson Algorithms for Dose Calculation
Abdulhamid Chaikh1,2, Jean-Yves Giraud1,2, Jacques Balosso1,2
1Joseph Fourier University, Grenoble, France; 2Department of Radiation Oncology and Medical Physics, Grenoble University Hos-
pital, Grenoble, France.
Email: abdulhamedc@yahoo.com
Received November 26th, 2013; revised December 17th, 2013; accepted December 23rd, 2013
Copyright © 2013 Abdulhamid Chaikh et al. This is an open access article distributed under the Creative Commons Attribution Li-
cense, which permits unrestricted use, distribution, and reproduction in any medium, provided the original work is properly cited. In
accordance of the Creative Commons Attribution License all Copyrights © 2013 are reserved for SCIRP and the owner of the intel-
lectual property Abdulhamid Chaikh et al. All Copyright © 2013 are guarded by law and by SCIRP as a guardian.
ABSTRACT
Purpose: The purpose of this work is to study and quantify the differences in calculated dose computed with two algo-
rithms available in treatment planning systems: Pencil Beam Convolution and Clarkson. Material and Methods: Four
different types of treatment cases were analyzed: lung, head and neck, brain and prostate. For each case, the volume
definition was based on a clinical CT-scan acquisition. The patients were treated with 3-dimensional radiation therapy.
For each patient, 2 treatment plans were generated using exactly the same configuration of beams. In plan 1 and plan 2,
the dose was calculated using the Clarkson and Pencil Beam Convolution algorithms, respectively, without heterogene-
ity correction. To evaluate the treatment plans, the monitor units, isodose curves, dose volume histograms and quality
index were compared. A statistical analysis was carried out using Wilcoxon signed rank test. Results: The difference
observed for monitor unites was 1.2% for lung and less than 1% for head and neck, brain and prostate. Wilcoxon test
showed that there was “no statically significant difference, (p > 0.05)”. The dosimetric parameters derived from dose
volume histograms were higher for organs at risks using Clarkson compared to Pencil Beam Convolution algorithm
inviting clinician to make “safer” prescriptions. For quality index there was no statistically significant difference be-
tween both algorithms for all quality indexes, (p > 0.05). Conclusion: The clinical evaluation of a treatment plan should
be made regarding the calculation algorithm which, in turn, is linked to the experience of the clinician.
Keywords: Treatment Planning; Dose Distribution; Isodose; Monitor Unit; PBC; Clarkson
1. Introduction
Treatment planning is one of the main steps in radio-
therapy. It includes dose, isodose and monitor units
(MUs) calculations. The dose calculation is based on al-
gorithms implemented in treatment planning system
(TPS). For a suitable clinical use, these algorithms must
calculate the dose as accurately as possible. The radio-
therapy department at Grenoble University Hospital was
migrating from the Clarkson-Cunningham algorithm to
the Pencil Beam Convolution (PBC) algorithm. Consid-
ering the change from one algorithm to the other, it was
necessary to verify that the new algorithm will not intro-
duce unexpected results in the clinical practice. So, we
build a study to compare the two algorithms and quantify
the differences in terms of dose to the patients. The
comparisons between older and newer algorithm include
four different clinical situations [1,2]. Monitor unit cal-
culation is a very important step. MUs are directly re-
lated to the dose delivered to the patient. Specific task
groups have recommended comparing the monitor unit
calculation for different kinds of plans in order to con-
firm the validity of monitor unit calculations [3-5]. The
aim of our study was to compare monitor units and dose
distribution obtained with the two algorithms respec-
tively: the Clarkson and the PBC algorithms, and to
evaluate the possible change in the clinical outcome of
treatment plans. The Clarkson method was the most
widely spread method implemented in TPS. Most of the
clinical trials conducted in radiation therapy over the last
decade were done by center using this method. Further-
more, the values of dose limit for organ at risks OARs
were certainly derived from these calculations. The PBC
algorithm is now one of the most commonly available
Clinical Comparison of Pencil Beam Convolution and Clarkson Algorithms for Dose Calculation
1486
algorithms in commercial systems. In the present work,
the dosimetric calculations of the two algorithms are in-
vestigated using four cancer cases. These cases were se-
lected in our clinic. The treatment plans were designed
with the treatment planning systems used in our clinic.
The dose values calculated with the Clarkson algorithm
are the references since this algorithm has been used for
many years in our clinic.
2. Material and Method
2.1. Planning CT Scans and Contouring of
Structures
In order to get the same CT images and the same con-
touring on each treatment planning systems for each
clinical case, clinicians delineated the clinical contours of
target structures and OARs on a specific workstation:
Imago®. We exported the CT images as well as the con-
tours from Imago® to respectively Dosigray® and
Eclipse® using a DICOM RT transfer. For each clinical
case, we constructed similar treatment plans on each TPS.
We checked the similarity of the treatment plans by
comparing volume definitions, beam geometry and MLC-
settings on each TPS. The treatment plans were designed
using a forward planning method. The isocentre was the
point where the dose was prescribed. The isodoses were
normalized at the isocentre. It was located centrally into
the tumor (center of the PTV). So, the dose is prescribed
for each case at a single reference point inside the plan-
ning target volume as recommended by ICRU reports
[6,7].
2.2. Treatment Planning Systems
We used two treatment planning systems (TPS) in this
study Dosigray® (Dosisoft) and Eclipse® (version 8.1.1.8,
Varian medical systems). Dosigray® system uses a
Clarkson model. The Clarkson method separates the dose
into two components: primary and scattered radiations
[8]. It resolves the irregular field into sectors of circular
beams originating at the point of interest in the phantom
or patient. The sector integration method calculates the
dose as the sum of contributions of primary radiation and
of scattered radiation. The Eclipse® system uses the PBC
algorithm. This algorithm is based on a pencil beam ker-
nel convolution. This algorithm compute the dose in the
patient as the superposition of the total energy released
per unit mass with an energy deposition kernel. Kernel
represents the spread of energy from the primary photon
interaction site throughout the volume [9].
2.3. Prescription and Plans Settings for the
Clinical Cases
Lung: 12 field techniques with photon beam 18MV were
used to treat a tumor placed in the mediastina. There
were different gantry angles: 4 anteriors, 2 posteriors, 2
laterals, 4 obliques. The planning target volumes re-
ceived a 60 Gy.
Head and neck: 12 field techniques with photon beam
6MV were used to treat a tumour placed in oral cavity.
There were different gantry angles: six right and six left
fields parallel and opposed two by two were used at 90˚
and 270˚ positions of the Linac arm. The planning target
volumes received a 60.75 Gy.
Brain: 5 oblique fields with photon beam 6MV were
used to treat a right side tumor in the brain. The gantry
angles were: 205˚, 345˚ and 210˚. The planning target
volumes received a 36.4Gy.
Prostate: 10 field techniques with photon beam 18
MV were used to treat the seminal vesicles. Gantry di-
rections were: 1 anterior, 1 posterior, 4 laterals, 4 obli-
ques. The planning target volumes received a 70 Gy.
2.4. Treatment Plans Evaluation
2.4.1. Dosimetric Analysis
In order to evaluate the treatment plans, the following
dosimetric parameters were used:
1) MUs: for each patient, the MUs of plan 1 and 2
were compared for each field.
2) Isodose distribution: we compared the isodose
curves 95% and 100% inside the PTVs.
3) Dose volume histograms (DVH): for each PTV the
minimum dose, mean dose and maximum dose, as well
as the calculated dose delivered to 95% of the PTV vol-
ume (D95) were compared. For each OAR, the minimum
dose, mean dose and maximum dose were compared. We
also compared the dose constraints for each organ at
risks.
4) Quality index: Conformity Index (CI) defined as
the ratio of the minimum dose encompassing the PTV to
the prescribed dose was used to compare the plan con-
formity. Homogeneity Index (HI), defined as the ratio of
the maximum dose in PTV to the prescribed dose was
used to compare the homogeneity dose for PTV. The
PTV Conformity Index (CIPTV), defined as the PTV
volume receiving more than 95% of the prescribed dose
divided by the PTV volume was used to compare the
degree of conformity of the prescribed dose. We used the
geometrical index (g) to compare the geometric confor-
mity to PTV and normal tissues, where g = (VPTV + VNT)/
PTV volumes. VPTV designates the PTV volumes re-
ceiving a dose lower than 100% the prescribed dose.
VNT are the normal tissue volumes receiving 100% of
the prescribed dose [9-11].
2.4.2. Statistical Analysis
Wilcoxon signed rank test was applied to assess the
statically significance of deviations. Language R® (ver-
Open Access JCT
Clinical Comparison of Pencil Beam Convolution and Clarkson Algorithms for Dose Calculation 1487
sion 2.15.2/2012-10-26) was employed to calculate p-
value at alpha error equal to 5%. Data are presented as
interquartile rang/Median; (IQR/M) or Mean ± Standard
Deviation (SD).
3. Results
3.1. Planning CT Scans and Contouring of
Structures
We compared all structures obtained on each TPS and
each treatment case. We did not found significant differ-
ence in the contours of volumes. Furthermore, the vol-
umes of each structure, calculated by the two TPS from
initial contouring are almost equal. This comparison
demonstrated that, the same contours were used in both
methods. So, our comparisons, even if conducted on two
separate TPS, are based on the same volume definition.
3.2. Comparison of Dosimetric Results
1) MUs: the difference between the monitor units
calculated by Clarkson and PBC algorithms were by a
mean of 1.2% (1.8SD), 0.2% (0.9SD), 0.7% (1.6SD) and
0.2% (1.4SD) for lung, head and neck, brain and prostate,
respectively. Wilcoxon test showed that there was no
statically significant difference and p-values were 0.4,
0.2, 0.8 and 0.7 for lung, head and neck, brain and
prostate, respectively. Figure 1 shows the distribution of
beam as a function of percentage of dose difference for
all fields (n = 39). We note that using Clarkson algorithm
in plan 1 compared to PBC algorithm in plan 2, the MUs
were not changed for 23 fields, but the MUs were lower
for 6 fields and higher for 10 fields.
2) Isodose distribution: the 95% isodose curves
calculated in plan 1 and plan 2 included the whole PTVs
whatever its location. The 100% isodose curves enclosed
Figure 1. The distribution of beam as a function of per-
centage of dose difference per MUs for all fields. We note
that using Clarkson algorithm in plans 1 compared to PBC
algorithm in plans 2, the MUs were not changed for 23
fields, but the MUs were lower for 6 fields and higher for 10
fields.
the PTVs using Clarkson more than PBC for brain and
prostate. The 100% isodose curves enclosed the PTVs
using PBC more than Clarkson for brain and prostate.
Figure 2 shows the transverse view for lung, it can be
seen that the 100% isodose line is larger on the PBC
model than on the Clarkson calculation. On a clinical
point of view, this could be evaluated as a better
coverage of the inferior and lateral parts of the tumor
volume than with the Clarkson algorithm. The Clarkson
algorithm showed a reduced dose in the tumor. But with
this algorithm the isodoses expand laterally more than
with the PBC, showing to the clinician a higher dose to
the OARs. We also note that the 20% line calculated by
Clarkson method expands to the left lung (organ at risk)
larger than PBC. This show more doses in the left lung
than calculated by PBC. The 40% isodose line calculated
by Clarkson algorithm expands longitudinally around the
spinal cord. This shows a large dose near and within the
spinal cord.
3) DVH: Tables 1 and 2 summarize the dosimetric
and statistical results for PTVs and OARs. In Table 1, it
Figure 2. Transverse dose distribution for the lung cancer:
a) PBC and b) Clarkson. The 20% and 40% isodose curves
calculated by Clarkson in plan 1 encompass a greater
volume of normal lung tissue and spinal cord, respectively,
compared with PBC algorithm in plan 2.
Table 1. Dose volume parameters for planning target vol-
ume for all patients. Δ is the difference of values between
plans 1 and plans 2. IQR/M: interquartile rang/Median;
D95: the calculated dose delivered to 95% of the PTV vol-
ume and p-value: Wilcoxon signed rank test.
ΔDose %Minimum doseMean dose D95 Maximum dose
IQR/M 1.2 0.6 4.4 0.4
p-value 0.4 0.3 0.5 0.5
Table 2. Dose volume parameters for all organs at risks for
all patients. Δ is the difference of values between plans 1
and plans 2. IQR/M: interquartile rang/Median and p-value:
Wilcoxon signed rank test.
ΔDose % Minimum doseMean dose Maximum dose
IQR/M 1.6 4.0 2.0
p-value <0.001 0.02 <0.001
Open Access JCT
Clinical Comparison of Pencil Beam Convolution and Clarkson Algorithms for Dose Calculation
1488
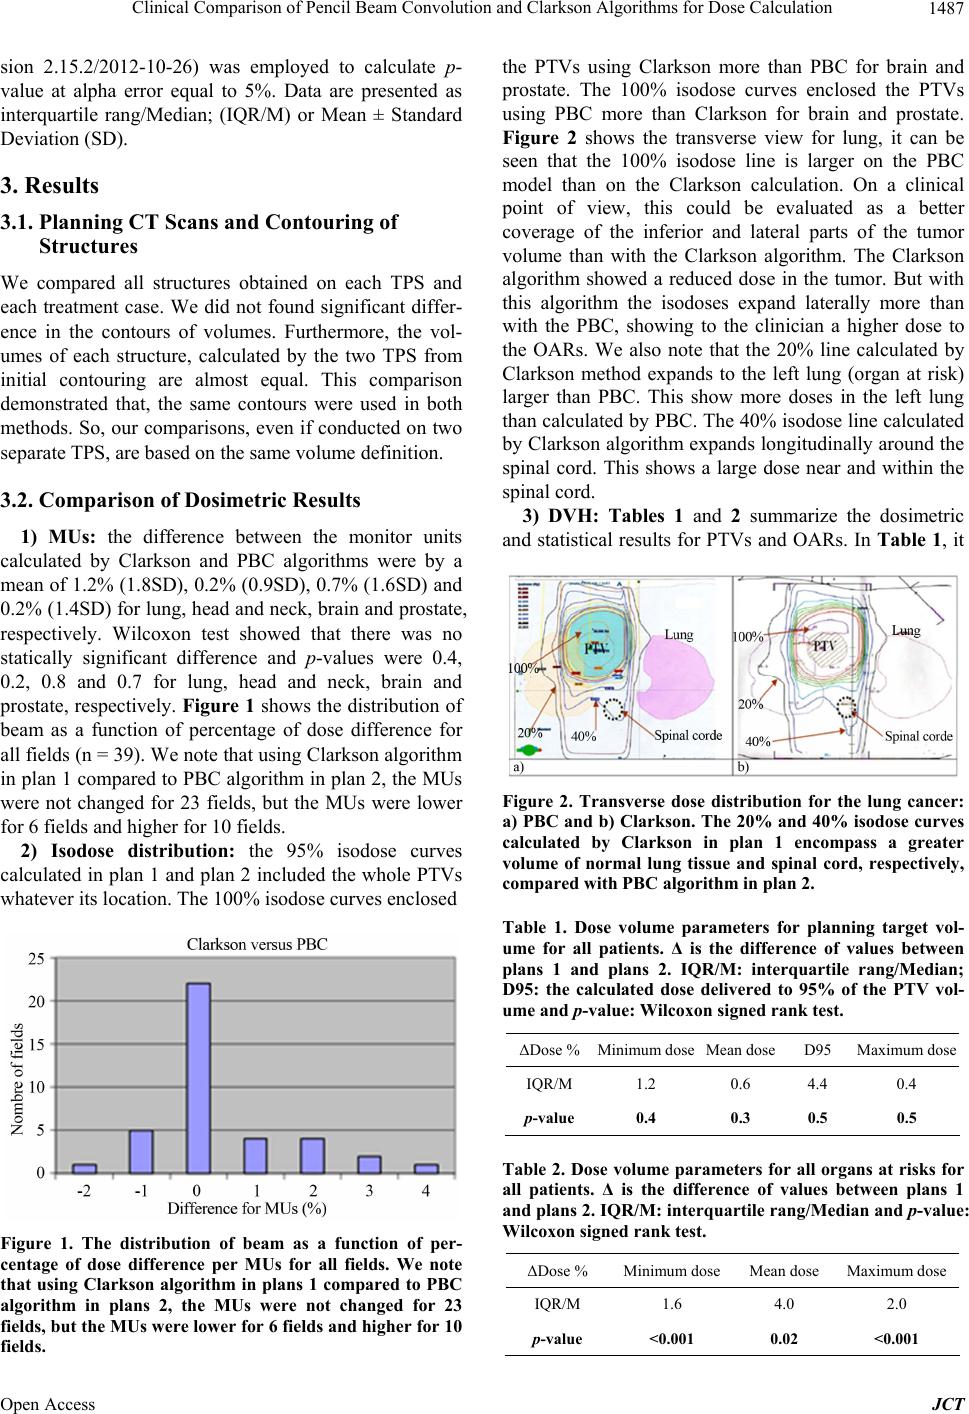
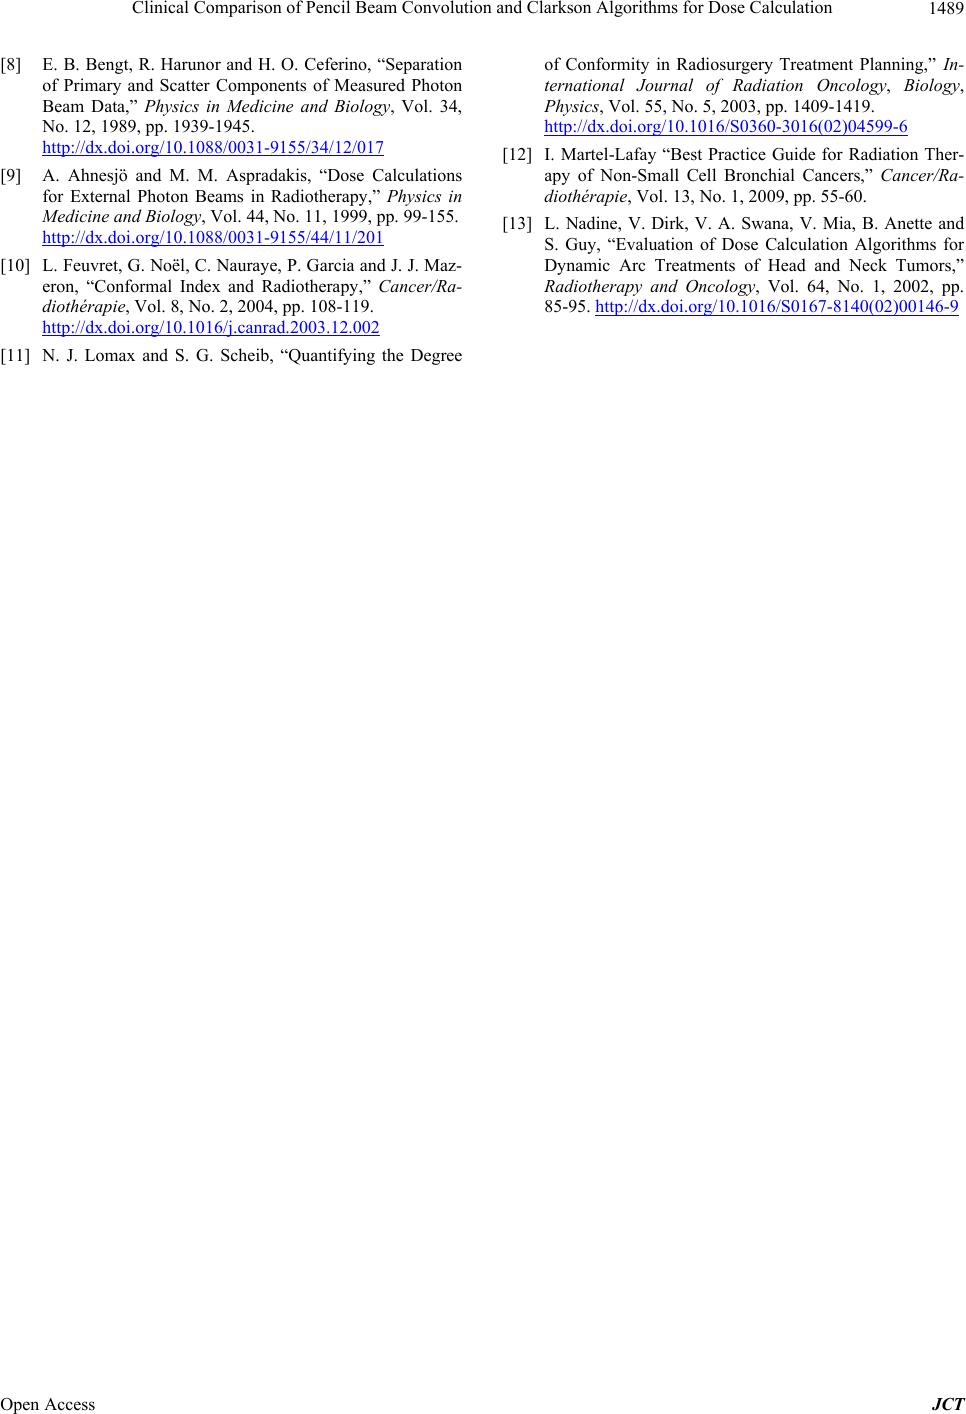
can be seen that the difference between Clarkson and
PBC algorithms for minimum, mean and maximum
doses was less than 1%. Wilcoxon test showed that there
was no statically significant difference, (p > 0.05). In
Table 2, it seems clearly that, the dose calculated for
OARs by Clarkson algorithm was higher than PBC algo-
rithm. The comparison of the dose constraints showed
that the recommendation for dose constraints in all OARs
were respected using the two algorithms.
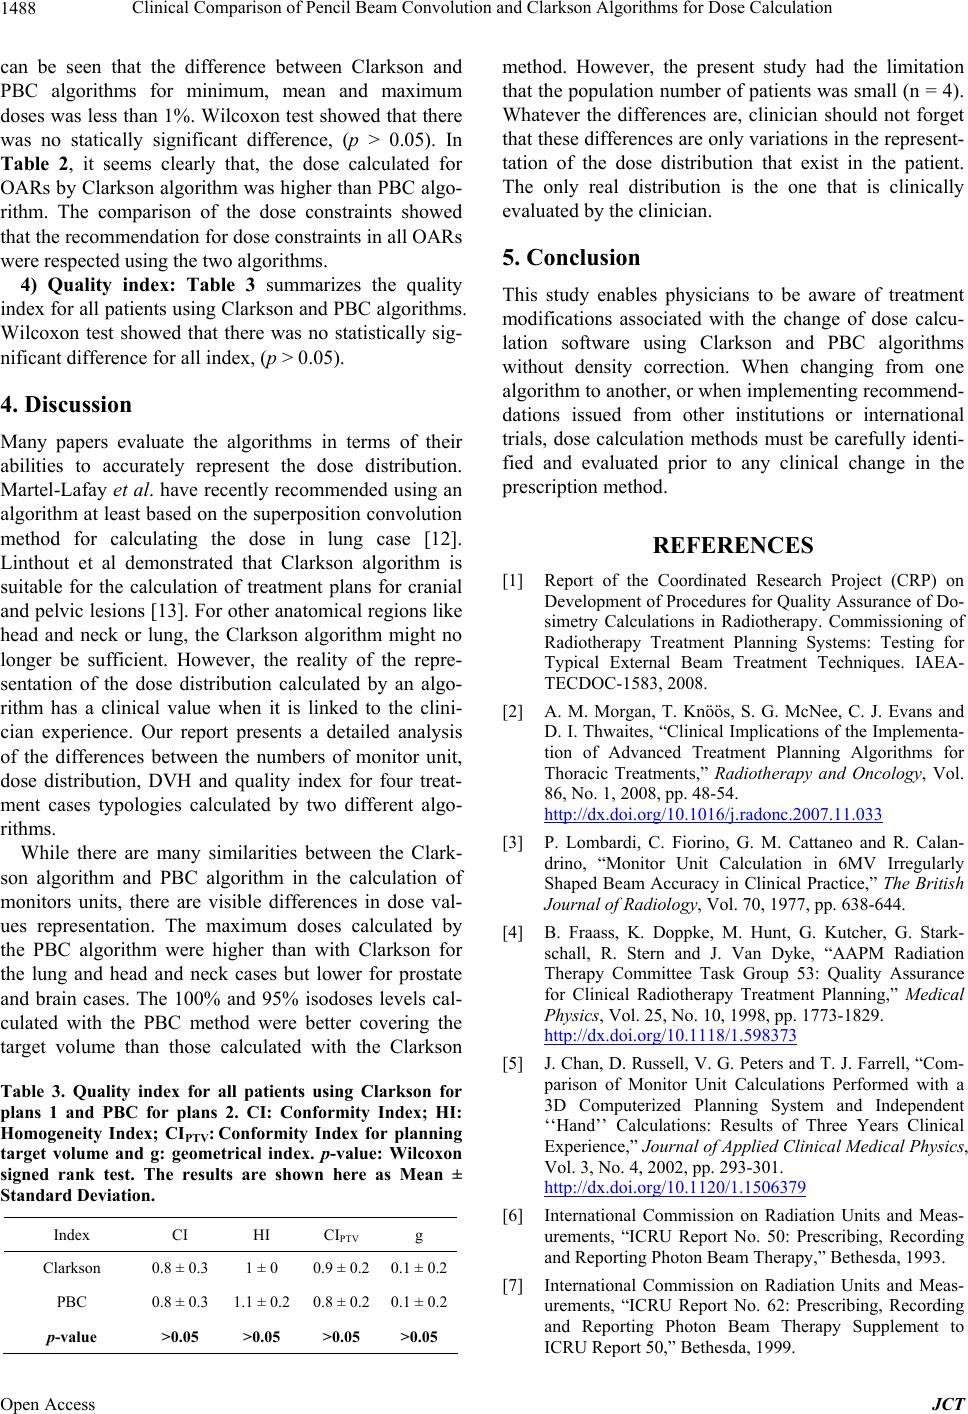
4) Quality index: Table 3 summarizes the quality
index for all patients using Clarkson and PBC algorithms.
Wilcoxon test showed that there was no statistically sig-
nificant difference for all index, (p > 0.05).
4. Discussion
Many papers evaluate the algorithms in terms of their
abilities to accurately represent the dose distribution.
Martel-Lafay et al. have recently recommended using an
algorithm at least based on the superposition convolution
method for calculating the dose in lung case [12].
Linthout et al demonstrated that Clarkson algorithm is
suitable for the calculation of treatment plans for cranial
and pelvic lesions [13]. For other anatomical regions like
head and neck or lung, the Clarkson algorithm might no
longer be sufficient. However, the reality of the repre-
sentation of the dose distribution calculated by an algo-
rithm has a clinical value when it is linked to the clini-
cian experience. Our report presents a detailed analysis
of the differences between the numbers of monitor unit,
dose distribution, DVH and quality index for four treat-
ment cases typologies calculated by two different algo-
rithms.
While there are many similarities between the Clark-
son algorithm and PBC algorithm in the calculation of
monitors units, there are visible differences in dose val-
ues representation. The maximum doses calculated by
the PBC algorithm were higher than with Clarkson for
the lung and head and neck cases but lower for prostate
and brain cases. The 100% and 95% isodoses levels cal-
culated with the PBC method were better covering the
target volume than those calculated with the Clarkson
Table 3. Quality index for all patients using Clarkson for
plans 1 and PBC for plans 2. CI: Conformity Index; HI:
Homogeneity Index; CIPTV: Conformity Index for planning
target volume and g: geometrical index. p-value: Wilcoxon
signed rank test. The results are shown here as Mean ±
Standard Deviation.
Index CI HI CIPTV g
Clarkson 0.8 ± 0.3 1 ± 0 0.9 ± 0.2 0.1 ± 0.2
PBC 0.8 ± 0.3 1.1 ± 0.2 0.8 ± 0.2 0.1 ± 0.2
p-value >0.05 >0.05 >0.05 >0.05
method. However, the present study had the limitation
that the population number of patients was small (n = 4).
Whatever the differences are, clinician should not forget
that these differences are only variations in the represent-
tation of the dose distribution that exist in the patient.
The only real distribution is the one that is clinically
evaluated by the clinician.
5. Conclusion
This study enables physicians to be aware of treatment
modifications associated with the change of dose calcu-
lation software using Clarkson and PBC algorithms
without density correction. When changing from one
algorithm to another, or when implementing recommend-
dations issued from other institutions or international
trials, dose calculation methods must be carefully identi-
fied and evaluated prior to any clinical change in the
prescription method.
REFERENCES
[1] Report of the Coordinated Research Project (CRP) on
Development of Procedures for Quality Assurance of Do-
simetry Calculations in Radiotherapy. Commissioning of
Radiotherapy Treatment Planning Systems: Testing for
Typical External Beam Treatment Techniques. IAEA-
TECDOC-1583, 2008.
[2] A. M. Morgan, T. Knöös, S. G. McNee, C. J. Evans and
D. I. Thwaites, “Clinical Implications of the Implementa-
tion of Advanced Treatment Planning Algorithms for
Thoracic Treatments,” Radiotherapy and Oncology, Vol.
86, No. 1, 2008, pp. 48-54.
http://dx.doi.org/10.1016/j.radonc.2007.11.033
[3] P. Lombardi, C. Fiorino, G. M. Cattaneo and R. Calan-
drino, “Monitor Unit Calculation in 6MV Irregularly
Shaped Beam Accuracy in Clinical Practice,” The British
Journal of Radiology, Vol. 70, 1977, pp. 638-644.
[4] B. Fraass, K. Doppke, M. Hunt, G. Kutcher, G. Stark-
schall, R. Stern and J. Van Dyke, “AAPM Radiation
Therapy Committee Task Group 53: Quality Assurance
for Clinical Radiotherapy Treatment Planning,” Medical
Physics, Vol. 25, No. 10, 1998, pp. 1773-1829.
http://dx.doi.org/10.1118/1.598373
[5] J. Chan, D. Russell, V. G. Peters and T. J. Farrell, “Com-
parison of Monitor Unit Calculations Performed with a
3D Computerized Planning System and Independent
‘‘Hand’’ Calculations: Results of Three Years Clinical
Experience,” Journal of Applied Clinical Medical Physics,
Vol. 3, No. 4, 2002, pp. 293-301.
http://dx.doi.org/10.1120/1.1506379
[6] International Commission on Radiation Units and Meas-
urements, “ICRU Report No. 50: Prescribing, Recording
and Reporting Photon Beam Therapy,” Bethesda, 1993.
[7] International Commission on Radiation Units and Meas-
urements, “ICRU Report No. 62: Prescribing, Recording
and Reporting Photon Beam Therapy Supplement to
ICRU Report 50,” Bethesda, 1999.
Open Access JCT
Clinical Comparison of Pencil Beam Convolution and Clarkson Algorithms for Dose Calculation
Open Access JCT
1489
[8] E. B. Bengt, R. Harunor and H. O. Ceferino, “Separation
of Primary and Scatter Components of Measured Photon
Beam Data,” Physics in Medicine and Biology, Vol. 34,
No. 12, 1989, pp. 1939-1945.
http://dx.doi.org/10.1088/0031-9155/34/12/017
[9] A. Ahnesjö and M. M. Aspradakis, “Dose Calculations
for External Photon Beams in Radiotherapy,” Physics in
Medicine and Biology, Vol. 44, No. 11, 1999, pp. 99-155.
http://dx.doi.org/10.1088/0031-9155/44/11/201
[10] L. Feuvret, G. Noël, C. Nauraye, P. Garcia and J. J. Maz-
eron, “Conformal Index and Radiotherapy,” Cancer/Ra-
diothérapie, Vol. 8, No. 2, 2004, pp. 108-119.
http://dx.doi.org/10.1016/j.canrad.2003.12.002
[11] N. J. Lomax and S. G. Scheib, “Quantifying the Degree
of Conformity in Radiosurgery Treatment Planning,” In-
ternational Journal of Radiation Oncology, Biology,
Physics, Vol. 55, No. 5, 2003, pp. 1409-1419.
http://dx.doi.org/10.1016/S0360-3016(02)04599-6
[12] I. Martel-Lafay “Best Practice Guide for Radiation Ther-
apy of Non-Small Cell Bronchial Cancers,” Cancer/Ra-
diothérapie, Vol. 13, No. 1, 2009, pp. 55-60.
[13] L. Nadine, V. Dirk, V. A. Swana, V. Mia, B. Anette and
S. Guy, “Evaluation of Dose Calculation Algorithms for
Dynamic Arc Treatments of Head and Neck Tumors,”
Radiotherapy and Oncology, Vol. 64, No. 1, 2002, pp.
85-95. http://dx.doi.org/10.1016/S0167-8140(02)00146-9