 Journal of Building Construction and Planning Research, 2013, 1, 141-152 Published Online December 2013 (http://www.scirp.org/journal/jbcpr) http://dx.doi.org/10.4236/jbcpr.2013.14015 Open Access JBCPR 141 Quality Study of Automated Machine Made Environmentally Friendly Brick (KAB) Sample Using Film Neutron Radiography Technique Khurshed Alam1*, Robiul Islam2, Sudipta Saha1, Nurul Islam1, Syed Azharul Islam2 1Institute of Nuclear Science and Technology, AERE, Savar, Bangladesh; 2Department of Physics, Jahangirnagar University, Savar, Bangladesh. *Corresponding author: alammk1964@yahoo.co.in Received September 20th, 2013; revised November 24th, 2013; accepted December 6th, 2013 Copyright © 2013 Khurshed Alam et al. This is an open access article distributed under the Creative Commons Attribution License, which permits unrestricted use, distribution, and reproduction in any medium, provided the original work is properly cited. In accor- dance of the Creative Commons Attribution License all Copyrights © 2013 are reserved for SCIRP and the owner of the intellectual property Khurshed Alam et al. All Copyright © 2013 are guarded by law and by SCIRP as a guardian. ABSTRACT Neutron radiography (NR) technique has been adopted to study the internal structure and quality of the KAB bricks made by Hoffman kiln method. Thermal neutron radiography facility installed at the tangential beam port of 3 MW TRIGA Mark-II Research Reactor, AERE, Savar, Dhaka, Bangladesh is used in the present study. Measurements were made to determine the internal structure and quality of the automated machine made environmentally friendly brick sample. In this case, optical density/gray values of the neutron radiographic images of the sample have been measured. From these measurements, the porosity, water penetrating height, water penetrating behavior, initial rapid absorption of water (IRA), elemental distribution/homogeneity and incremental water intrusion area in the sample have been found. From the observation of different properties, it is seen that, homogeneity of the Hoffman kiln brick KAB is not perfectly homogeneous and contains small internal porosity; the incremental water intrusion area is very poor, and the water penetrating height through the two edges is higher than the middle part; the initial rapid absorption (IRA) rate is also very poor and the water penetrating behavior of the samples is different as like as stair, capillary, wave and zigzag shape. From these points of view, it is concluded that the quality of the environmentally friendly brick KAB is better. The results obtained and conclusion made in this study can only be compared to the properties of bricks produced under similar conditions with similar raw materials. Keywords: Neutron Radiography Technique; Water Penetrating Height/Behavior; IRA 1. Introduction Neutron Radiography (NR) is a technique of making a picture of the internal details of an object by the selective absorption of a neutron beam by the object. NR uses the basic principles of radiography whereby a beam of radia- tion is modified by an object in its path and the emergent beam is recorded on a photo film (detector). In general, the radiography technique is nothing but a simple process of exposing some objects to an X-ray, gamma-ray, neu- tron beam and some other types of radiation and then attenuated outgoing beam from the object is passing through a special type of photographic film to form im- ages of the objects on the radiographic film or detector. Also it is called a non-destructive testing (NDT) [1] and evaluation technique of testing non-nuclear and nuclear materials and industrial products. NR is an imaging tech- nique which provides images similar to X-ray radiogra- phy and complementary technology for radiation diag- noses. Neutron radiograph gives the information of the internal structure of an object; it can detect light elements, which have large neutron absorption cross-sections like hydrogen and boron; it is completely complementary to other NDT techniques, like X-ray or gamma-ray radiog- raphy. The atoms of the object material scattered or ab- sorbed the radiation and so the beam reaching the detec- tor shows an intensity/gray value pattern representative of the internal structure of the object [2]. Any in-homoge- neity in the object on an internal defect (such as voids,  Quality Study of Automated Machine Made Environmentally Friendly Brick (KAB) Sample Using Film Neutron Radiography Technique 142 cracks, porosity, inclusion, corrosion etc.) and morpho- logical change in the plant pod seeds [3] will show up as change in gray value/radiation intensity reaching the de- tector. Under these techniques, detecting faults in neutron shielding materials, flow visualization: real time neutron radiography, quality control of explosive devices, defects in ceramics materials, aircraft component, surface corro- sion on aluminum, medical and biological applications, investigations of the root soil system, migration/rising of water in various building products/building materials, physical description of water transport in a porous matrix of the sample material, density fluctuations and porosity detection in ceramics etc [4-20]. Clay is a widely avail- able raw material that survives very well in its fired form. Clay brick has been found in the ruins of ancient civiliza- tions [21]. Bhatnagar et al. saw that properties of these bricks are affected as a result of physical, chemical and mineralogical changes [22,23]. Mbumbia et al. investi- gated that compressive strength and water absorption are two major physical properties of brick that are good pre- dictors of bricks ability to resist cracking of face [24]. Few scientists studied that compressive strength is highly affected by firing temperature method of production, and physical, chemical and mineralogical properties of the raw material [22,25]. Water absorption is a measure of available pore space and is expressed as a percentage of the dry brick weight. It is affected by properties of clay, method of manufacturing and degree of firing. Some of the researchers studied that firing shrinkage increases with higher temperatures [26]. The quality depends on the firing temperature and firing time also. Decreasing firing temperature and shortening firing time do not only reduce the cost of production but also increase the pro- ductivity of the factory. Environmental concerns have been raised in some parts of the world where coal is the main power generat- ing sources and where bricks are also the main building material. Most of the scientists believe that fly ash on its own can be an excellent raw material for brick making. This has now been proven and a patent is taken for the manufacture of bricks from fly ash [27]. Many ancient cultures have made useful decorative items such as pottery, figurines, building tiles, and burial containers that become important parts of the archaeo- logical record. The material aspects of clay and ceramic technology, the physical properties of clay and various firing methods can be investigated using archaeometric techniques [28,29]. Properties of bricks are affected as a result of physical, chemical and metrological changes [23,30]. Water absorption is a measure of available pore space and is expressed as a percentage of the dry brick weight. It is affected by properties of clay, method of manufacturing and degree of firing. Water absorption capacity of the brick affects the surface finishing of the brick-laid wall [21,26,31]. Ancient technologists and archaeological material researchers have employed stan- dard techniques such as X-ray radiography, X-ray dif- fraction (XRD), scanning electron microscopy (SEM), and neutron activation analysis (NAA) to study structure and composition of ceramic materials [28,29]. Neutron radiography has been used to detect internal defects in some materials such as ceramics [9], tiles [10] and dif- ferent building industries [11]. The technique is also adopted for the study of water absorption behavior in biopol, jute-reinforced-biopol composite [12] and wood plastic composites [13] etc. In the present work, neutron radiography technique has been adopted to the determi- nation of elemental distribution/homogeneity, porosity, incremental intrusion area of water/water penetrating height and penetrating shape/behavior, and initial rapid absorption (IRA) of water in the sample as well as the quality of automated machine made environmentally friendly KAB brick. 2. Experimental Facility The experimental neutron radiography facility installed at the tangential beam port of 3 MW TRIGA Mark II reactor in the Institute of Nuclear Science and Technol- ogy, Atomic Energy Research Establishment, Savar, Dhaka, Bangladesh. The neutron radiography facility consists of the following devices/equipment. 2.1. Bismuth Filter In the NR facility at TRIGA reactor of BAEC a 15 cm long Bi filter in the tangential beam port is used to reduce the intensity of gamma ray significantly from the beam to prevent the unwanted fogginess in the radiographic im- age. 2.2. Cylindrical Divergent Collimator A cylindrical divergent collimator made of 120 cm long aluminum hollow cylinder with 5 cm and 10 cm diameter at the inner and outer end, respectively, has been inserted in the tangential beam port to collimated neutron beam of the reactor. The advantage of the divergent collimator is that a uniform beam can be projected easily over a large inspection area. Collimators are required to produce a uniform beam and thereby produce adequate image reso- lution capability in a neutron radiography facility. 2.3. Lead Shutter The outer end of the tangential beam tube is equipped with a lead-filled safety shutter and door to provide limited Open Access JBCPR  Quality Study of Automated Machine Made Environmentally Friendly Brick (KAB) Sample Using Film Neutron Radiography Technique Open Access JBCPR 143 gamma shielding. The thickness of lead in the shutter is 24 cm and the diameter of the shutter is 33 cm. 2.4. Beam Stopper A wooden box with dimension of 68 cm × 40 cm × 68 cm has been made with the attachment of four ball bear- ings on the bottom part of it for forward and backward movement in front of the tangential beam port. It looks a wooden box, which contains neutron-shielding materials like paraffin wax and boric acid in 3:1 ratio by weight for neutron shielding. 2.5. Sample and Camera Holder Table There is a sample and camera holder table with both horizontal and vertical movement facility placed in front of the beam line. 2.6. Beam Catcher To absorb transmitted and scattered neutron and gamma radiations a beam catcher with dimension 100 cm × 100 cm × 85 cm has been placed behind the sample and cam- era holding table. A 30 cm × 30 cm × 30 cm hole has been made in the middle of the front face of the beam catcher which coincides with the central axis of the beam port. A 30 cm × 30 cm × 15 cm lead block weighing 125 Kg has been placed at the back side of the hole for gamma shielding. For neutron shielding a mixture of paraffin wax and boric acid has been used in the catcher. The total weight of the beam catcher is 968 Kg. 2.7. Biological Shielding House The emitted neutron and the gamma rays are extremely dangerous for human body. This is why, to prevent these harmful rays to spread over the entire environment a biological shielding house has been built around the NR facility of the tangential beam port. It is made of special concrete containing cement, heavy sand (magnetite, il- menite and ordinary sand) and stone chips in the ratio 1:3:3. Paraffin wax and boric acid in 3:1 ratio by weight were also used inside the biological shielding wall for neutron shielding. The width and height of the biological shielding wall of the facility are ≈ 3.0 ft and 6.5 ft, re- spectively. Details of the NR facility can be found else- where [3,32,33]. The schematic diagram of the neutron radiography facility of 3 MW TRIGA Mark II Reactor, AERE, Savar, Dhaka is shown in Figure 1. 3. Experimental Procedure 3.1. Collection, Preparation and Size of the Sample Sample has been collected from Kapita auto bricks limited located at Joypura, Dhamrai, Dhaka, Bangladesh. Bi Filter Polyboron Object Cassette Beam Stopper Beam Catcher Collimator Reactor Biological Shield NR Facility Shield House Image recording Lead Ring Lead Shutter Figure 1. Schematic diagram of the neutr on radiography facility.  Quality Study of Automated Machine Made Environmentally Friendly Brick (KAB) Sample Using Film Neutron Radiography Technique 144 For final preparation, the sample is polished manually by using series paper, cement block, diamond cutter, and then the sample was dried at daylight/dryer machine until to get the constant weight. The sample is the rectangular shape and its size is 23.000 × 11.360 × 6.540 cm3 and 23.050 × 10.821 × 6.480 cm3 for KAB 1 and KAB 2, re- spectively. In the case of KAB 2 sample, coal is mixtures with the soil and this coal is used to burn it. But in case of KAB 1 sample, coal is used into the brick kiln to burn the sample. 3.2. Loading Converter Foil and Film in the NR Cassette A thin converter (gadolinium metal foil of 25 µm thick- ness) was placed at the back of the X-ray industrial film. The loading of the X-ray industrial film (Agfa structurix D4DW) into the NR cassette (18 cm × 24 cm) is a simple procedure [14]. There are a number of steps to place the industrial X-ray film into the NR cassette to protect the film against daylight and lamplight. 3.3. Placing of Sample and the NR Cassette The sample is placed in close contact with the NR cas- sette and directly on the sample holder table. The NR cassette is placed on the cassette holder table. Both of NR cassette and sample are placed in front of the neutron beam having 30 cm in beam diameter. 3.4. Determination of Neutron Beam Exposure Time Exposure means passing of neutron beam through a sam- ple and holding it onto a special film (X-ray industrial film) in order to create a latent image of an object in the emulsion layers of that film. Exposure time differs for different samples, depending on the intensity of the neu- tron beam, density and thickness of the sample and neu- tron cross-section. The optimum exposure time of the sample was determined by taking a series of experi- ments/radiographs at different exposure time, while the reactor was operated at 250 KW. For the present experi- ment we found the optimum exposure time is 60 minutes. The sample was then irradiated for that optimum time to obtain good neutron radiographs. 3.5. Immersion Procedure of the Brick Sample The brick sample is placed in a plastic pan and a constant 2.0 cm height of water level is maintained. The water level is observed very carefully and adds extra water to maintain water level at 2 cm during the immersion time. After time of interest (TOI) such as 5, 10, 15 and 20 min- utes brick sample take off from the pan and extra water of out side the sample is removed by using the tissue paper. 3.6. Obtained Radiographic Images of the Sample 3.6.1. Irradiation While all the procedures (a-e) were performed, the neu- tron beam was disclosed by removing the wooden plug, lead plug and beam stopper from the front side of the collimator. Each sample was then irradiating for the op- timum time (60 min) one by one at various immersion time. 3.6.2. Developing Developing is an image processing technique by which the latent image recorded during the exposure of the ma- terial is converted into a silver image [34]. Developing process is completed at 20˚C for 5 minutes. 3.6.3. Fi xing When the developing is completed a conventional pho- tographic material must be treated in an acid stop bath or it must be rinsed in water, after which it is treated in a fixation bath. The fixation solution will dissolve the un- exposed silver-halide crystals leaving only the silver grains in the gelatin. The fixing is completed with in 5 minutes and controls the fixture temperature at 20˚C. 3.6.4. Wa sh i ng In between developing and fixing the radiographic film, it is necessary to wash for 1 minute at flowing tap water. 3.6.5. Fi nal Washing The silver compound which was formed during the fix- ing stage must be removed, since they can affect the sil- ver image at the latter stage. For this reason the film must be washed thoroughly in flowing tap water for 15 min- utes after completion of developing and fixing process. 3.6.6. Dr y i ng After the final washing, the films were dried by clipping in a hanger at fresh air/or in a drying cabinet. After developing, washing, fixing and the final wash- ing obtained radiographic images (Figures 2 and 3) of the required KAB brick sample at different immersion time. 4. Mathematical Formulation 4.1. Optical Density Measurement The neutron intensity before reaching the brick sample (object) is different from the intensity of the neutron after passing through it. The relationship between these two intensities is expressed through the following equation [15] Open Access JBCPR 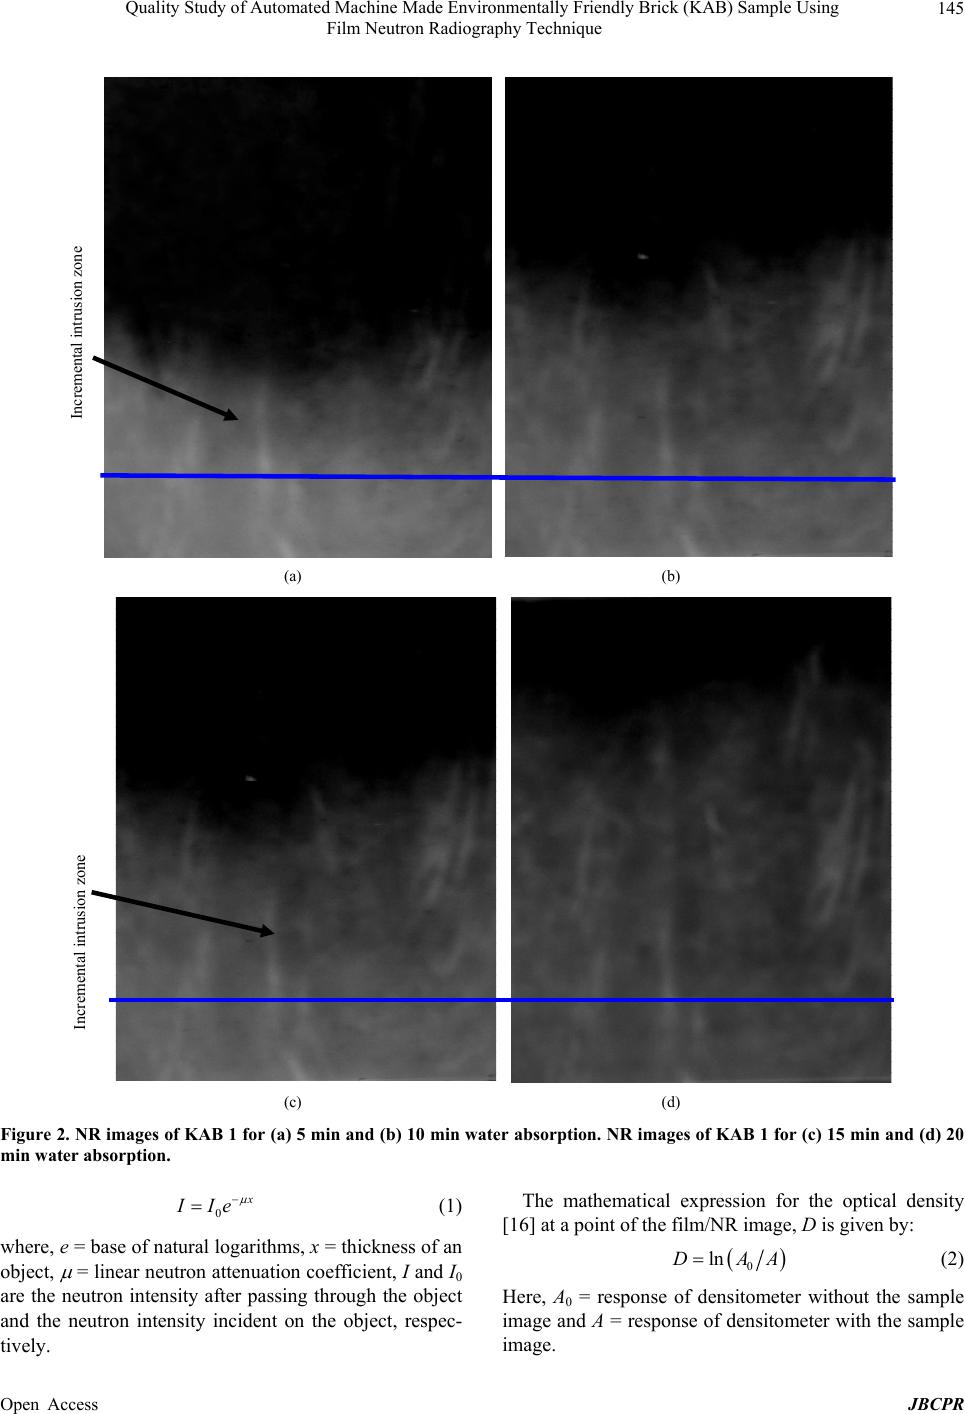 Quality Study of Automated Machine Made Environmentally Friendly Brick (KAB) Sample Using Film Neutron Radiography Technique 145 Incremental intrusion zone (a) (b) Incremental intrusion zone (c) (d) Figure 2. NR images of KAB 1 for (a) 5 min and (b) 10 min water absorption. NR images of KAB 1 for (c) 15 min and (d) 20 min water absorption. 0 Ie (1) where, e = base of natural logarithms, x = thickness of an object, = linear neutron attenuation coefficient, I and I0 are the neutron intensity after passing through the object and the neutron intensity incident on the object, respec- tively. The mathematical expression for the optical density [16] at a point of the film/NR image, D is given by: 0 lnDAA (2) Here, A0 = response of densitometer without the sample image and A = response of densitometer with the sample mage. i Open Access JBCPR 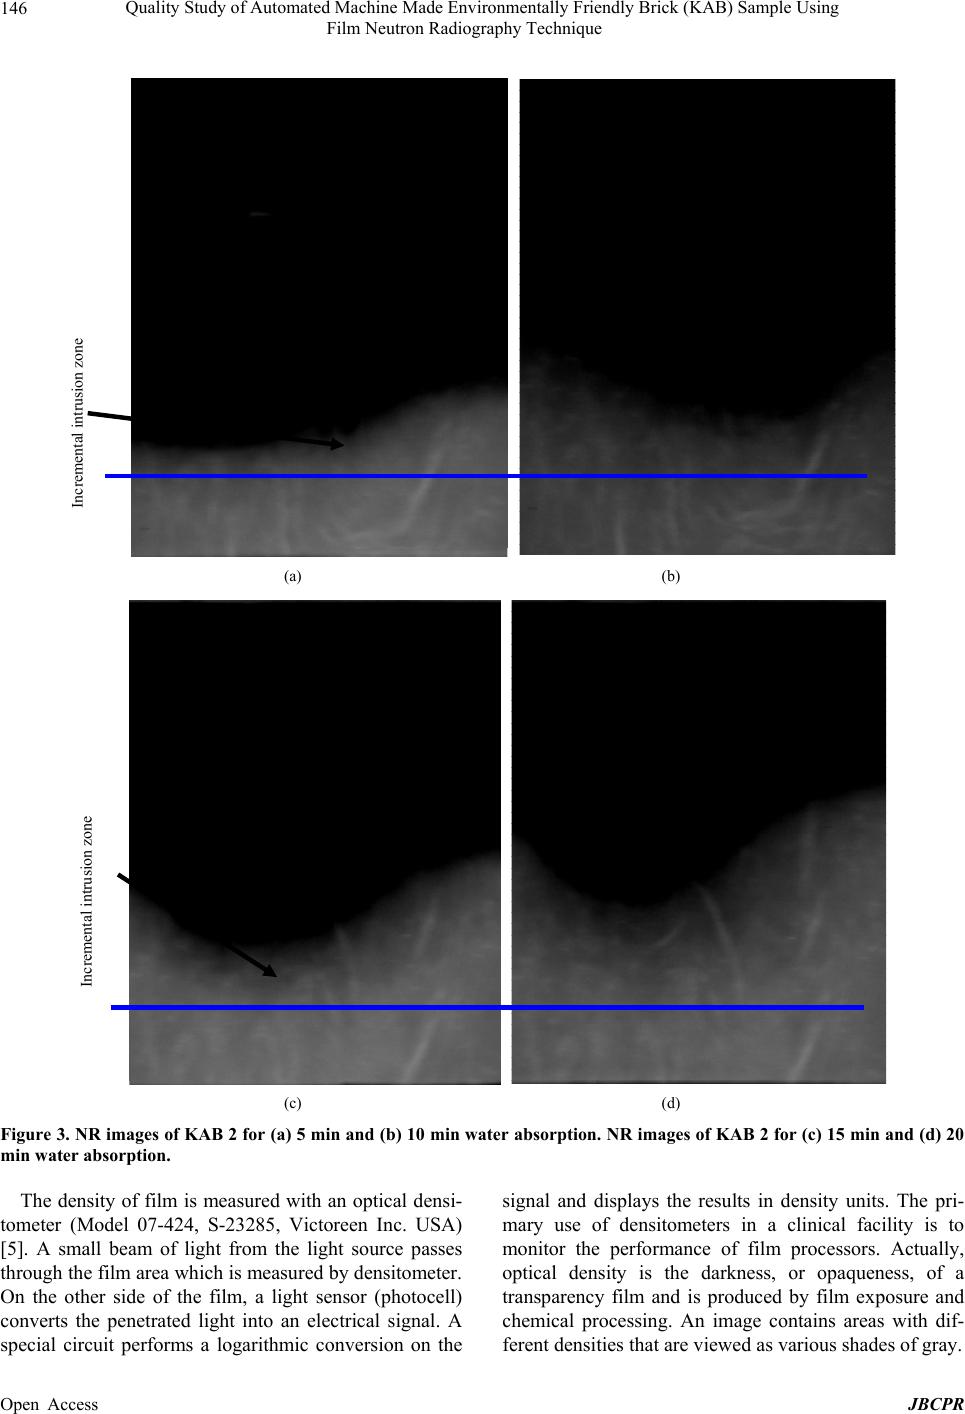 Quality Study of Automated Machine Made Environmentally Friendly Brick (KAB) Sample Using Film Neutron Radiography Technique 146 Incremental intrusion zone (a) (b) Incremental intrusion zone (c) (d) Figure 3. NR images of KAB 2 for (a) 5 min and (b) 10 min water absorption. NR images of KAB 2 for (c) 15 min and (d) 20 min water absorption. The density of film is measured with an optical densi- tometer (Model 07-424, S-23285, Victoreen Inc. USA) [5]. A small beam of light from the light source passes through the film area which is measured by densitometer. On the other side of the film, a light sensor (photocell) converts the penetrated light into an electrical signal. A special circuit performs a logarithmic conversion on the signal and displays the results in density units. The pri- mary use of densitometers in a clinical facility is to monitor the performance of film processors. Actually, optical density is the darkness, or opaqueness, of a transparency film and is produced by film exposure and chemical processing. An image contains areas with dif- ferent densities that are viewed as various shades of gray. Open Access JBCPR  Quality Study of Automated Machine Made Environmentally Friendly Brick (KAB) Sample Using Film Neutron Radiography Technique 147 4.2. Gray Value The visual appearance of an image is generally charac- terized by two properties such as brightness and contrast. Brightness refers to the overall intensity level and is therefore influenced by the individual gray-level (inten- sity) values of all the pixels within an image. Since a bright image (or sub image) has more pixel gray-level values closer to the higher end of the intensity scale, it is likely to have a higher average intensity value. Contrast in an image is indicated by the ability of the observer to distinguish separate neighboring parts within an image. This ability to see small details around an individual pixel and larger variations within a neighborhood is pro- vided by the spatial intensity variations of adjacent pixels, between two neighboring sub images, or within the entire image. Thus, an image may be bright (due to, for exam- ple, overexposure or too much illumination) with poor contrast if the individual target objects in the image have optical characteristics similar to the background. At the other end of the scale, a dark image may have high con- trast if the background is significantly different from the individual objects within the image, or if separate areas within the image have very different reflectance proper- ties. Although the intensity distribution within any real-life image is unlikely to be purely sinusoidal, these defini- tions provide a basis for comparison. For example, an image that contains pixels with brightness values spread over the entire intensity scale is likely to have better con- trast than the image with pixel gray-level values located within a narrow range. The relationship between the in- tensity spread at the pixel level and the overall appear- ance of an image provides the basis for image enhance- ment by gray-level transformation. The terms gray value and intensity are used synonymously to describe pixel brightness. Actually, the specific relationship between the shades of gray or density and exposure depends on the characteristics of the film emulsion and the process- ing conditions. This gray value is measured using image analysis software Image J [35]. 5. Results and Discussions In the present investigation NR techniques has been adopted to study internal defects such as in-homogeneity, porosity/voids, initial rapid absorption (IRA), water penetrating rate/behavior and incremental intrusion area of automated machine made environmentally friendly KAB bricks. Automated machine made environmentally friendly bricks industry (made by Hybrid Hoffman Kiln method) is established very recently in Bangladesh. The NR techniques allowed us to comment on the quality of this type of brick samples from the measurement of the gray value/optical densities of their neutron radiographic images. 5.1. Porosity/Voids and Homogeneity of the Samples The quality of a brick samples depends on the proper distribution of the contents, porosity, hardiness, water absorption behavior etc. in the sample. In this section, porosity, elemental distribution of the samples has been studied by measuring gray value/intensity from the neu- tron radiographic images of each sample. Variation of gray values of the radiographic images of the samples indicates that the constituent components of the samples are not uniformly distributed and having internal poros- ity. The Figure 4 shows the gray value versus pixel dis- tance plots of radiographic image of the KAB sample. The gray value has been obtained by drawing line profile of 1056 × 1600 pixel area on the radiographic images of an object. From this figure it is observed that in most of the places the variation of gray value is not regular man- ner for KAB 1 but in few places it is regular. It is also observed that KAB 1 sample is not perfectly homogene- ous and contains little porosity because of irregularity of gray value. In the same figure for KAB 2, it is observed that variation of gray value in most of the pixel point is slightly irregular in nature. This shows that most of the regions for KAB 2 is homogeneous and small region is inhomogeneous. Small variation of gray value/intensity indicates the presence of less internal porosity of that place/area. 5.2. Water Penetrating Height at Different Immersion Time of the Samples KAB 2 Water penetrating/rising behavior of the KAB 2 sam- ple at different immersion time such as 5, 10, 15, 20 minutes is shown in Figure 5. From these graph it is ob- served that due to 5 minutes immersion water rises in upward direction is 2.6 cm and 4 cm through two edges and 3 cm at the middle side. In case of 10 minutes, pene- trating of water at the middle place is 4 cm and through the edges this penetration is about 6 - 6.5 cm. For 15 minutes water immersion, the water uptake is 4 cm at middle and at two edges the water uptake is 6.4 - 6.6 cm. For 20 minutes, water uptake is 5 cm at middle and at two edges is 7 - 8 cm. From above investigation it shows that at first 5 minutes the water uptake through the mid- dle is very higher than that of 10, 15 and 20 minutes. Except for first 5 minutes water immersion, water rises through the two edges is higher than the middle part. KAB 1 Open Access JBCPR  Quality Study of Automated Machine Made Environmentally Friendly Brick (KAB) Sample Using Film Neutron Radiography Technique Open Access JBCPR 148 Homogeneity Measurement 90 100 110 120 130 140 150 0246810 Pixel distance (cm) Gray value 12 KAB 2KAB 1 Figure 4. Gray value vs. pixel distance curve. Water penetrating/rising behavior of KAB 2 0 2 4 6 8 10 12 14 0 1.8 3.72 5.64 7.68 9.99 0 2.28 3.51 4.71 6.36 8.07 9.9 10.7 0.09 1.53 2.76 4.89 5.99 9.18 10.6 0 0.87 1.89 3.39 5.19 6.69 8.76 10.7 Sample width (cm) Water rising heig (cm) 05min 10min 15min 20min Figure 5. Water penetrating height at different immersion time for KAB 2. Water penetrating height through the middle zone for KAB1 sample at 5, 10, 15 and 20 minute is 5 cm, 8.1 cm, 8.4 cm and 10.6 cm (Figure 6), respectively. In that case the water rising through the two edges and the middle is almost same for individual immersion case. The relation of incremental intrusion area which is indicated in the Figures 2 and 3 of neutron radiographic images of the KAB samples at different immersion time is directly re- lated to the IRA. mersion zone of the immersed samples. After irradiation of the test (wet) samples KAB 1 & KAB 2, obtained the radiographic images of the wet samples by following the procedure (f) cited in the experimental part on neutron radiographic/Agfa structurix D4DW film as a latent im- age using neutron radiography method. For visualize this image it is transferred to the PC using high resolution camera and is viewed in the computer screen by the im- age analysis software Image J. With the help of this software, the total pixel distance corresponds to the total breath/length/height of the sample is calculated along x/y-axis. From that measurement, the number of pix- els/cm breath or length or height of the sample is found. In the present investigation, the actual water length in a pan is 2 cm. So, by subtracting the actual water absorp- tion zone (height, 2 cm) from the total water absorption zone of the immersed sample, incremental intrusion zone is found. This subtraction is done by the image analysis software. But, black area and gray area can clearly be 5.3. Determination of Incremental Intrusion Zone and Black/Gray Area In the Figures 2 and 3 is indicating the incremental in- trusion zone i.e ., water is entering into a zone/place without encroachment and also shows the blue straight line. This blue line separates the actual immersion zone and the incremental intrusion zone of the immersed sam- ples. Lower zone of the blue line is the actual immersion zone and the upper zone indicates the incremental im- 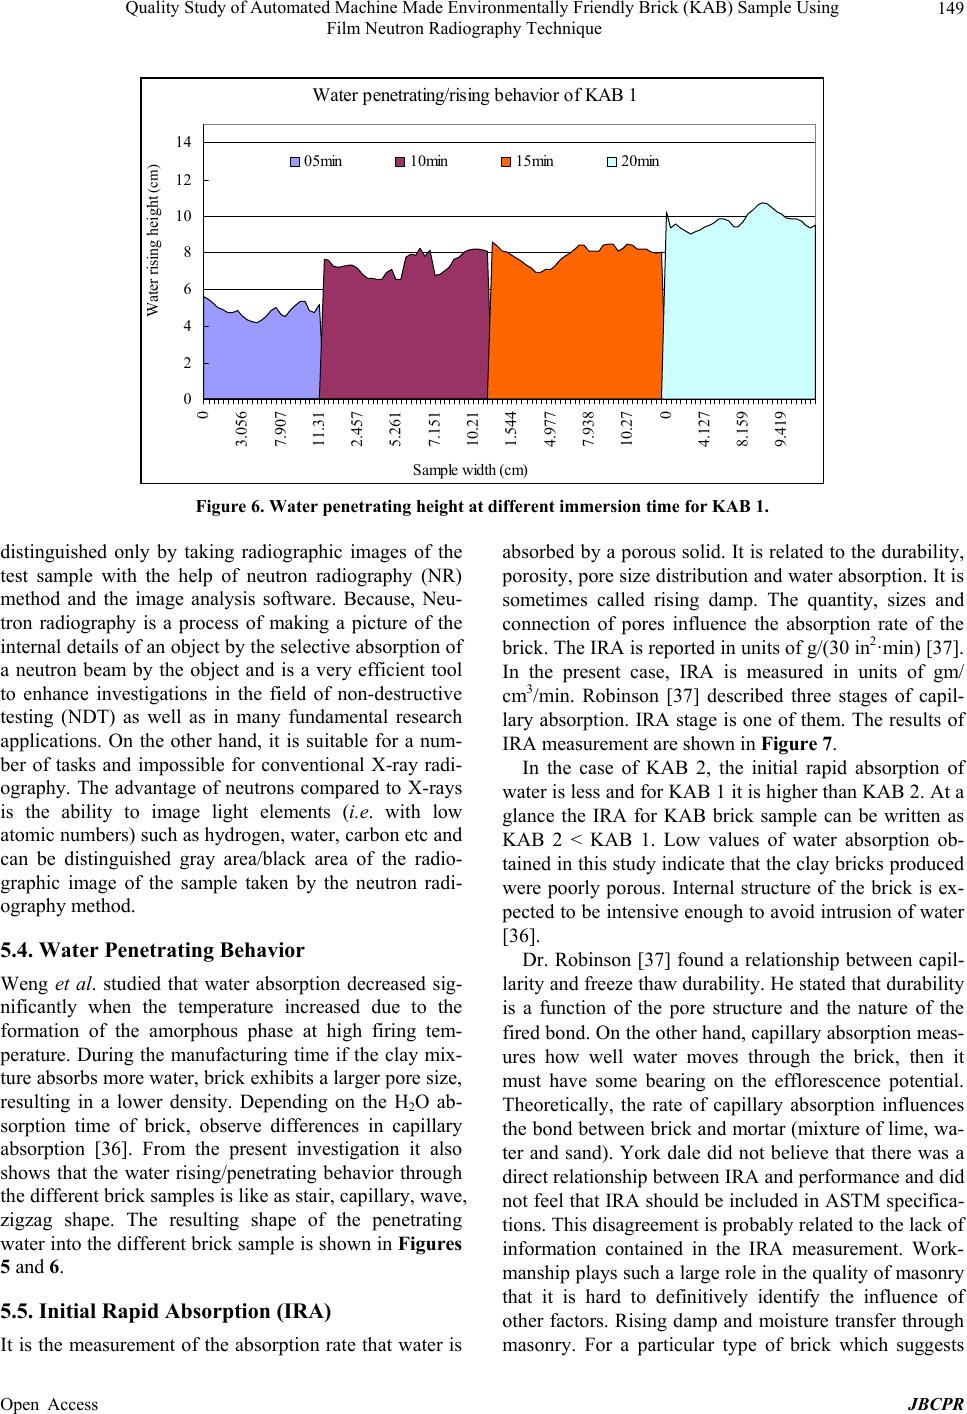 Quality Study of Automated Machine Made Environmentally Friendly Brick (KAB) Sample Using Film Neutron Radiography Technique 149 Water penetrating/rising behavior of KAB 1 0 2 4 6 8 10 12 14 0 3.056 7.907 11.31 2.457 5.261 7.151 10.21 1.544 4.977 7.938 10.27 0 4.127 8.159 9.419 Sample width (cm) Water rising height (c 05min 10min 15min 20min (cm) Figure 6. Water penetrating height at different immersion time for KAB 1. distinguished only by taking radiographic images of the test sample with the help of neutron radiography (NR) method and the image analysis software. Because, Neu- tron radiography is a process of making a picture of the internal details of an object by the selective absorption of a neutron beam by the object and is a very efficient tool to enhance investigations in the field of non-destructive testing (NDT) as well as in many fundamental research applications. On the other hand, it is suitable for a num- ber of tasks and impossible for conventional X-ray radi- ography. The advantage of neutrons compared to X-rays is the ability to image light elements (i.e. with low atomic numbers) such as hydrogen, water, carbon etc and can be distinguished gray area/black area of the radio- graphic image of the sample taken by the neutron radi- ography method. 5.4. Water Penetrating Behavior Weng et al. studied that water absorption decreased sig- nificantly when the temperature increased due to the formation of the amorphous phase at high firing tem- perature. During the manufacturing time if the clay mix- ture absorbs more water, brick exhibits a larger pore size, resulting in a lower density. Depending on the H2O ab- sorption time of brick, observe differences in capillary absorption [36]. From the present investigation it also shows that the water rising/penetrating behavior through the different brick samples is like as stair, capillary, wave, zigzag shape. The resulting shape of the penetrating water into the different brick sample is shown in Figures 5 and 6. 5.5. Initial Rapid Absorption (IRA) It is the measurement of the absorption rate that water is absorbed by a porous solid. It is related to the durability, porosity, pore size distribution and water absorption. It is sometimes called rising damp. The quantity, sizes and connection of pores influence the absorption rate of the brick. The IRA is reported in units of g/(30 in2·min) [37]. In the present case, IRA is measured in units of gm/ cm3/min. Robinson [37] described three stages of capil- lary absorption. IRA stage is one of them. The results of IRA measurement are shown in Fi gure 7. In the case of KAB 2, the initial rapid absorption of water is less and for KAB 1 it is higher than KAB 2. At a glance the IRA for KAB brick sample can be written as KAB 2 < KAB 1. Low values of water absorption ob- tained in this study indicate that the clay bricks produced were poorly porous. Internal structure of the brick is ex- pected to be intensive enough to avoid intrusion of water [36]. Dr. Robinson [37] found a relationship between capil- larity and freeze thaw durability. He stated that durability is a function of the pore structure and the nature of the fired bond. On the other hand, capillary absorption meas- ures how well water moves through the brick, then it must have some bearing on the efflorescence potential. Theoretically, the rate of capillary absorption influences the bond between brick and mortar (mixture of lime, wa- ter and sand). York dale did not believe that there was a direct relationship between IRA and performance and did not feel that IRA should be included in ASTM specifica- tions. This disagreement is probably related to the lack of information contained in the IRA measurement. Work- manship plays such a large role in the quality of masonry that it is hard to definitively identify the influence of other factors. Rising damp and moisture transfer through masonry. For a particular type of brick which suggests Open Access JBCPR 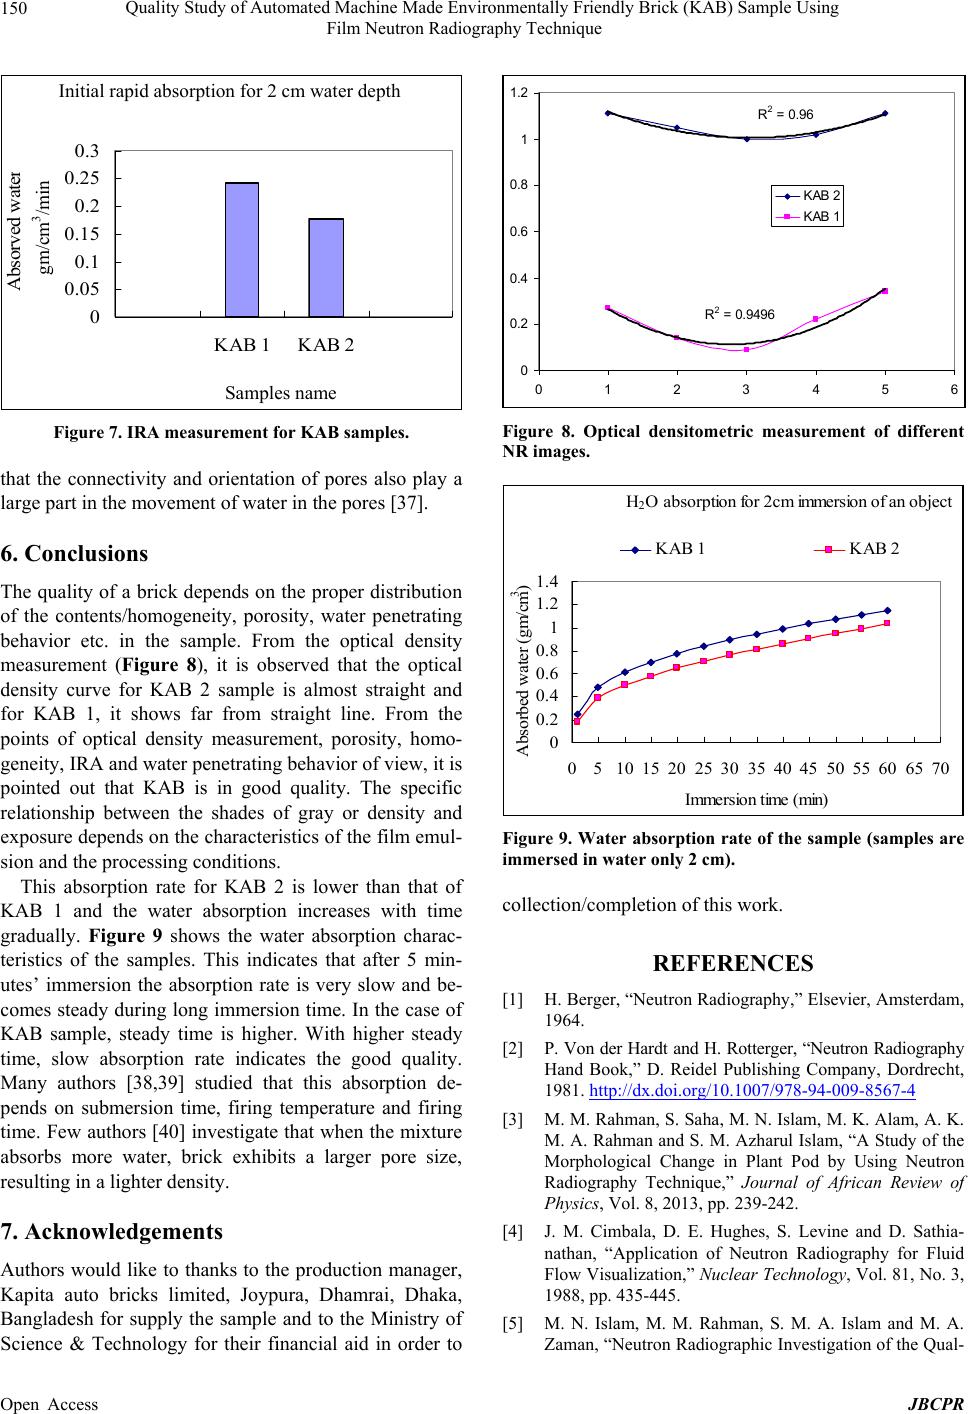 Quality Study of Automated Machine Made Environmentally Friendly Brick (KAB) Sample Using Film Neutron Radiography Technique 150 Initial rapid absorption for 2 cm water depth 0 0.05 0.1 0.15 0.2 0.25 0.3 KAB 1KAB 2 Samples name Absorved wate (gm/cm3/min) gm/cm 3 /min Initial rapid absorption for 2 cm water depth Samples name Figure 7. IRA measurement for KAB samples. that the connectivity and orientation of pores also play a large part in the movement of water in the pores [37]. 6. Conclusions The quality of a brick depends on the proper distribution of the contents/homogeneity, porosity, water penetrating behavior etc. in the sample. From the optical density measurement (Figure 8), it is observed that the optical density curve for KAB 2 sample is almost straight and for KAB 1, it shows far from straight line. From the points of optical density measurement, porosity, homo- geneity, IRA and water penetrating behavior of view, it is pointed out that KAB is in good quality. The specific relationship between the shades of gray or density and exposure depends on the characteristics of the film emul- sion and the processing conditions. This absorption rate for KAB 2 is lower than that of KAB 1 and the water absorption increases with time gradually. Figure 9 shows the water absorption charac- teristics of the samples. This indicates that after 5 min- utes’ immersion the absorption rate is very slow and be- comes steady during long immersion time. In the case of KAB sample, steady time is higher. With higher steady time, slow absorption rate indicates the good quality. Many authors [38,39] studied that this absorption de- pends on submersion time, firing temperature and firing time. Few authors [40] investigate that when the mixture absorbs more water, brick exhibits a larger pore size, resulting in a lighter density. 7. Acknowledgements Authors would like to thanks to the production manager, Kapita auto bricks limited, Joypura, Dhamrai, Dhaka, Bangladesh for supply the sample and to the Ministry of Science & Technology for their financial aid in order to R 2 = 0.96 R 2 = 0.9496 0 0.2 0.4 0.6 0.8 1 1.2 0123456 KAB 2 KAB 1 Figure 8. Optical densitometric measurement of different NR images. H 2 O absorption for 2cm immersion of an object 0 0.2 0.4 0.6 0.8 1 1.2 1.4 0510 15 2025 3035 40 4550 55 6065 70 Immersion time (min) Absorbed water (gm/cm 3 ) KAB 1KAB 2 Figure 9. Water absorption rate of the sample (samples are immersed in water only 2 cm). collection/completion of this work. REFERENCES [1] H. Berger, “Neutron Radiography,” Elsevier, Amsterdam, 1964. [2] P. Von der Hardt and H. Rotterger, “Neutron Radiography Hand Book,” D. Reidel Publishing Company, Dordrecht, 1981. http://dx.doi.org/10.1007/978-94-009-8567-4 [3] M. M. Rahman, S. Saha, M. N. Islam, M. K. Alam, A. K. M. A. Rahman and S. M. Azharul Islam, “A Study of the Morphological Change in Plant Pod by Using Neutron Radiography Technique,” Journal of African Review of Physics, Vol. 8, 2013, pp. 239-242. [4] J. M. Cimbala, D. E. Hughes, S. Levine and D. Sathia- nathan, “Application of Neutron Radiography for Fluid Flow Visualization,” Nuclear Technology, Vol. 81, No. 3, 1988, pp. 435-445. [5] M. N. Islam, M. M. Rahman, S. M. A. Islam and M. A. Zaman, “Neutron Radiographic Investigation of the Qual- Open Access JBCPR  Quality Study of Automated Machine Made Environmentally Friendly Brick (KAB) Sample Using Film Neutron Radiography Technique 151 ity of Some Rubber Samples,” Indian Journal of Pure and Applied Physics, Vol. 38, 2000, pp. 675-680. [6] M. K. Alam and M. A. Khan, “Study of Water Absorp- tion and Internal Defects in Jute Reinforced Biopol Composite Using Digital Neutron Radiography Tech- nique,” Journal of Bangladesh Academy of Sciences, Vol. 30, No. 1, 2006, pp. 29-37. [7] C. Renfrew and P. Bahn, “Archaeology: Theories, Meth- ods and Practice,” Thames and Hudson, New York, 1996. [8] P. Rice, “Pottery Analysis: A Sourcebook,” University of Chicago Press, Chicago, 1987. [9] M. K. Alam, “Comparative Study of Internal Defects in Ceramic Products Using CCD-Camera Based Digital Neutron Radiography Detector,” Bangladesh Journal of Scientific and Industrial Research, Vol. 40, No. 3-4, 2005, p. 169. [10] M. K. Alam, M. N. Islam and M. A. Zaman, “Study of Internal Defects and Water Absorption Behavior of Sin- gle Layer Italian Tiles Using Neutron Radiography Facil- ity of 3 MW TRIGA MARK II Research Reactor,” Jour- nal of Bangladesh Academy of Sciences, Vol. 31, No. 2, 2007, pp. 213-222. [11] M. N. Islam, M. K. Alam, M. A. Zaman, M. H. Ahsan and N. I. Molla, “Application of Neutron Radiography to Building Industries,” Indian Journal of Pure and Applied Physics, Vol. 38, 2000, pp. 348-354. [12] M. K. Alam, M. A. Khan and E. H. Lehmann, “Compara- tive Study of Water Absorption Behavior in Biopol and Jute Reinforced Biopol Composite Using Neutron Radi- ography Technique,” Journal of Reinforced Plastics and Composites, Vol. 25, No. 11, 2006, pp. 1179-1187. http://dx.doi.org/10.1177/0731684406066365 [13] M. N. Islam, M. A. Khan, M. K. Alam, M. A. Zaman and M. Matubayashi, “Study of Water Absorption Behavior in Wood Plastic Composite by Using Neutron Radiography Technique,” Polymer-Plastics Technology and Engineer- ing, Vol. 42, No. 5, 2003, pp. 925-934. http://dx.doi.org/10.1081/PPT-120025004 [14] A. H. Bouma, “Methods for the Study of Sedimentary Structures,” John Wiley and Sons, New York, 1969, p. 140. [15] P. M. Norris, J. S. Brenizer, D. A. Paine and D. A. Bostain, “Measurements of Water Deposition in Aerogel by Neutron Radiography,” Proceedings of 5th World Conference on Neutron Radiography, Berlin, 17-20 June 1996, p. 602. [16] A. A. Harms and D. R. Wyman, “Mathematics and Phys- ics of Neutron Radiography,” D. Reidel Publishing Company, Holland, 1986, p. 22. http://dx.doi.org/10.1007/978-94-015-6937-8 [17] B. Illerhaus, “Proc. Seminar Computer Tomographie: Stand der Technik und Zukunftsaussichten,” Family Readiness Group, Stuttgart, Vol. 29, 1988, p. 15. [18] G. Pfister, A. K. Schatz, C. Siegel, E. Steichele, W. Waschkowski and T. Bucherl, “Nondestructive Testing of Materials and Components by Computerized Tomo- graphy with Fast and Thermal Reactor Neutrons,” Nuclear Science and Engineering, Vol. 110, No. 4, 1992, pp. 303- 315. [19] ASTM-E545-05, “Standard Test Method for Determining Image Quality in Direct Thermal Neutron Radiographic Examination,” 2010. http://www.astm.org/Standards/E545.htm [20] H. P. Leeflang and J. F. W. Margraf, “Detection of Cor- rosion on Air Craft Components by Neutron Radiogra- phy,” Proceedings of the 4th World Conference on NR, Sandiego, 10-16 May 1992, pp. 161-172. [21] S. Prasertsan and T. Theppaya, “A Study toward Energy Saving in Brick Making: Part 1-Key Parameters for En- ergy Saving,” International Energy Journal, Vol. 17, No. 2, 1995, pp. 145-156. [22] J. M. Bhatnagar and R. K. Goel, “Thermal Changes in Clay Products from Alluvial Deposits of the Indo- Gangetic Plains,” Construction and Building Materials, Vol. 16, No. 2, 2002, pp. 113-122. [23] G. Cultrone, E. Sebastian, K. Elert, M. J. Torre, O. Ca- zalla and C. Rodriguez-Navarro, “Influence of Mineral- ogy and Firing Temperature on the Porosity of Bricks,” Journal of the European Ceramic Society, Vol. 24, No. 3, 2004, pp. 547-564. [24] L. Mbumbia, A. M. Wilmars and J. Tirlocq, “Perform- ance Characteristics of Lateritic Soil Bricks Fired at Low Temperatures: A Case Study of Cameroon,” Construction and Building Materials, Vol. 14, No. 3, 2000, pp. 121- 131. http://dx.doi.org/10.1016/S0950-0618(00)00024-6 [25] W. J. MC Burrey, “The Effect of Strength of Brick on Compressive Strength of Brick Masonary Process,” Vol. 2, ASTM, West Conshohocken, 1970, p. 28. [26] “Manufacturing, Classification and Selection of Brick, Manufacturing Part I,” Brick Industry Association, Reston, 1986. [27] O. Kayali and K. J. Shaw, “Manufactured Articles from Fly Ash,” Patent no.PCT/AU03/01533, Australia, Inter- national Patent no. PCT/AU02/00593, European Patent Registration, R. Dhir, T. Dhir and J. Halliday, Eds., Pub- lisher. [28] C. Renfrew and P. Bahn, “Archaeology: Theories, Meth- ods and Practice,” Thames and Hudson, New York, 1996. [29] P. Rice, “Pottery Analysis: A Sourcebook,” University of Chicago Press, Chicago, 1987. [30] S. Bhatnagar and R. K. Goel, “Thermal Changes in Clay Products from Alluvial Deposits of the Indo-Gangetic Plains,” Construction and Building Materials, Vol. 16, No. 2, 2002, pp. 113-122. http://dx.doi.org/10.1016/S0950-0618(01)00031-9 [31] S. L. Marrusin, “Interrior Fissures and Microstructure of Shale Brick,” American Ceramic Society Bulletin, Vol. 64, No. 5, 1985, pp. 674-678. (Turkish Standards Institutions, Ankara, 1979). [32] M. A. Rahman, J. Podder and I. Kamal, “Neutron Radi- ography Facility in Bangladesh Research Reactor,” Pro- ceedings of the 3rd World Conference on Neutron Radi- ography (NR), Osaka, 14-18 May 1989, pp. 179-185. Open Access JBCPR 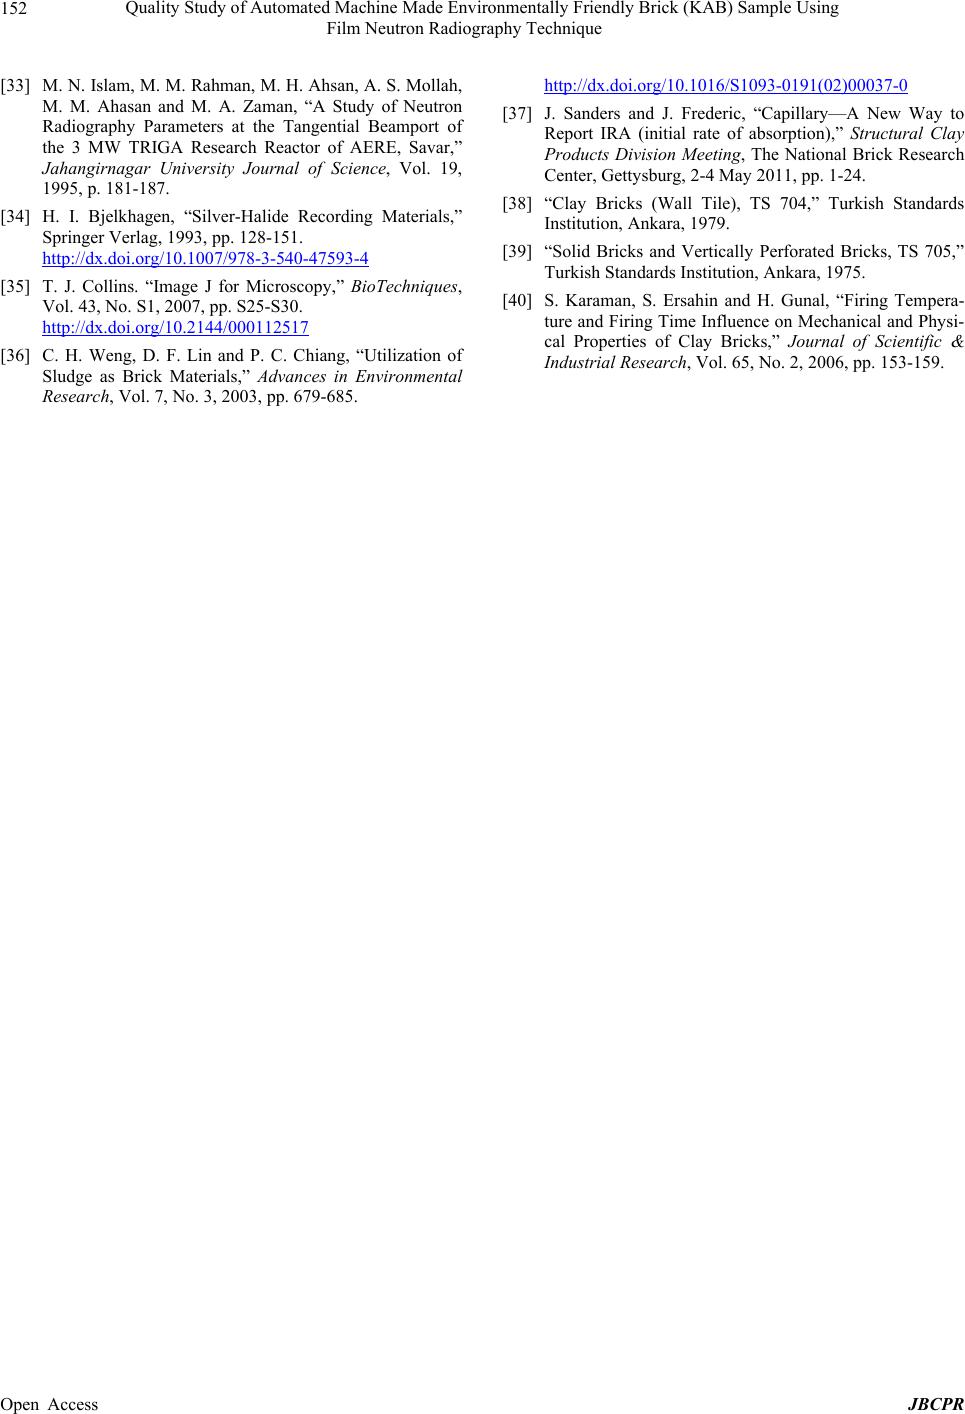 Quality Study of Automated Machine Made Environmentally Friendly Brick (KAB) Sample Using Film Neutron Radiography Technique Open Access JBCPR 152 [33] M. N. Islam, M. M. Rahman, M. H. Ahsan, A. S. Mollah, M. M. Ahasan and M. A. Zaman, “A Study of Neutron Radiography Parameters at the Tangential Beamport of the 3 MW TRIGA Research Reactor of AERE, Savar,” Jahangirnagar University Journal of Science, Vol. 19, 1995, p. 181-187. [34] H. I. Bjelkhagen, “Silver-Halide Recording Materials,” Springer Verlag, 1993, pp. 128-151. http://dx.doi.org/10.1007/978-3-540-47593-4 [35] T. J. Collins. “Image J for Microscopy,” BioTechniques, Vol. 43, No. S1, 2007, pp. S25-S30. http://dx.doi.org/10.2144/000112517 [36] C. H. Weng, D. F. Lin and P. C. Chiang, “Utilization of Sludge as Brick Materials,” Advances in Environmental Research, Vol. 7, No. 3, 2003, pp. 679-685. http://dx.doi.org/10.1016/S1093-0191(02)00037-0 [37] J. Sanders and J. Frederic, “Capillary—A New Way to Report IRA (initial rate of absorption),” Structural Clay Products Division Meeting, The National Brick Research Center, Gettysburg, 2-4 May 2011, pp. 1-24. [38] “Clay Bricks (Wall Tile), TS 704,” Turkish Standards Institution, Ankara, 1979. [39] “Solid Bricks and Vertically Perforated Bricks, TS 705,” Turkish Standards Institution, Ankara, 1975. [40] S. Karaman, S. Ersahin and H. Gunal, “Firing Tempera- ture and Firing Time Influence on Mechanical and Physi- cal Properties of Clay Bricks,” Journal of Scientific & Industrial Research, Vol. 65, No. 2, 2006, pp. 153-159.
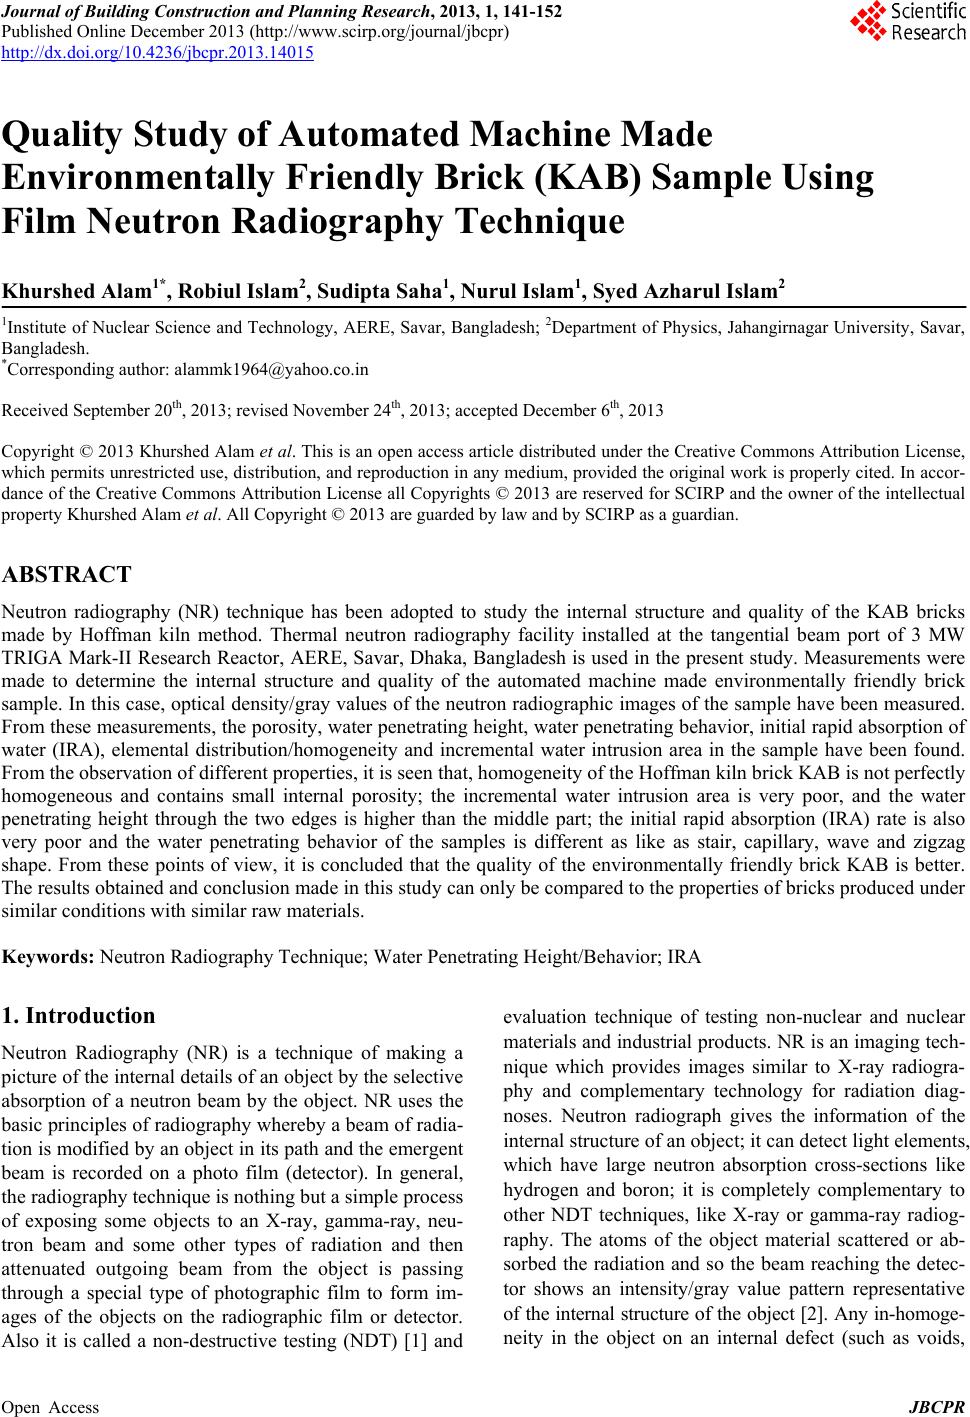
|