 J. Biomedical Science and Engineering, 2013, 6, 1155-1160 JBiSE http://dx.doi.org/10.4236/jbise.2013.612144 Published Online December 2013 (http://www.scirp.org/journal/jbise/) A new approach for HIV-1 protease cleavage site prediction combined with feature selection Yao Yuan1, Hui Liu2*, Guangtao Qiu2 1The Second Department, PLA Communication and Command Academy, Wuhan, China 2Department of Biomedical Engineering, Faculty of Electronic Information and Electrical Engineering, Dalian University of Tech- nology, Dalian, China Email: *liuhui@dlut.edu.cn Received 17 October 2013; revised 25 November 2013; accepted 5 December 2013 Copyright © 2013 Yao Yuan et al. This is an open access article distributed under the Creative Commons Attribution License, which permits unrestricted use, distribution, and reproduction in any medium, provided the original work is properly cited. In accordance of the Creative Commons Attribution License all Copyrights © 2013 are reserved for SCIRP and the owner of the intellectual property Yao Yuan et al. All Copyright © 2013 are guarded by law and by SCIRP as a guardian. ABSTRACT Acquired immunodeficiency syndrome (AIDS) is a fatal disease which highly threatens the health of hu- man being. Human immunodeficiency virus (HIV) is the pathogeny for this disease. Investigating HIV-1 protease cleavage sites can help researchers find or develop protease inhibitors which can restrain the replication of HIV-1, thus resisting AIDS. Feature selection is a new approach for solving the HIV-1 protease cleavage site prediction task and it’s a key point in our research. Comparing with the previous work, there are several advantages in our work. First, a filter method is used to eliminate the redundant features. Second, besides traditional orthogonal en- coding (OE), two kinds of newly proposed features extracted by conducting principal component analysis (PCA) and non-linear Fisher transformation (NLF) on AAind ex database a re used. The two new features are proven to perform better than OE. Third, the data set used here is largely expanded to 1922 samples. Also to improve prediction performance, we conduct parameter optimization for SVM, thus the classifier can obtain better prediction capability. We also fuse the three kinds of features to make sure comprehen- sive feature representation and improve prediction performance. To effectively evaluate the prediction performance of our method, five parameters, which are much more than previous work, are used to con- duct complete comparison. The experimental results of our method show that our method gain better per- formance than the state of art method. This means that the feature selection combined with feature fu- sion and classifier parameter optimization can effec- tively improve HIV-1 cleavage site prediction. More- over, our work can provide useful help for HIV-1 protease inhibitor developing in the future. Keywords: Dimensionality Reduction; Machine Learning; HIV-1 Protease; Feature Fusion 1. INTRODUCTION Acquired immune deficiency syndrome (AIDS) is quite a mortality disease, which is due to the patients’ infection of HIV-1. HIV-1 protease is a key enzyme in the virus replication process, and it cleaves specific kinds of small proteins to smaller peptides which will generate the in- dispensable proteins for the replication process [1]. HIV-1 protease inhibitors can combine with the protease firmly but cannot be cleaved, so the protease will not combine with the substrates and its function will be in- hibited. Nevertheless, it’s not practical to find inhibitors in laboratory by conducting biological experiment, be- cause there are too many kinds of peptides to test one by one. Take octapeptide for example: there are 20 kinds of amino acid residues in nature, thus there are 208 kinds of octapeptides altogether. It’s impossible to test so many octapeptides by biological experiment. Nevertheless, machine learning can be used here to solve the problem [2]. For a machine learning task, feature extraction, di- mensionality reduction, classifier designing and perfor- mance evaluation are of great importance, which will be discussed as follows: octapeptide that contains eight amino acid residues is the research object in the re- search. In previous investigations, researchers proposed different feature extraction methods for octapeptide se- quence which can be mainly divided into two categories: *Corresponding author. OPEN ACCESS  Y. Yuan et al. / J. Biomedical Science and Engineering 6 (2013) 1155-1160 1156 feature extraction based on peptide sequence and phys- icochemical properties [3]. Orthogonal encoding (OE) is a classical feature extraction method based on sequence. Features based on physicochemical properties can be extracted from the Amino Acid Index Database (AAin- dex database) which is a collection of amino acid indices in published papers [4]. The inherently contained char- acteristics of amino acids can provide useful information for the prediction task [5]. Many published bioinformat- ics investigations use data from this database [6-8]. Loris Nanni and his colleague propose two kinds of new phys- icochemical features using principal component analysis (PCA) and non-linear Fisher transformation (NLF) based on this database [9]. The two kinds of new features are compared with OE, and turn out to perform better than OE. For some pattern recognition tasks, if a stand alone method is not good enough, ensembles of features can be conducted to improve classification performance [10]. Thus the three kinds of features are fused in our research to guarantee comprehensive representation. Feature se- lection is mentioned that can improve classification per- formance in their work too, and it’s a key point in this paper. Feature selection is an effective dimensionality reduc- tion method, which is quite different from feature trans- formation. It does not change the original features, but keeps the original structure features and help under- standing the physical meaning of data [11]. It also re- moves redundant features and raises classifier efficiency, thus improving prediction performance [12]. Local pre- serving projection (LPP) is an effective feature transfor- mation method, which retains the meaningful informa- tion and eliminates the redundant information [13]. How- ever, the retained information is saved in the transformed features, difficult to understand. We expect to find the relationship between the retained information and trans- formed features. Thus a feature selection approach called BPFS that approximates LPP is used to find the optimal feature subset [14]. The subset includes features from original features space and contains the meaningful in- formation. BPFS has one severe drawback: the optimal feature number of subset is not clearly defined, and dif- ferent data might obtain their own optimal feature num- ber of subset. In this paper, we conduct complete tests for all subsets with different feature numbers, and calcu- late multiple evaluation parameters to compare their pre- diction performance, based on which to determine the optimal feature number for each kind of original fea- tures. Performance evaluation is much important for a ma- chine learning task, and different evaluation parameters can be used. Loris Nanni and his colleague use euc (1-auc) to evaluate their method, which is equivalent with auc [9,15]. Auc can overall measure the perform- ance of a classifier based on setting different classifica- tion thresholds and calculating corresponding sensitivi- ties and specificities. However, for our HIV-1 protease cleavage site prediction task, the best threshold needs to be determined in order to provide best prediction capa- bility. Matthew’s correlation coefficient (mcc) can per- fectly evaluate the prediction performance of our work using the best classification threshold [16]. It takes sensi- tivity and specificity into consideration at the same time. Also we calculate accuracy, sensitivity, specificity, and auc to better evaluate our work; all of them have their own characteristics and advantages. Especially mcc is the most important evaluation parameter. The rest of this paper is organized as follows: Section 2 introduces the data set and the feature selection method. Section 3 shows the results of experiments and presents the detailed analysis of the results. At last Section 4 pro- vides the conclusion. 2. METHODS 2.1. Data Set There are 208 kinds of octapeptides, which is a very big number. To effectively investigate inhibitor prediction, date set should contain as many samples as possible to make sure the completeness of data set. The bigger data set, the more helpful is the prediction result. In previous papers some classic data sets have been collected and analyzed. The most famous one is the 362 data set which is collected by Cai and Chou [17]. Another relatively bigger one is the 746 data set, which is collected by You, Garwicz and Rognvaldsson [18]. To enlarge the data set, 392 new octapeptides are added to the 362 data set by Hyeoncheol Kim, Tae-Sun Yoon and their colleagues, thus generating a 754-sample data set [19]. The largest data set mentioned in the published investigations is the 1625 data set which is collected by Kontijevskis and his colleagues [20]. To get a larger data set, we fuse all the data sets above and get 3618 samples. After removing contradictory and redundant samples, there are 1922 oc- tapeptides including 596 positive samples and 1326 negative samples. This dataset is called 1922 data set. 2.2. Feature Selection A filter method named BPFS is used here to eliminate the redundant features. BPFS is newly proposed to con- duct feature selection, which transforms the original high-dimensionality features into a lower dimensionality space by a binary projection matrix (all the elements in it are 0 or 1), thus accomplishing feature selection. Corren- tropy is used as the evaluation function. The approach of BPFS is to make sure the correntropy between the subset and the labels of samples is a maximum. Assume there Copyright © 2013 SciRes. OPEN ACCESS  Y. Yuan et al. / J. Biomedical Science and Engineering 6 (2013) 1155-1160 1157 are two data sets 1,, xx and 1,, Yy y which contain N samples. Then the correntropy of X and Y can be calculated according to Eq.1. 22 1 1 ;exp N ii i VXYx y N (1) At the beginning of this algorithm, LPP is carried out to get the mapping matrix C. Assume the data set con- tains n samples. The original feature number of data is d, and the feature number after conducting LPP is p. The feature selection model is like this: a data set dn R contains n samples and each sample is represented by a d-element vector xi; learn a mapping matrix which maximizes the objective func- tion J(W). Here W is a 0-1 matrix. Assume that the n samples in data set belong to Nc different classes and the sample number of the class xi belongs to is ni. pd WR pd Let Y is the data set after feature selection, then Y = WX. J(W) can be represented by the correntropy between Y and C, as shown in Eq.2. arg max,; ,2 W iii i WJWJWVW ng WxC XC 1 1 (2) Here . ,0,Wij For all i and j, , and 11 ,1, , dp ji Wij Wij 22 ,expgx yx y . A series of math operations prove that the task to find the best projection matrix can be converted to a binary programming problem, and we use Hungary algorithm to solve this binary programming problem. A drawback of BPFS is that the inherent dimension of data is not deter- mined, thus the optimal feature number of subset is not affirmed. In the following part, we will determine the best feature number of subsets for each kind of features. 2.3. Optimization for Subset Feature Number BPFS is an effective feature selection method while the feature number of subset need to be set before using it. Thus before conducting BPFS on the three kinds of fea- tures, the optional p values for them should be affirmed. Here p is determined by completely testing all subsets with different p values. Take OE for example, each amino acid residue is represented by a 20-bit vector. Thus an octapeptide sequence is represented by a 160- feature vector, which means the feature number of the original OE data is 160. In the beginning p is set to 1 and BPFS is conducted, then a subset containing one feature is got. Carry out 10-fold cross validation on this subset, compute four evaluation parameters (accuracy, sensitiv- ity, specificity and mcc) and save them. Then p is set to 2 and same work is done as mentioned previously. Each time make sure p is added by 1 and do the work. Repeat this process until p is 160. When all the work is done the evaluation parameters for each value of p is saved, ac- cording to which the optimal p is determined. The principle we follow is to make sure the parameter obtains a relatively high value, and starting from this point all the values following are relatively high. Com- prehensively consider the values of all the parameters for all different subsets and finally determine the optimal p value. For example the original feature number of OE for an octapeptide is 160. Figure 1 shows all the parameter values of different subsets. The abscissa of each sub- graph denotes the feature number of each subset, and the ordinate of each subgraph denotes the value of each evaluation parameter for different subsets. When the subset includes 120 features, the four parameters get relatively high values and the following values are high too. Thus p is set to 120 for OE. For PCA based features, each amino acid residue is represented by a 19-element feature vector, thus an octapeptide sequence can be rep- resented by a 152-feature vector. And for NLF based features, each amino acid residue is represented by an 18-element feature vector, thus an octapeptide sequence can be represented by a 144-feature vector. Repeat the same work for PCA and NLF based features, and the optimal p values for them are 124 and 106. In the fol- lowing part, the prediction capability of the three optimal subsets is examined. 3. EXPERIMENTS AND DISCUSSIONS In order to comprehensively analyze and compare the experiment results, multiple evaluation parameters are used in this paper: accuracy, sensitivity, specificity, mcc and auc. Different from Loris Nanni’s work, in which only euc is used, our work can effectively assess the ex- periment results and provide instruction for HIV-1 pro- tease inhibitors designing. In order to get excellent prediction capability, pa- rameter optimization is conducted for SVM in this paper. The radial basis function (RBF) is chosen as the kernel function in this work. Here accuracy, mcc and auc are separately used to determine the optimal C and g values by 10-fold cross validation. The three parameters are unbiased thus can evaluate the classification performance effectively. The range of C is set between 20 and 25, and the range of g is set between 2−5 and 20. Each time the index of base 2 increases by 0.5 until it reaches the ceil- ing value. The results of parameter optimization are shown in Table 1. The optimal C and g are determined according accuracy, mcc and auc respectively. First we use accuracy to determine the optimal C and g. Then test the prediction performance by 10-fold cross validation and calculate the five evaluation parameters. Table 2 shows the detailed results of each kind of fea- Copyright © 2013 SciRes. OPEN ACCESS  Y. Yuan et al. / J. Biomedical Science and Engineering 6 (2013) 1155-1160 1158 Figure 1. The test results of all possible subsets for OE fea- tures. Table 1. aThe optimal C and g determined according to differ- ent evaluation parameters. Evaluation parameters Features Acc Mcc Auc OE 8, 0.1768 8, 0.1768 2.8284, 0.125 OE_FS 5.6569, 0.1768 32, 0.0442 5.6569, 0.1768 NLF 16, 0.125 16, 0.125 11.3137, 0.1768 NLF_FS 22.6274, 0.0884 8, 0.0625 2.8284, 0.125 PCA 22.6274, 0.0625 11.3137, 0.125 16, 0.125 PCA_FS 4, 0.1768 11.3137, 0.0313 32, 0.1768 All_Fusion 11.3137, 0.0442 22.6274, 0.0313 8, 0.0625 FS_Fusion 5.6569, 0.0442 5.6569, 0.0442 32, 0.0625 aHere OE means the original OE features, and OE_FS means the subset for OE features after feature selection. The PCA and NLF based features are indicated in the same way. The ensemble of three kinds of original features is shown as All_fusion, and the ensemble of the three subsets is shown as FS_Fusion. The two values in each column are the C and g values for SVM respectively. Table 2. Prediction performance of accuracy based optimiza- tion parameters. Evaluation parameters Features Acc Sens Spec Mcc Auc OE 0.9563 0.9161 0.9744 0.8973 0.9905 OE_FS 0.9459 0.9161 0.9593 0.8738 0.9862 NLF 0.9599 0.9312 0.9729 0.9062 0.9909 NLF_FS 0.9553 0.9346 0.9646 0.8959 0.9868 PCA 0.9594 0.948 0.9646 0.906 0.9917 PCA_FS 0.9542 0.9161 0.9713 0.8925 0.9897 All_Fusion 0.9599 0.9362 0.9706 0.9064 0.9914 FS_Fusion 0.9631 0.9362 0.9751 0.9135 0.9923 tures and their fusion combinations. Comparing the five evaluation parameters of original OE, PCA and NLF based features we can find PCA and NLF based features get better prediction performance than OE. PCA based features perform a little better than NLF based features. Ensemble of the three original features can significantly improve prediction capability and performs better than all the single original features. This means fusion of the three kinds of original features can effectively make use of different information contained in the features, thus improving prediction capability. Examining the results of the three subsets for different features, we can find their performances are quite close to their corresponding original features. This means feature selection success- fully eliminates redundant features and preserves infor- mative features thus keeping good prediction capability. Ensemble of the three subsets gets best result in this table, which means it makes sure the redundant features are eliminated and useful features are preserved, and differ- ent kinds of information are effectively used. The results prove that feature fusion of subsets got by feature selec- tion can significantly improve prediction performance. Also mcc is used to optimize SVM parameters here. The prediction results of 10-fold cross validation are shown in Table 3. From this table, we can find the pre- diction capability of original OE, PCA and NLF based features is different: PCA based features gain best results, NLF based features gain little inferior results and the results of OE are not as good as them. This kind of re- sults is consistent with the conclusion got in the previous part: PCA and NLF based features have better prediction capability than OE. This time ensemble of the three kinds of original features significantly improves predic- tion performance again. The results of the three subsets show that they obtain very close prediction capability to their original features. The ensemble of three subsets also gets very good results which are equivalent with the en- semble of three kinds of original features. This means fusion of subsets keep prediction capability as good as original features even though the dimension of feature space is reduced. At last, auc is used to choose the optimal parameters for SVM, and the results of 10-fold is shown in Table 4. From table, we can find that the original OE and NLF based features have equivalent prediction capability, and PCA based features are better than them. Also the results of three subsets are close to their original features. This time the ensemble of three kinds of original features gain slightly inferior results to original PCA based features. The reason for that may be the parameters for SVM are not appropriate enough. Nevertheless, the ensemble of three subsets still gain the best results, which means that feature fusion of the three kinds of features after feature selection is useful and effective for HIV-1 protease Copyright © 2013 SciRes. OPEN ACCESS 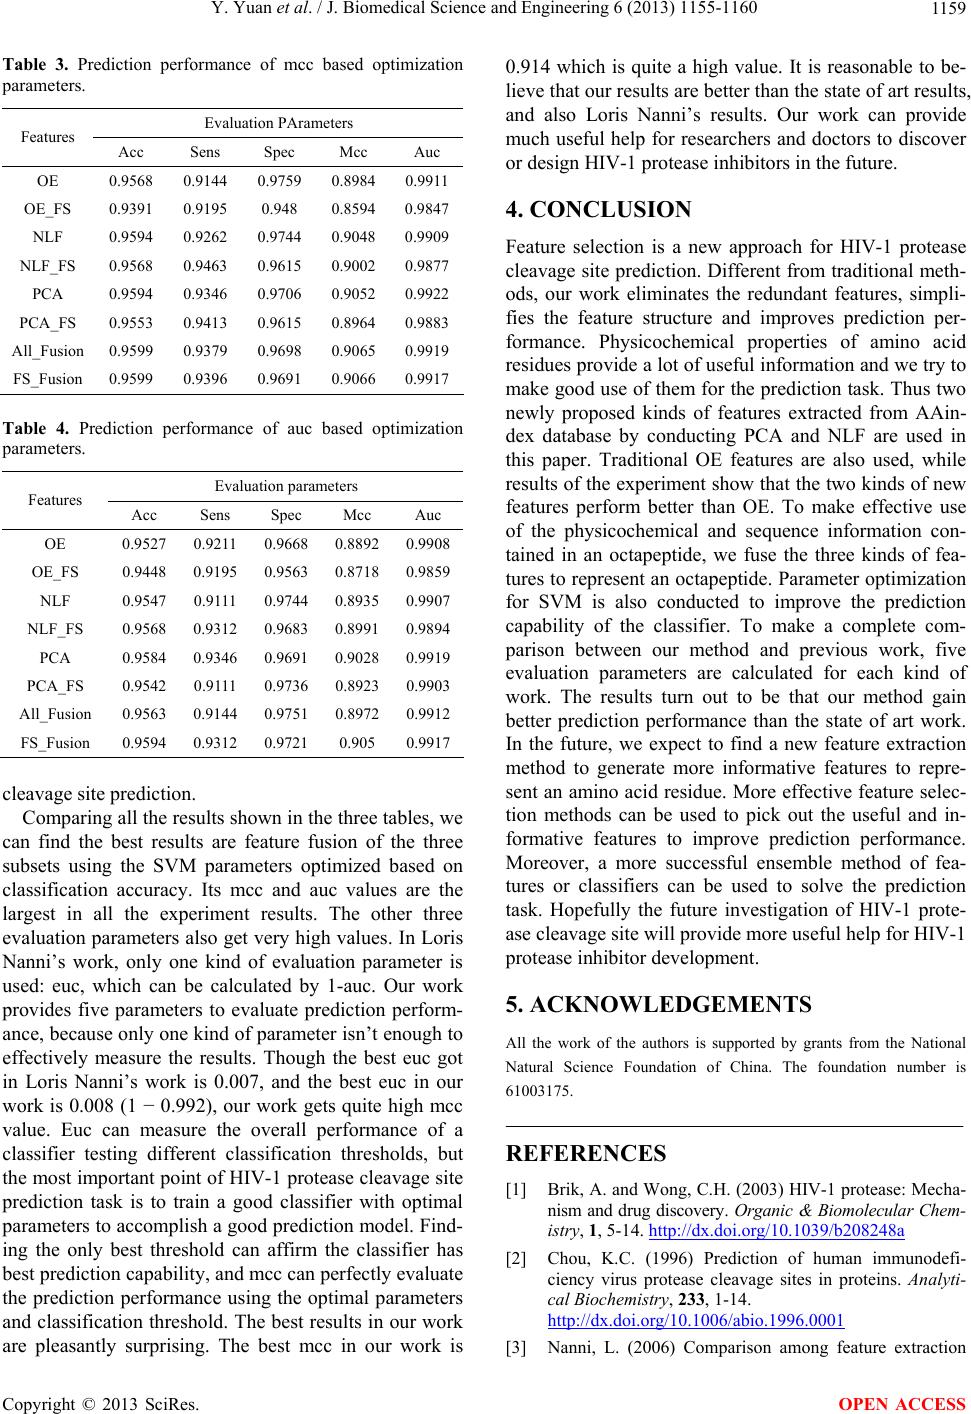 Y. Yuan et al. / J. Biomedical Science and Engineering 6 (2013) 1155-1160 1159 Table 3. Prediction performance of mcc based optimization parameters. Evaluation PArameters Features Acc Sens Spec Mcc Auc OE 0.9568 0.9144 0.9759 0.8984 0.9911 OE_FS 0.9391 0.9195 0.948 0.8594 0.9847 NLF 0.9594 0.9262 0.9744 0.9048 0.9909 NLF_FS 0.9568 0.9463 0.9615 0.9002 0.9877 PCA 0.9594 0.9346 0.9706 0.9052 0.9922 PCA_FS 0.9553 0.9413 0.9615 0.8964 0.9883 All_Fusion 0.9599 0.9379 0.9698 0.9065 0.9919 FS_Fusion 0.9599 0.9396 0.9691 0.9066 0.9917 Table 4. Prediction performance of auc based optimization parameters. Evaluation parameters Features Acc Sens Spec Mcc Auc OE 0.9527 0.9211 0.9668 0.8892 0.9908 OE_FS 0.9448 0.9195 0.9563 0.8718 0.9859 NLF 0.9547 0.9111 0.9744 0.8935 0.9907 NLF_FS 0.9568 0.9312 0.9683 0.8991 0.9894 PCA 0.9584 0.9346 0.9691 0.9028 0.9919 PCA_FS 0.9542 0.9111 0.9736 0.8923 0.9903 All_Fusion 0.9563 0.9144 0.9751 0.8972 0.9912 FS_Fusion 0.9594 0.9312 0.9721 0.905 0.9917 cleavage site prediction. Comparing all the results shown in the three tables, we can find the best results are feature fusion of the three subsets using the SVM parameters optimized based on classification accuracy. Its mcc and auc values are the largest in all the experiment results. The other three evaluation parameters also get very high values. In Loris Nanni’s work, only one kind of evaluation parameter is used: euc, which can be calculated by 1-auc. Our work provides five parameters to evaluate prediction perform- ance, because only one kind of parameter isn’t enough to effectively measure the results. Though the best euc got in Loris Nanni’s work is 0.007, and the best euc in our work is 0.008 (1 − 0.992), our work gets quite high mcc value. Euc can measure the overall performance of a classifier testing different classification thresholds, but the most important point of HIV-1 protease cleavage site prediction task is to train a good classifier with optimal parameters to accomplish a good prediction model. Find- ing the only best threshold can affirm the classifier has best prediction capability, and mcc can perfectly evaluate the prediction performance using the optimal parameters and classification threshold. The best results in our work are pleasantly surprising. The best mcc in our work is 0.914 which is quite a high value. It is reasonable to be- lieve that our results are better than the state of art results, and also Loris Nanni’s results. Our work can provide much useful help for researchers and doctors to discover or design HIV-1 protease inhibitors in the future. 4. CONCLUSION Feature selection is a new approach for HIV-1 protease cleavage site prediction. Different from traditional meth- ods, our work eliminates the redundant features, simpli- fies the feature structure and improves prediction per- formance. Physicochemical properties of amino acid residues provide a lot of useful information and we try to make good use of them for the prediction task. Thus two newly proposed kinds of features extracted from AAin- dex database by conducting PCA and NLF are used in this paper. Traditional OE features are also used, while results of the experiment show that the two kinds of new features perform better than OE. To make effective use of the physicochemical and sequence information con- tained in an octapeptide, we fuse the three kinds of fea- tures to represent an octapeptide. Parameter optimization for SVM is also conducted to improve the prediction capability of the classifier. To make a complete com- parison between our method and previous work, five evaluation parameters are calculated for each kind of work. The results turn out to be that our method gain better prediction performance than the state of art work. In the future, we expect to find a new feature extraction method to generate more informative features to repre- sent an amino acid residue. More effective feature selec- tion methods can be used to pick out the useful and in- formative features to improve prediction performance. Moreover, a more successful ensemble method of fea- tures or classifiers can be used to solve the prediction task. Hopefully the future investigation of HIV-1 prote- ase cleavage site will provide more useful help for HIV-1 protease inhibitor development. 5. ACKNOWLEDGEMENTS All the work of the authors is supported by grants from the National Natural Science Foundation of China. The foundation number is 61003175. REFERENCES [1] Brik, A. and Wong, C.H. (2003) HIV-1 protease: Mecha- nism and drug discovery. Organic & Biomolecular Chem- istry, 1, 5-14. http://dx.doi.org/10.1039/b208248a [2] Chou, K.C. (1996) Prediction of human immunodefi- ciency virus protease cleavage sites in proteins. Analyti- cal Biochemistry, 233, 1-14. http://dx.doi.org/10.1006/abio.1996.0001 [3] Nanni, L. (2006) Comparison among feature extraction Copyright © 2013 SciRes. OPEN ACCESS  Y. Yuan et al. / J. Biomedical Science and Engineering 6 (2013) 1155-1160 Copyright © 2013 SciRes. 1160 OPEN ACCESS methods for HIV-1 protease cleavage site prediction. Pattern Recognition, 39, 711-713. http://dx.doi.org/10.1016/j.patcog.2005.11.002 [4] Kawashima, S., Pokarowski, P., Pokarowska, M., Ko- linski, A., Katayama, T. and Kanehisa, M. (2008) AAin- dex: Amino acid index database, progress report 2008. Nucleic Acids Research , 36, 202-205. http://dx.doi.org/10.1093/nar/gkm998 [5] Niu, B., Lu, L., Liu, L., Gu, T.H., Feng, K.Y., Lu, W.C. and Cai, Y.D. (2009) HIV-1 protease cleavage site pre- diction based on amino acid property. Journal of Com- putational Chemistry, 30, 33-39. http://dx.doi.org/10.1002/jcc.21024 [6] Du, P. and Li, Y. (2006) Prediction of protein submito- chondria locations by hybridizing pseudo-amino acid composition with various physicochemical features of segmented sequence. BMC Bioinformatics, 7, 518. http://dx.doi.org/10.1186/1471-2105-7-518 [7] Nanni, L. and Lumini, A. (2006) MppS: An ensemble of support vector machine based on multiple physicochemi- cal properties of amino acids. Neurocomputing, 69, 1688- 1690. http://dx.doi.org/10.1016/j.neucom.2006.04.001 [8] Sarda, D., Chua, G.H., Li, K.B. and Krishnan, A. (2005) pSLIP: SVM based protein subcellular localization pre- diction using multiple physicochemical properties. BMC Bioinformatics, 6, 152. http://dx.doi.org/10.1186/1471-2105-6-152 [9] Nanni, L. and Lumini, A. (2011) A new encoding tech- nique for peptide classification. Expert Systems with Ap- plications, 38, 3185-3191. http://dx.doi.org/10.1016/j.eswa.2010.09.005 [10] Maclin, R. and Opitz, D. (1999) Popular ensemble meth- ods: An empirical study. Journal of Artificial Intelligence Research, 11, 169-198. [11] Jain, A.K., Duin, R.P.W. and Mao, J. (2000) Statistical pattern recognition: A review. IEEE Transactions on Pat- tern Analysis and Machine Intelligence, 22, 4-37. http://dx.doi.org/10.1109/34.824819 [12] Guyon, I. and Elisseeff, A. (2003) An introduction to variable and feature selection. The Journal of Machine Learning Research, 3, 1157-1182. [13] He, X. and Niyogi, X. (2004) Locality preserving projec- tions. Neural Information Processing Systems, 16, 153. [14] Yan, H., Yuan, X., Yan, S. and Yang, J. (2011) Corren- tropy based feature selection using binary projection. Pat- tern Recognition, 44, 2834-2842. http://dx.doi.org/10.1016/j.patcog.2011.04.014 [15] Bradley, A.P. (1997) The use of the area under the ROC curve in the evaluation of machine learning algorithms. Pattern Recognition, 30, 1145-1159. http://dx.doi.org/10.1016/S0031-3203(96)00142-2 [16] Powers, D.M.W. (2011) Evaluation: From precision, re- call and f-measure to ROC, informedness, markedness & correlation. Journal of Machine Learning Technologies, 2, 37-63. [17] Cai, Y.D. and Chou, K.C. (1998) Artificial neural net- work model for predicting HIV protease cleavage sites in protein. Advances in Engineering Software, 29, 119-128. http://dx.doi.org/10.1016/S0965-9978(98)00046-5 [18] You, L., Garwicz, D. and Rögnvaldsson, T. (2005) Com- prehensive bioinformatic analysis of the specificity of human immunodeficiency virus type 1 protease. Journal of Virology, 79, 12477-12486. http://dx.doi.org/10.1128/JVI.79.19.12477-12486.2005 [19] Kim, H., Yoon, T.S., Zhang, Y., Dikshit, A. and Chen, S.S. (2006) Predictability of rules in HIV-1 protease clea- vage site analysis. Lecture Notes in Computational Sci- ence, 3992, 830-837. [20] Kontijevskis, A., Wikberg, J.E. and Komorowski, J. (2007) Computational proteomics analysis of HIV-1 pro- tease interactome. Proteins: Structure, Function, and Bio- informatics, 68, 305-312. http://dx.doi.org/10.1002/prot.21415
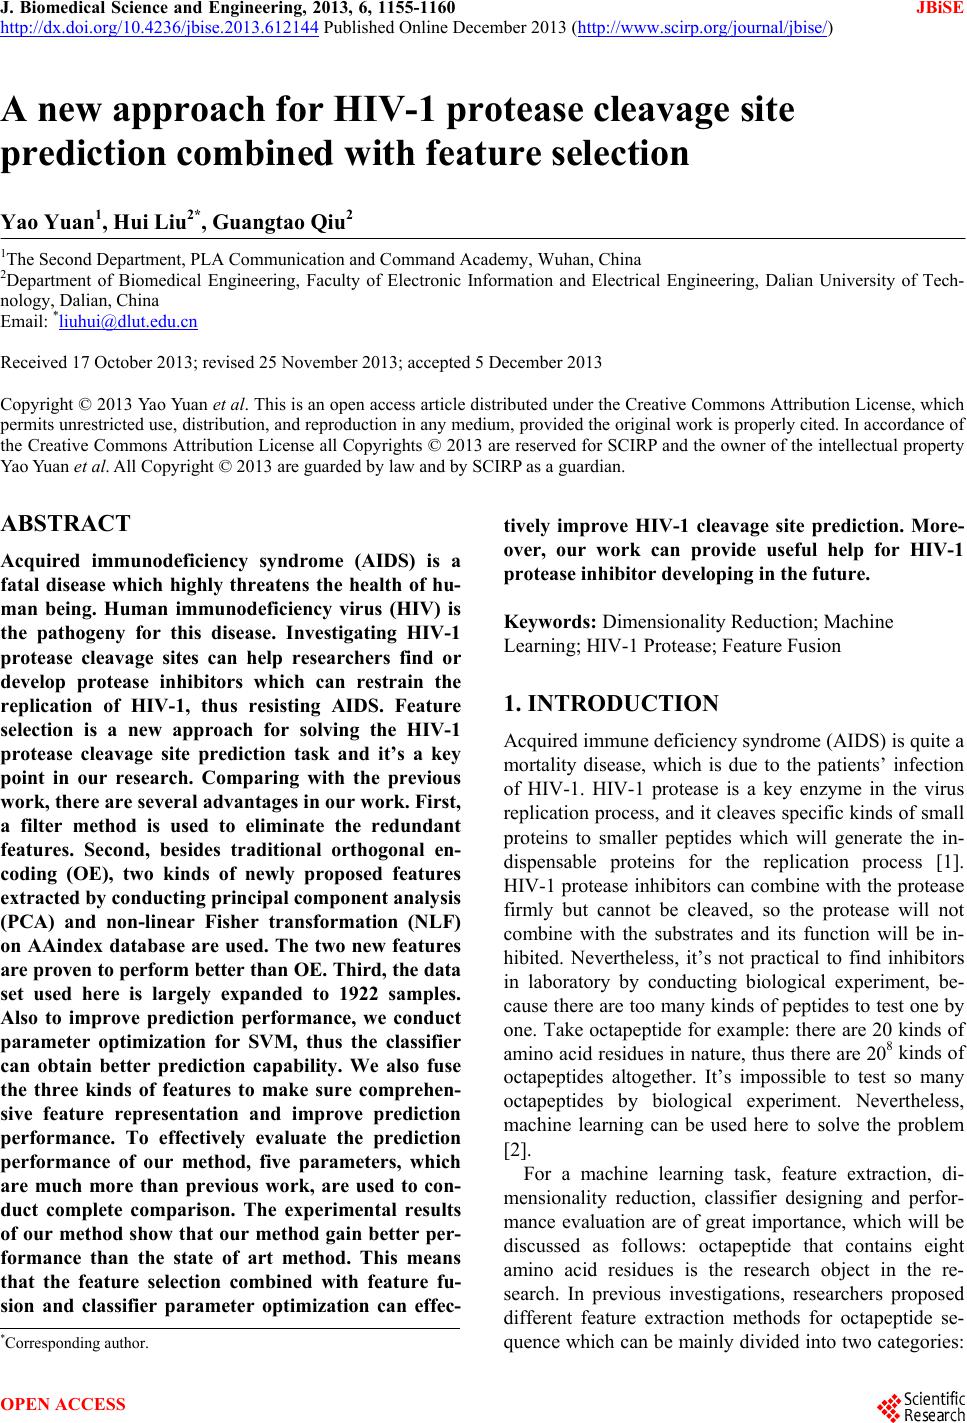
|