 J. Biomedical Science and Engineering, 2013, 6, 1143-1154 JBiSE http://dx.doi.org/10.4236/jbise.2013.612143 Published Online December 2013 (http://www.scirp.org/journal/jbise/) Application of Van der Pol oscillator screening for peripheral arterial disease in patients with diabetes mellitus Jianxing Wu1*, Chianming Li1,2, Weiling Chen1, Chiahung Lin3, Tainsong Chen1* 1Department of Biomedical Engineering, National Cheng Kung University, Tainan City, Taiwan 2Division of Infectious Diseases, Department of Medicine of Chi Mei Medical Center, Tainan City, Taiwan 3Department of Electrical Engineering, Kao-Yuan University, Kaohsiung City, Taiwan Email: *jian0218@gmail.com, 235813cmli@gmail.com, lynnchen.k@gmail.com, eechl53@gmail.com, *chents@mail.ncku.edu.tw Received 7 November 2013; revised 4 December 2013; accepted 12 December 2013 Copyright © 2013 Jianxing Wu et al. This is an open access article distributed under the Creative Commons Attribution License, which permits unrestricted use, distribution, and reproduction in any medium, provided the original work is properly cited. In accor- dance of the Creative Commons Attribution License all Copyrights © 2013 are reserved for SCIRP and the owner of the intellectual property Jianxing Wu et al. All Copyright © 2013 are guarded by law and by SCIRP as a guardian. ABSTRACT This paper proposes a Van der Pol (VDP) oscillator screening for peripheral arterial disease (PAD) in patients with diabetes mellitus. The long-term ele- vated blood sugar levels produce a high risk of pe- ripheral neuropathy and peripheral vascular disease, especially in the foot of a diabetic. Early detection is important, in order to prevent foot problems for dia- betic patients with PAD. Photoplethysmography (PPG) is a non-invasive method for the detection of blood volume changes in peripheral arteries. Because of changes in the resistance-compliance, the rise time and transit time for the PPG signals increase and change in their shape are highly correlated with PAD severity. In this study, the Burg autoregressive (AR) method is used to determine the characteristic fre- quencies of the right- and left-side PPG signals. For bilateral frequency spectra, the VDP oscillator uses asynchronous signals. This produces damped sinu- soidal responses and the oscillation overshoot (OS) is an approximating function only of the damped factor. This index is used to estimate the degree of PAD, in- cluding normal the condition and diabetic patients with PAD. The results show that the proposed me- thod is efficient and more accurate in the estimation of PAD. Keywords: Van der Pol (VDP) Oscillator; Peripheral Arterial Disease (PAD); Burg Autoregressive Method; Oscillation Overshoot 1. INTRODUCTION Type 2 diabetes is a chronic, metabolic disease that is prevalent in developed and developing countries, associ- ated with mortality and morbidity due to increasing risk factor for cardiovascular diseases. Patients with diabetes mellitus incur substantantial medical expenditure to con- trol their glycemic concentrations and complications. Peripheral arterial disease (PAD) is highly prevalent in patients with diabetes mellitus. However, it is usually underestimated by patients as well as physicians, espe- cially in the foot of diabetics, mostly contributing to the slow progress of arterial atherosclerosis in lower limbs. Manifestations of this peripheral arterial obstruction can vary from a symptom to total occlusion or gangrene of toe or foot [1]. Besides classic presentation of intermit- tent claudication, foot ulceration or diabetic foot may develop, signaling a significant degree of arterial occlu- sion and high risk for future amputation. PAD is respon- sible for 47% of amputations in diabetic patients [1]. In recent years, many imaging techniques, such as Doppler ultrasound, colour duplex ultrasound (CDU), X-ray an- giography, computed tomographic angiography (CTA), and magnetic resonance angiography (MRA), have been used to diagnose PAD, verifying the presence of a steno- sis inside the vasculature of diabetes [2-4]. Although these methodologies are reliable and highly accurate, a noninvasive and inexpensive technique for early diagno- sis and monitoring of PAD remains unsettled in hospitals and primary care settings. Modern ultrasound technique is well-developed, compact, fast, and free of irradiation, but they can only be correctly operated by a well-trained technician clinical physician. Therefore, this study pro- *Corresponding authors. OPEN ACCESS  J. X. Wu et al. / J. Biomedical Science and Engineering 6 (2013) 1143-1154 1144 poses a non-invasive means of measurement and an automatic diagnostic algorithm to estimate the degree of PAD, purporting for screening and monitoring of lower limb vascular occlusion for high-risk groups like patients of diabetes, dyslipidemia, and hypertension, and the eld- erly. Photoplethysmography (PPG) is an optical and nonin- vasive technique, widely applied to measure oxygen sa- turation, monitor heartbeat, and detect blood volume changes in the vascular bed. The advantages of PPG like compactness fast, and easy-to-operate [5-8] take the form of a portable instrument for routine screening. PPG sig- nals can be obtained from multiple-site measurements including earlobe, forearm, fingertip, thumb, and toe [9- 17]. A typical waveform of PPG is triphasic. Biphasic or monophasic form indicates a degree of arterial obstruc- tion. In signal processing, time-domain and frequency-do- main analysis has been applied to assist diagnosis of PAD. Previous research reports that frequency parame- ters verify the differences between healthy and PAD subjects, using high-frequency and low-frequency char- acteristics [5-7,15]. The most common parameters of PPG waveforms are transit time, amplitude, and shape changes, which are helpful for evaluation of arterial com- pliance single or bilateral measurements of lower limbs. Previous research reports that these timing parameters and shape characteristics reflect the degree of vascular stenosis, contributing to time delay, damping, amplitude reduction, and changes of resistance and compliance pro- perties of occlusive peripheral arteries, with variations depending on a subject’s age and measurement sites [11, 13,15]. Therefore, an alternative for applying PPG to evaluate PAD is proposed, including bilateral or multi- channel PPG techniques resulting from the findings of significant bilateral asymmetry and increased difference in timing and frequency parameters along with increased PAD severity [13-15,18]. Multi-channel measurements were used to study the age-related changes in the char- acteristics of PPG shape at the ear, finger, and toe sites. The largest changes with age were seen at the ear and finger sites for the systolic rising edge region, and the finger site for the dicrotic notch region. The smallest changes with age are for the toe site [9-11]. Accordingly, in this experiment, bilateral measurement at the right and left great toes was designed for PAD estimation. The objective of this study was to construct a fre- quency-based Van der Pol (VDP) oscillator to evaluate the degree of PAD in patients with diabetes mellitus, and apply Burg autoregressive (AR) method as a parametric method for time-domain and frequency-domain signal processing [19-24], purporting to smooth the spectra and find characteristic frequencies from the PPG signals re- corded. Given a bilateral frequency spectrum, a second- order VDP system has a step response that is character- ized by damped oscillation [25-28]. The oscillation over- shoot (OS) is an approximating function of the damped factor, and determines the severity of PAD: normal con- dition (Nor), mild-to-moderate disease (MD), and severe disease (SD). With twenty-one subjects, the test results demonstrate that the proposed method is efficient and accurate in the estimation of PAD in the feet of diabetics. 2. FREQUENCY SPECTRA ANALYSIS In signal processing of plethysmographic waveforms, higher frequency characteristics are preferred for fre- quency analysis to identify normal pulse waves [5-7]. On the other hand, low frequency is used to characterize PAD in diabetic patients. Both frequency-based methods, such as Fourier transforms (FTs), and frequency spec- trum methods, are the non-parametric techniques that are used to preprocess the PPG signals. They are disadvan- tageous for their spectral leakage effect, because of the size of sampling window. Wavelet transform is a para- metric method and provides better time-frequency reso- lution than non-parametric methods, and would be a promising method to extract features from non-stationary biosignals. However, significant frequencies are extracted at specific wavelet coefficients with different wavelets, and several frequency bands are analyzed using the cas- caded low-pass or high-pass filters and down-sampling/ up-sampling operations through trial procedures. In literatures [17-20], the Burg autoregressive (AR) method is able to derive the frequency spectra by fitting an AR model of a given specific order. Its advantages over above-mentioned methods include smooth spectra, high frequency resolution, stable AR model, and compu- tationally efficient. The Burg AR method is also a para- metric method for time-domain and frequency-domain signal processes. It could smooth spectra in comparison with frequency-based methods to find the characteristic frequencies with distinguishing peak central/main spectra by fitting an AR model of a given specific order. The frequency spectra of PPG signals is expressed as a linear combination of the previous samples and the re- sidual values, resi. For a discrete set of n sampling points, P coefficients are used to approximate the original data, i, 1, 2, 3,,in , where is a discrete frequency spec- trum of the PPG signal. The residual value is assumed to be independent of the previous samples and is calculated by [20,21] 1 ,1,2,3,, P ii pip p resi n (1) where i is the frequency spectrum of the PPG signal, P is the order of the AR model, and , and p are the coefficients of the AR model. 1,2, 3,,pP Copyright © 2013 SciRes. OPEN ACCESS  J. X. Wu et al. / J. Biomedical Science and Engineering 6 (2013) 1143-1154 1145 The optimal coefficients, p, are used to minimize the square error, , between the original data 2 i n Eres and the approximated data. For the forward and back- ward linear prediction, the object is to minimize Fp and Bp, as shown in [22] 2 2 2 0 1 p nn n pitiiit p ipip tip fi with 0 p iit i fi (2) 22 2 0 01 0 np np ni pitiiitp ipi ti B bi with 0 p iit i bi (3) where t, t[p, n], is a linear weighted combination of p previous sampling data, and t, t[0, ntp], is a linear weighted combination of p subsequent sampling data. The sum of the residual energy (SORE) in stage p is Ep = Fp + Bp. The Levinson-Durbin recursion algorithm is used to minimize the SOREs to estimate the model coef- ficients. The coefficients of p, p[1, P], are stored in a vector and an inverted order vector . Therefore, T 12 1,,, ,, , pp A 0,,,,, pPp V P p T 21 ,,1 the recursion formula is the following [22] 1pp AV (4) 1 11 0 1 2 10 1 0 np pp pp inp n pp ip i 2 ip bi FB ib i n (5) The concept of Burg AR method adjusts the parameter to minimize the SORE Ep using the final prediction error criterion (PEC) [23,24]. Then update the Ap and update fp(i) and bi(i) as 11 ppp fifi bip (6) 11 ppp bibi fip (7) The optimal coefficients p are chosen to minimize the squared error, whereas the forward and backward linear prediction equations attempt to minimize Fp and Bp. The entries of i represent samples of a discrete data, and P is the integer order of an AR model, used in estimating the power spectral density (PSD), log( i)/max{|log( i)|} dB/kHz, . This property of the AR model is used to smooth the frequency spectrum, which tends to favor the peaky spectra. Qualitatively different PSDs are observed by normalized process, which different values within the specific ranges of normalized log-magnitude and scaled frequency. Therefore, PSD can be used to identify the characteristic frequencies and magnitudes in each frequency spectra. 1,2, 3,,i In the physiological measurements, PPG signals were obtained using optical sensors (940 nm near infrared, spectral bandwidth: 45 nm) with 1 KHz sampling rate, as shown in Figure 1(a). The dashed line represents a nor- mal subject and the solid line represents a diabetic pa- tient [14,27,28]. It was found that the Fourier transform based estimation methods has some drawbacks, such as spectral leakage into sidelobes and characteristic spectral broadening, as shown in Figures 1(b) and (c). In order to find characteristic frequencies, the Burg AR method is used to estimate the PSD by fitting an AR model with given specific orders, P = 8, 12, and 16, to the PPG sig- nals. The characteristic frequencies of the PPG signals easily found in the frequency spectra between 0 Hz and 500 Hz. The PSDs are shown in Figures 1(d)-(f). The peaky spectra for diabetic subjects and the smooth fre- quency spectra for normal subjects fall into different frequency bands, respectively. Depending on these bands, frequency-based parameters provide information for the estimation of PAD in diabetic patients. 3. THE ESTIMATION OF PERIPHERAL ARTERIAL DISEASE (PAD) SEVERITY 3.1. Feature Extraction Using the Van der Pol (VDP) Oscillator PAD can develop in the arteries of most visceral organs and extremities. Atherosclerosis in the brain and heart draws much attention for clinical diagnosis and interven- tion; by contrast, lower limb PAD is underestimated by the patients, even in diabetics whose progress of vascular atherosclerosis is accelerated by the metabolic disease. PPG is a noninvasive technique capable to optically gen- erate a plethysmograph at great toes, index fingers, and ears, and monitor blood pressure, blood oxygen satura- tion (SaO2), and blood volume changes in an artery or a vascular bed of tissue. A PPG signal consists of AC (Al- ternating Current) and DC (Direct Current) components. The AC component reveals physiological information, such as cardiac synchronous changes in the blood vol- ume with each heartbeat and vasomotor activity [8-10, 15]. Time-domain and frequency-domain parameters have been used to detect the degree of PAD severity for diabetic patients with normal condition (Nor), mild-to- moderate disease (MD), and severe disease (SD). For the time-domain parameters, ECG R-peak as a timing refer- ence is used to obtain pulse rise time (RT), pulse transit time (PTT) from R-peak to pulse foot (PTTf), pulse tran- it time from R-peak to pulse peak (PTTp), and PPG am- s Copyright © 2013 SciRes. OPEN ACCESS  J. X. Wu et al. / J. Biomedical Science and Engineering 6 (2013) 1143-1154 Copyright © 2013 SciRes. 1146 Figure 1. (a) Time-domain PPG signal analysis for normal subjects and diabetic subjects, (b) and (c) PSD estimation using the frequency spectrum method, (d), (e), and (f) PSD estimation using the Burg method for an AR model with orders P = 8, 12, and 16 for normal subjects and diabetic subjects. plitude (plus foot-to-plus peak amplitude), as shown in Figure 2(a). The timing parameters, PTT and RT, are prolonged as due to the resistance of peripheral vessels increases, and the amplitude (AMP) and shape of pulse waves are smoothed [11]. Parameters, PTT and AMP, and shape differences vary with ages for individual sites, but the smallest variations with age occur at the great toe sites [9-15]. Thus, bilateral differences in the timing pa- rameters, ∆PTTf, ∆PTTp, and ∆RT, provide time delay information for the estimation of PAD. Bilateral differ- ences in frequency spectra are similar and are used to distinguish between the normal subjects and diabetic subjects. OPEN ACCESS This study uses frequency-based parameters to esti- mate the degree of PAD. The PSDs are estimated using the Burg AR method. The Van der Pol (VDP) system is used to quantify the features of the right- and left-side PSDs. It is an oscillator with nonlinear damping that is defined by a second-order differential equation. The formulation has the form of an autonomous system with two state variables. The state equations are evaluated as below [23-26]: d d rl (8) 2 d1 d lrrl (9) where r( ) and l( ) are the functions with respect to frequency , r( ) is the PSD of the right-side PPG sig- nal, except for = 0, and l( ) is the PSD of the left- side PPG signal, right and left are denoted by the sub- scripts r and l. The parameter, , is a control parameter, and > 0 reflects the degree of nonlinearity of the sys- tem [21]. When the term, ( r( ))2, becomes dominant, the VDP system becomes a nonlinear equation with posi- tive damping. The dynamics of the system are stable and are restricted to a fixed point. Equation (9) gives the frequency of self-oscillation, as determined by a real parameter, , and demonstrates dissipation or damping. If the parameter, = 0, then Equation (9) reduces to that for a simple harmonic oscil- lator. When the PSDs, r( ) and l( ), are different (not symmetrical), l( ) provides the damping in the VDP oscillator that results in self-sustained oscillations. The multiple peaks and amplitudes of these peaks demon- strate the nonlinearity of the frequency spectrum. PSD l( ) is used to determine the response of the VDP oscillator. The VDP system demonstrates a damped si- nusoidal response for a general second-order system. The transient response consists of a sinusoidal oscillating waveform with an exponentially decaying amplitude. The sinusoidal frequency is called the damped frequency of oscillation. In order to evaluate the discrete frequency spectrum, the PSD is estimated using the Burg AR method. As- suming a set of n points from the PSD, i, , (n = 500 in this study), the continuous VDP system can be modified as a discrete VDP system. Therefore, the discrete VDP system that is proposed for the estimation of PAD, as 1,2, 3,,in 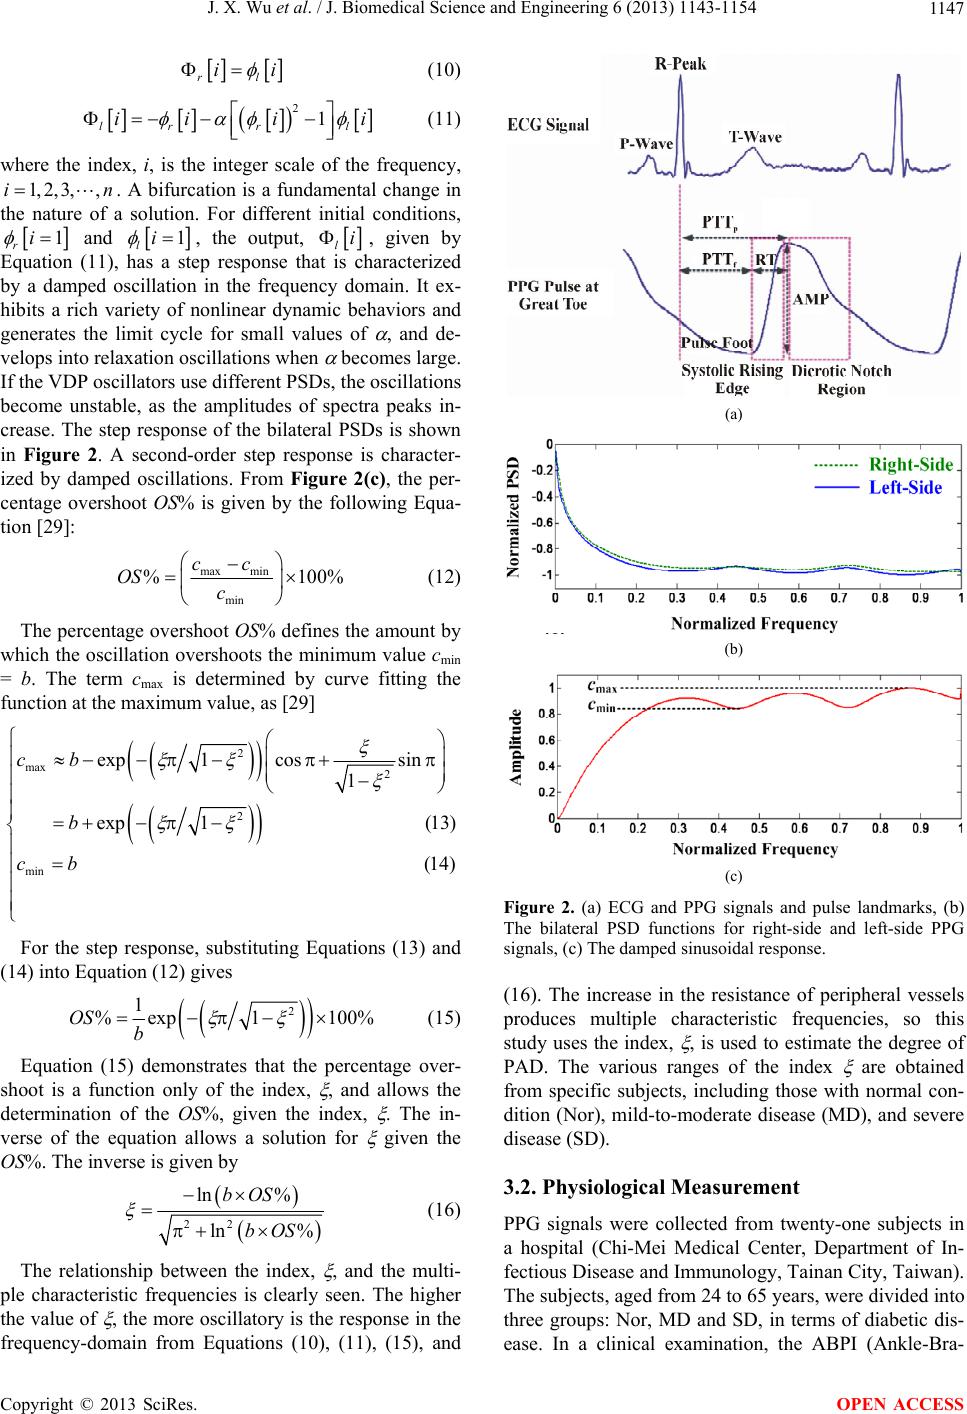 J. X. Wu et al. / J. Biomedical Science and Engineering 6 (2013) 1143-1154 1147 rl i i i n (10) 21 lr rl ii i (11) where the index, i, is the integer scale of the frequency, . A bifurcation is a fundamental change in the nature of a solution. For different initial conditions, 1,2, 3,,i 1 ri and 1 li , the output, li, given by Equation (11), has a step response that is characterized by a damped oscillation in the frequency domain. It ex- hibits a rich variety of nonlinear dynamic behaviors and generates the limit cycle for small values of , and de- velops into relaxation oscillations when becomes large. If the VDP oscillators use different PSDs, the oscillations become unstable, as the amplitudes of spectra peaks in- crease. The step response of the bilateral PSDs is shown in Figure 2. A second-order step response is character- ized by damped oscillations. From Figure 2(c), the per- centage overshoot OS% is given by the following Equa- tion [29]: max min min % cc OS c 100% (12) The percentage overshoot OS% defines the amount by which the oscillation overshoots the minimum value cmin = b. The term cmax is determined by curve fitting the function at the maximum value, as [29] 2 max 2 2 min exp1 cossin 1 exp 1(13) (14) cb b cb For the step response, substituting Equations (13) and (14) into Equation (12) gives 2 1 % exp1100%OS b (15) Equation (15) demonstrates that the percentage over- shoot is a function only of the index, , and allows the determination of the OS%, given the index, . The in- verse of the equation allows a solution for given the OS%. The inverse is given by 22 ln % ln % bOS bOS (16) The relationship between the index, , and the multi- ple characteristic frequencies is clearly seen. The higher the value of , the more oscillatory is the response in the frequency-domain from Equations (10), (11), (15), and (a) (b) (c) Figure 2. (a) ECG and PPG signals and pulse landmarks, (b) The bilateral PSD functions for right-side and left-side PPG signals, (c) The damped sinusoidal response. (16). The increase in the resistance of peripheral vessels produces multiple characteristic frequencies, so this study uses the index, , is used to estimate the degree of PAD. The various ranges of the index are obtained from specific subjects, including those with normal con- dition (Nor), mild-to-moderate disease (MD), and severe disease (SD). 3.2. Physiological Measurement PPG signals were collected from twenty-one subjects in a hospital (Chi-Mei Medical Center, Department of In- fectious Disease and Immunology, Tainan City, Taiwan). The subjects, aged from 24 to 65 years, were divided into three groups: Nor, MD and SD, in terms of diabetic dis- ease. In a clinical examination, the ABPI (Ankle-Bra- Copyright © 2013 SciRes. OPEN ACCESS 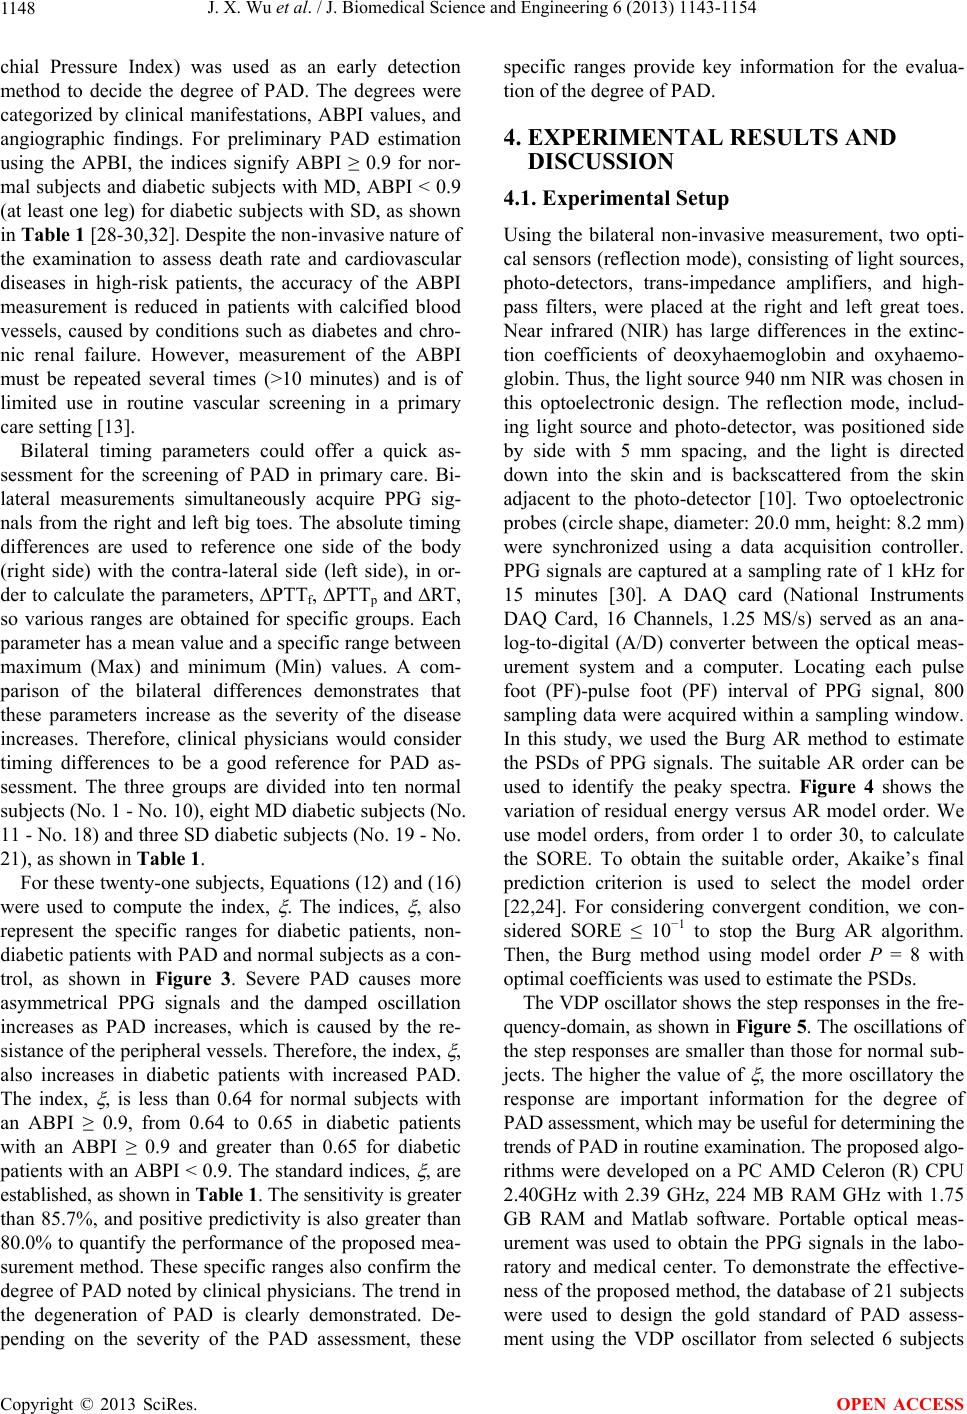 J. X. Wu et al. / J. Biomedical Science and Engineering 6 (2013) 1143-1154 1148 chial Pressure Index) was used as an early detection method to decide the degree of PAD. The degrees were categorized by clinical manifestations, ABPI values, and angiographic findings. For preliminary PAD estimation using the APBI, the indices signify ABPI ≥ 0.9 for nor- mal subjects and diabetic subjects with MD, ABPI < 0.9 (at least one leg) for diabetic subjects with SD, as shown in Table 1 [28-30,32]. Despite the non-invasive nature of the examination to assess death rate and cardiovascular diseases in high-risk patients, the accuracy of the ABPI measurement is reduced in patients with calcified blood vessels, caused by conditions such as diabetes and chro- nic renal failure. However, measurement of the ABPI must be repeated several times (>10 minutes) and is of limited use in routine vascular screening in a primary care setting [13]. Bilateral timing parameters could offer a quick as- sessment for the screening of PAD in primary care. Bi- lateral measurements simultaneously acquire PPG sig- nals from the right and left big toes. The absolute timing differences are used to reference one side of the body (right side) with the contra-lateral side (left side), in or- der to calculate the parameters, PTTf, PTTp and RT, so various ranges are obtained for specific groups. Each parameter has a mean value and a specific range between maximum (Max) and minimum (Min) values. A com- parison of the bilateral differences demonstrates that these parameters increase as the severity of the disease increases. Therefore, clinical physicians would consider timing differences to be a good reference for PAD as- sessment. The three groups are divided into ten normal subjects (No. 1 - No. 10), eight MD diabetic subjects (No. 11 - No. 18) and three SD diabetic subjects (No. 19 - No. 21), as shown in Table 1. For these twenty-one subjects, Equations (12) and (16) were used to compute the index, . The indices, , also represent the specific ranges for diabetic patients, non- diabetic patients with PAD and normal subjects as a con- trol, as shown in Figure 3. Severe PAD causes more asymmetrical PPG signals and the damped oscillation increases as PAD increases, which is caused by the re- sistance of the peripheral vessels. Therefore, the index, , also increases in diabetic patients with increased PAD. The index, , is less than 0.64 for normal subjects with an ABPI ≥ 0.9, from 0.64 to 0.65 in diabetic patients with an ABPI ≥ 0.9 and greater than 0.65 for diabetic patients with an ABPI < 0.9. The standard indices, , are established, as shown in Table 1. The sensitivity is greater than 85.7%, and positive predictivity is also greater than 80.0% to quantify the performance of the proposed mea- surement method. These specific ranges also confirm the degree of PAD noted by clinical physicians. The trend in the degeneration of PAD is clearly demonstrated. De- pending on the severity of the PAD assessment, these specific ranges provide key information for the evalua- tion of the degree of PAD. 4. EXPERIMENTAL RESULTS AND DISCUSSION 4.1. Experimental Setup Using the bilateral non-invasive measurement, two opti- cal sensors (reflection mode), consisting of light sources, photo-detectors, trans-impedance amplifiers, and high- pass filters, were placed at the right and left great toes. Near infrared (NIR) has large differences in the extinc- tion coefficients of deoxyhaemoglobin and oxyhaemo- globin. Thus, the light source 940 nm NIR was chosen in this optoelectronic design. The reflection mode, includ- ing light source and photo-detector, was positioned side by side with 5 mm spacing, and the light is directed down into the skin and is backscattered from the skin adjacent to the photo-detector [10]. Two optoelectronic probes (circle shape, diameter: 20.0 mm, height: 8.2 mm) were synchronized using a data acquisition controller. PPG signals are captured at a sampling rate of 1 kHz for 15 minutes [30]. A DAQ card (National Instruments DAQ Card, 16 Channels, 1.25 MS/s) served as an ana- log-to-digital (A/D) converter between the optical meas- urement system and a computer. Locating each pulse foot (PF)-pulse foot (PF) interval of PPG signal, 800 sampling data were acquired within a sampling window. In this study, we used the Burg AR method to estimate the PSDs of PPG signals. The suitable AR order can be used to identify the peaky spectra. Figure 4 shows the variation of residual energy versus AR model order. We use model orders, from order 1 to order 30, to calculate the SORE. To obtain the suitable order, Akaike’s final prediction criterion is used to select the model order [22,24]. For considering convergent condition, we con- sidered SORE ≤ 10−1 to stop the Burg AR algorithm. Then, the Burg method using model order P = 8 with optimal coefficients was used to estimate the PSDs. The VDP oscillator shows the step responses in the fre- quency-domain, as shown in Figure 5. The oscillations of the step responses are smaller than those for normal sub- jects. The higher the value of , the more oscillatory the response are important information for the degree of PAD assessment, which may be useful for determining the trends of PAD in routine examination. The proposed algo- rithms were developed on a PC AMD Celeron (R) CPU 2.40GHz with 2.39 GHz, 224 MB RAM GHz with 1.75 GB RAM and Matlab software. Portable optical meas- urement was used to obtain the PPG signals in the labo- ratory and medical center. To demonstrate the effective- ness of the proposed method, the database of 21 subjects were used to design the gold standard of PAD assess- ment using the VDP oscillator from selected 6 subjects Copyright © 2013 SciRes. OPEN ACCESS 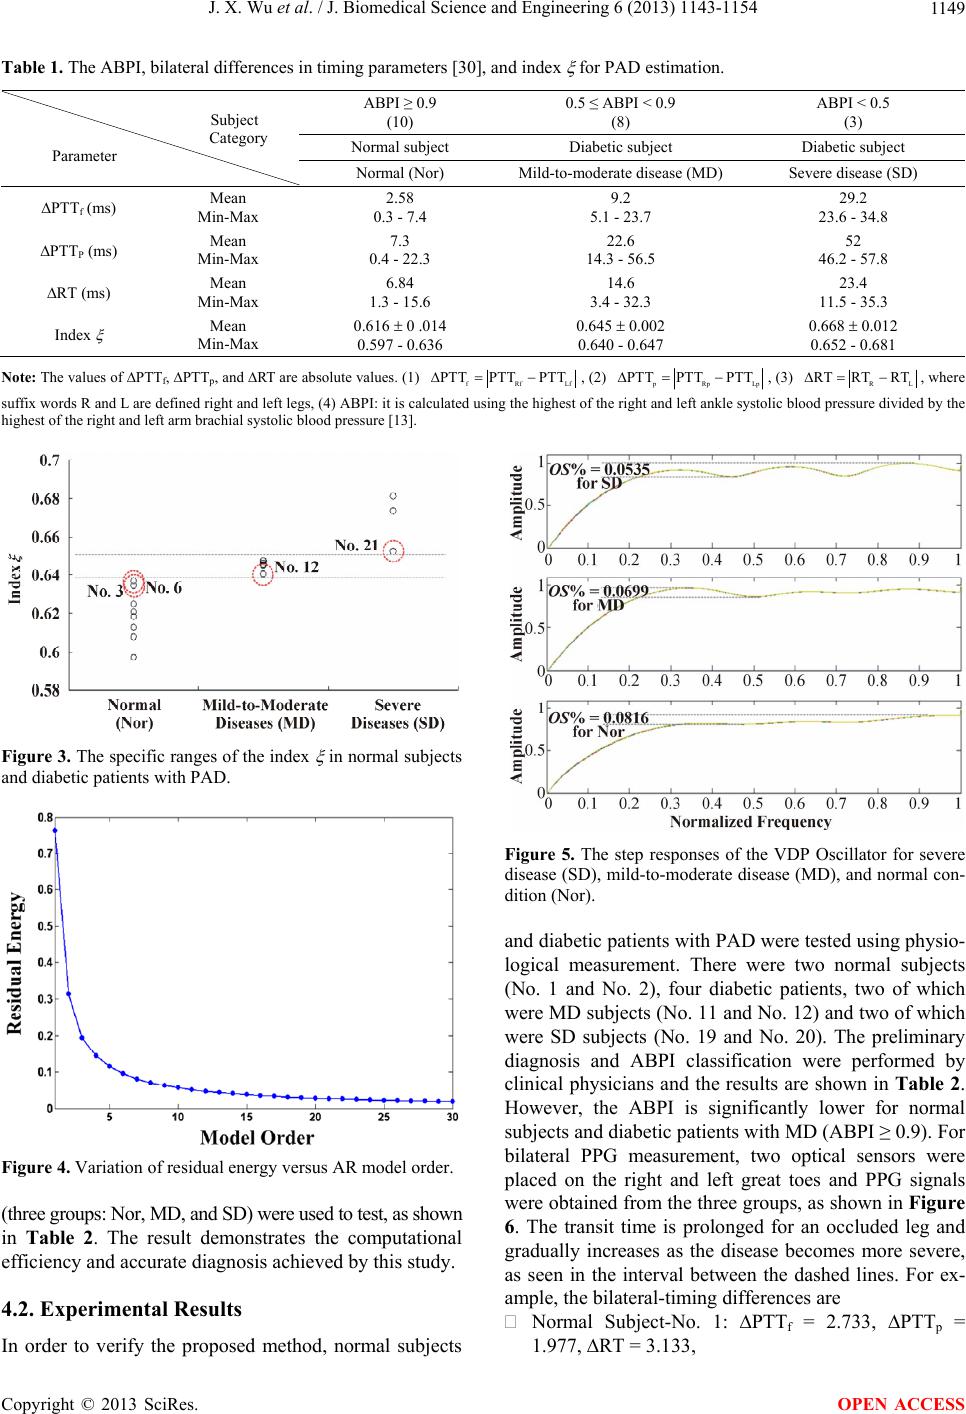 J. X. Wu et al. / J. Biomedical Science and Engineering 6 (2013) 1143-1154 Copyright © 2013 SciRes. 1149 Table 1. The ABPI, bilateral differences in timing parameters [30], and index for PAD estimation. ABPI ≥ 0.9 (10) 0.5 ≤ ABPI < 0.9 (8) ABPI < 0.5 (3) Normal subject Diabetic subject Diabetic subject Subject Category Parameter Normal (Nor) Mild-to-moderate disease (MD) Severe disease (SD) PTTf (ms) Mean Min-Max 2.58 0.3 - 7.4 9.2 5.1 - 23.7 29.2 23.6 - 34.8 PTTP (ms) Mean Min-Max 7.3 0.4 - 22.3 22.6 14.3 - 56.5 52 46.2 - 57.8 RT (ms) Mean Min-Max 6.84 1.3 - 15.6 14.6 3.4 - 32.3 23.4 11.5 - 35.3 Index Mean Min-Max 0.616 0 .014 0.597 - 0.636 0.645 0.002 0.640 - 0.647 0.668 0.012 0.652 - 0.681 Note: The values of PTTf, PTTp, and RT are absolute values. (1) fRf PTT PTTPTT Lf , (2) Rp Lp PTT PTTPTT , (3) RL RT RTRT , where suffix words R and L are defined right and left legs, (4) ABPI: it is calculated using the highest of the right and left ankle systolic blood pressure divided by the highest of the right and left arm brachial systolic blood pressure [13]. Figure 3. The specific ranges of the index in normal subjects and diabetic patients with PAD. Figure 5. The step responses of the VDP Oscillator for severe disease (SD), mild-to-moderate disease (MD), and normal con- dition (Nor). and diabetic patients with PAD were tested using physio- logical measurement. There were two normal subjects (No. 1 and No. 2), four diabetic patients, two of which were MD subjects (No. 11 and No. 12) and two of which were SD subjects (No. 19 and No. 20). The preliminary diagnosis and ABPI classification were performed by clinical physicians and the results are shown in Table 2. However, the ABPI is significantly lower for normal subjects and diabetic patients with MD (ABPI ≥ 0.9). For bilateral PPG measurement, two optical sensors were placed on the right and left great toes and PPG signals were obtained from the three groups, as shown in Figure 6. The transit time is prolonged for an occluded leg and gradually increases as the disease becomes more severe, as seen in the interval between the dashed lines. For ex- ample, the bilateral-timing differences are Figure 4. Variation of residual energy versus AR model order. (three groups: Nor, MD, and SD) were used to test, as shown in Table 2. The result demonstrates the computational efficiency and accurate diagnosis achieved by this study. 4.2. Experimental Results Normal Subject-No. 1: PTTf = 2.733, PTTp = 1.977, RT = 3.133, In order to verify the proposed method, normal subjects OPEN ACCESS 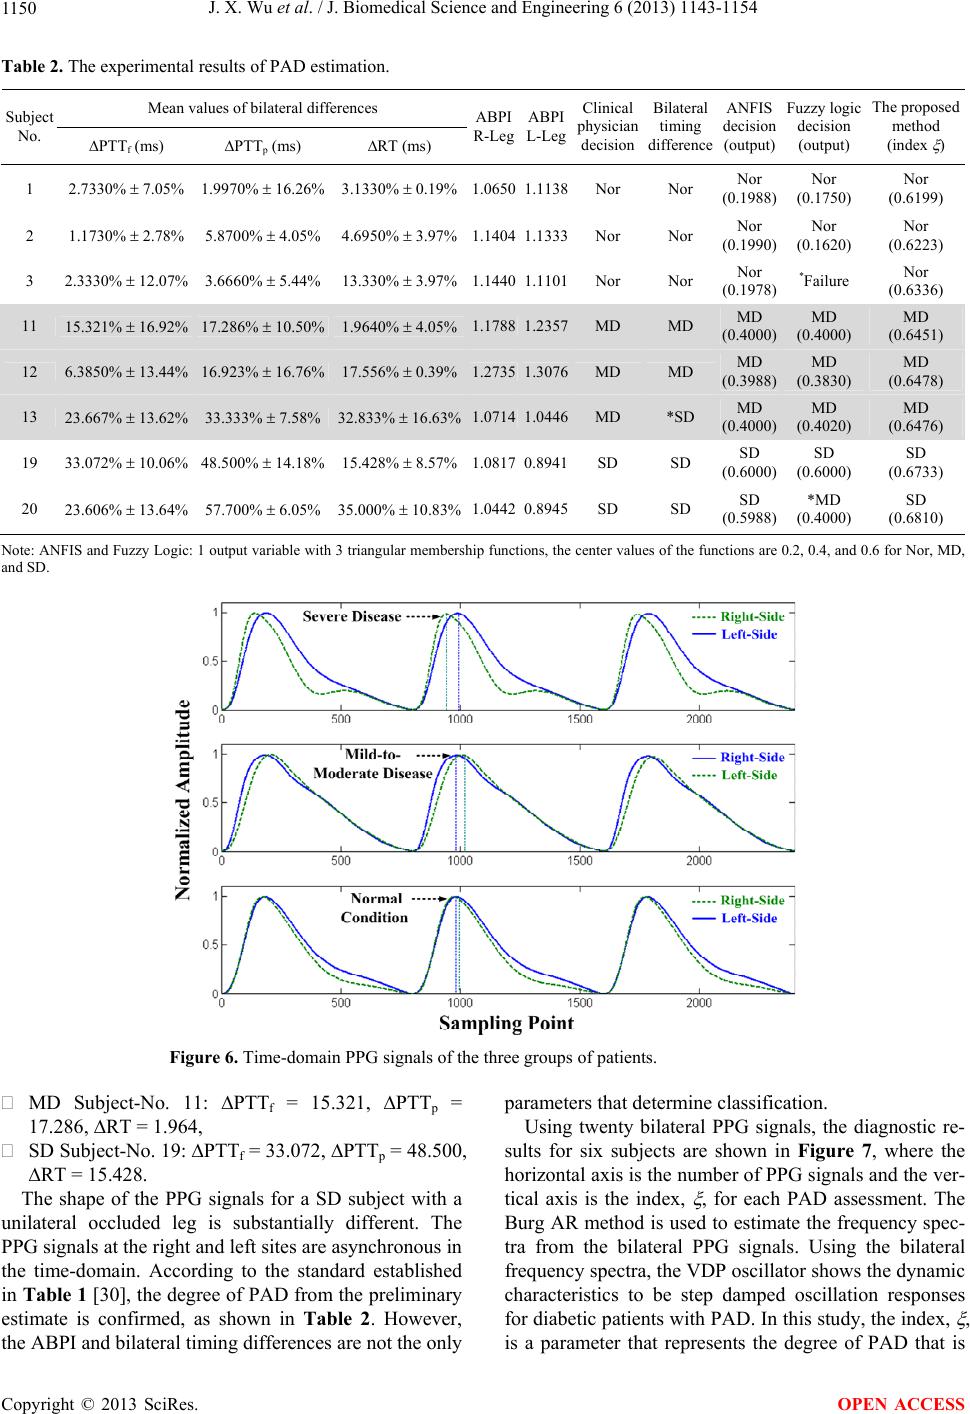 J. X. Wu et al. / J. Biomedical Science and Engineering 6 (2013) 1143-1154 1150 Table 2. The experimental results of PAD estimation. Mean values of bilateral differences Subject No. PTTf (ms) PTTp (ms) RT (ms) ABPI R-Leg ABPI L-Leg Clinical physician decision Bilateral timing difference ANFIS decision (output) Fuzzy logic decision (output) The proposed method (index ) 1 2.7330% 7.05% 1.9970% 16.26% 3.1330% 0.19%1.06501.1138Nor Nor Nor (0.1988) Nor (0.1750) Nor (0.6199) 2 1.1730% 2.78% 5.8700% 4.05% 4.6950% 3.97%1.14041.1333Nor Nor Nor (0.1990) Nor (0.1620) Nor (0.6223) 3 2.3330% 12.07% 3.6660% 5.44% 13.330% 3.97%1.14401.1101Nor Nor Nor (0.1978) *Failure Nor (0.6336) 11 15.321% 16.92% 17.286% 10.50% 1.9640% 4.05%1.17881.2357MD MD MD (0.4000) MD (0.4000) MD (0.6451) 12 6.3850% 13.44% 16.923% 16.76% 17.556% 0.39%1.27351.3076MD MD MD (0.3988) MD (0.3830) MD (0.6478) 13 23.667% 13.62% 33.333% 7.58% 32.833% 16.63%1.0714 1.0446MD *SD MD (0.4000) MD (0.4020) MD (0.6476) 19 33.072% 10.06% 48.500% 14.18% 15.428% 8.57%1.08170.8941SD SD SD (0.6000) SD (0.6000) SD (0.6733) 20 23.606% 13.64% 57.700% 6.05% 35.000% 10.83%1.04420.8945SD SD SD (0.5988) *MD (0.4000) SD (0.6810) Note: ANFIS and Fuzzy Logic: 1 output variable with 3 triangular membership functions, the center values of the functions are 0.2, 0.4, and 0.6 for Nor, MD, and SD. Figure 6. Time-domain PPG signals of the three groups of patients. MD Subject-No. 11: PTTf = 15.321, PTTp = 17.286, RT = 1.964, SD Subject-No. 19: PTTf = 33.072, PTTp = 48.500, RT = 15.428. The shape of the PPG signals for a SD subject with a unilateral occluded leg is substantially different. The PPG signals at the right and left sites are asynchronous in the time-domain. According to the standard established in Table 1 [30], the degree of PAD from the preliminary estimate is confirmed, as shown in Table 2. However, the ABPI and bilateral timing differences are not the only parameters that determine classification. Using twenty bilateral PPG signals, the diagnostic re- sults for six subjects are shown in Figure 7, where the horizontal axis is the number of PPG signals and the ver- tical axis is the index, , for each PAD assessment. The Burg AR method is used to estimate the frequency spec- tra from the bilateral PPG signals. Using the bilateral frequency spectra, the VDP oscillator shows the dynamic characteristics to be step damped oscillation responses for diabetic patients with PAD. In this study, the index, , is a parameter that represents the degree of PAD that is Copyright © 2013 SciRes. OPEN ACCESS 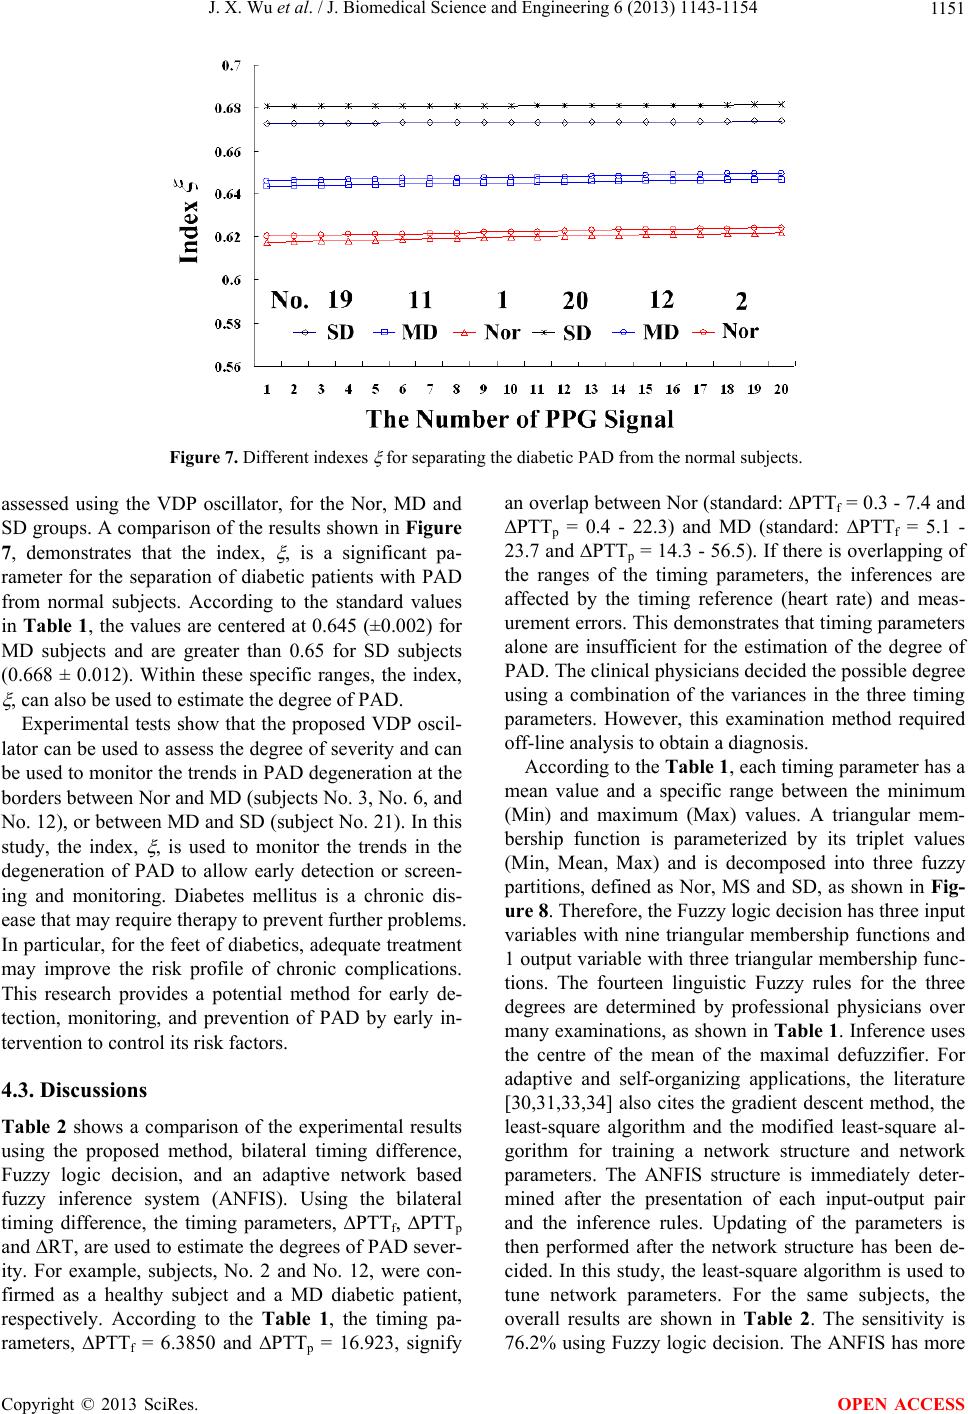 J. X. Wu et al. / J. Biomedical Science and Engineering 6 (2013) 1143-1154 1151 Figure 7. Different indexes for separating the diabetic PAD from the normal subjects. assessed using the VDP oscillator, for the Nor, MD and SD groups. A comparison of the results shown in Figure 7, demonstrates that the index, , is a significant pa- rameter for the separation of diabetic patients with PAD from normal subjects. According to the standard values in Table 1, the values are centered at 0.645 (±0.002) for MD subjects and are greater than 0.65 for SD subjects (0.668 ± 0.012). Within these specific ranges, the index, , can also be used to estimate the degree of PAD. Experimental tests show that the proposed VDP oscil- lator can be used to assess the degree of severity and can be used to monitor the trends in PAD degeneration at the borders between Nor and MD (subjects No. 3, No. 6, and No. 12), or between MD and SD (subject No. 21). In this study, the index, , is used to monitor the trends in the degeneration of PAD to allow early detection or screen- ing and monitoring. Diabetes mellitus is a chronic dis- ease that may require therapy to prevent further problems. In particular, for the feet of diabetics, adequate treatment may improve the risk profile of chronic complications. This research provides a potential method for early de- tection, monitoring, and prevention of PAD by early in- tervention to control its risk factors. 4.3. Discussions Table 2 shows a comparison of the experimental results using the proposed method, bilateral timing difference, Fuzzy logic decision, and an adaptive network based fuzzy inference system (ANFIS). Using the bilateral timing difference, the timing parameters, PTTf, PTTp and RT, are used to estimate the degrees of PAD sever- ity. For example, subjects, No. 2 and No. 12, were con- firmed as a healthy subject and a MD diabetic patient, respectively. According to the Table 1, the timing pa- rameters, ∆PTTf = 6.3850 and ∆PTTp = 16.923, signify an overlap between Nor (standard: ∆PTTf = 0.3 - 7.4 and ∆PTTp = 0.4 - 22.3) and MD (standard: ∆PTTf = 5.1 - 23.7 and ∆PTTp = 14.3 - 56.5). If there is overlapping of the ranges of the timing parameters, the inferences are affected by the timing reference (heart rate) and meas- urement errors. This demonstrates that timing parameters alone are insufficient for the estimation of the degree of PAD. The clinical physicians decided the possible degree using a combination of the variances in the three timing parameters. However, this examination method required off-line analysis to obtain a diagnosis. According to the Table 1, each timing parameter has a mean value and a specific range between the minimum (Min) and maximum (Max) values. A triangular mem- bership function is parameterized by its triplet values (Min, Mean, Max) and is decomposed into three fuzzy partitions, defined as Nor, MS and SD, as shown in Fig- ure 8. Therefore, the Fuzzy logic decision has three input variables with nine triangular membership functions and 1 output variable with three triangular membership func- tions. The fourteen linguistic Fuzzy rules for the three degrees are determined by professional physicians over many examinations, as shown in Table 1. Inference uses the centre of the mean of the maximal defuzzifier. For adaptive and self-organizing applications, the literature [30,31,33,34] also cites the gradient descent method, the least-square algorithm and the modified least-square al- gorithm for training a network structure and network parameters. The ANFIS structure is immediately deter- mined after the presentation of each input-output pair and the inference rules. Updating of the parameters is then performed after the network structure has been de- cided. In this study, the least-square algorithm is used to tune network parameters. For the same subjects, the overall results are shown in Table 2. The sensitivity is 76.2% using Fuzzy logic deciion. The ANFIS has more s Copyright © 2013 SciRes. OPEN ACCESS 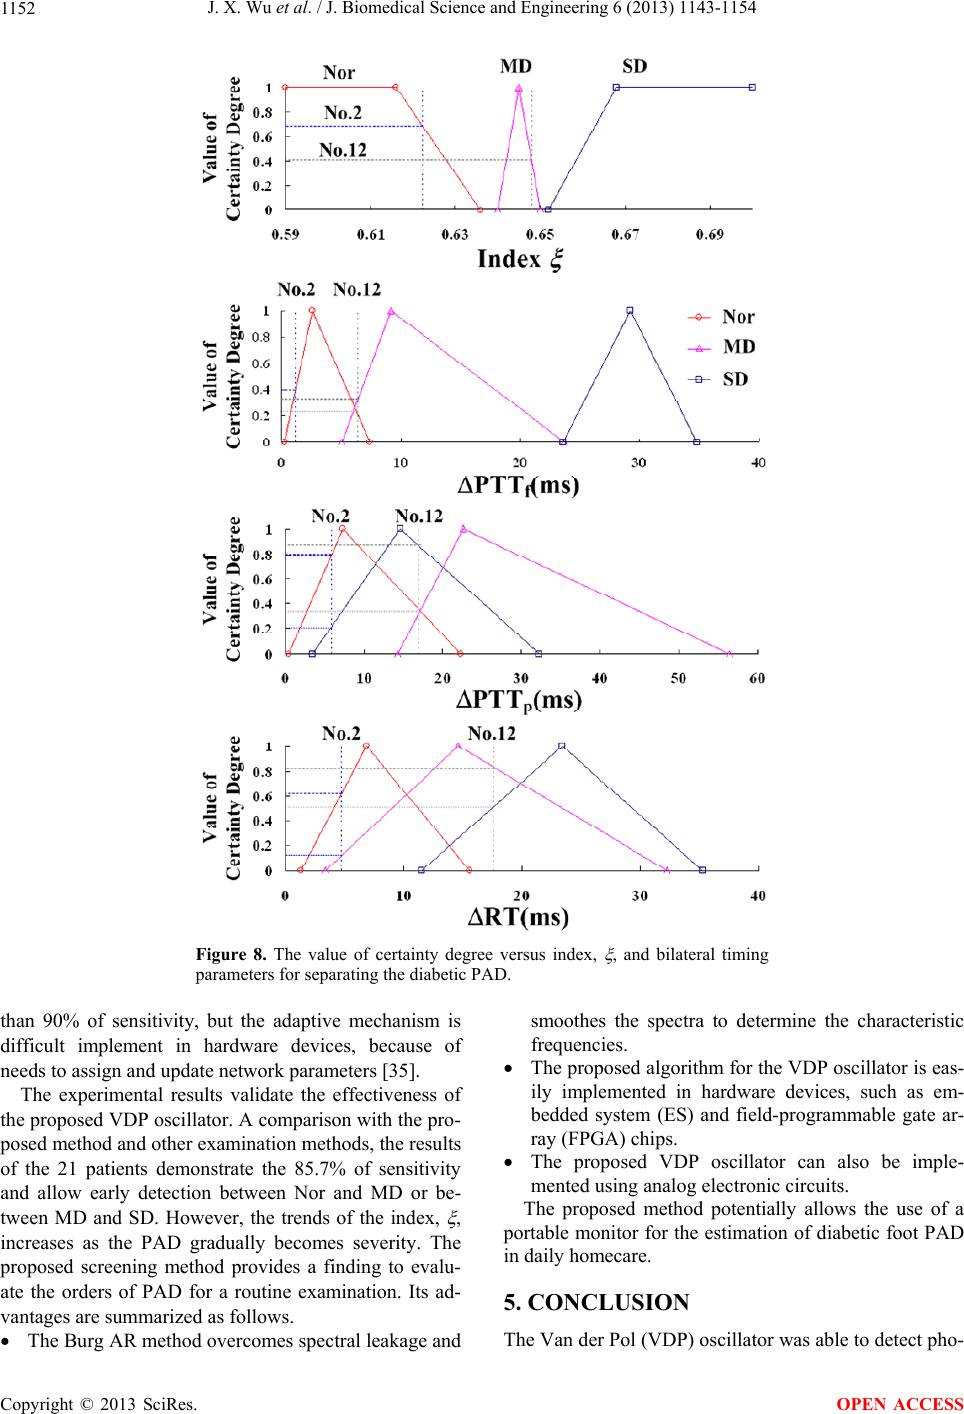 J. X. Wu et al. / J. Biomedical Science and Engineering 6 (2013) 1143-1154 1152 Figure 8. The value of certainty degree versus index, , and bilateral timing parameters for separating the diabetic PAD. than 90% of sensitivity, but the adaptive mechanism is difficult implement in hardware devices, because of needs to assign and update network parameters [35]. The experimental results validate the effectiveness of the proposed VDP oscillator. A comparison with the pro- posed method and other examination methods, the results of the 21 patients demonstrate the 85.7% of sensitivity and allow early detection between Nor and MD or be- tween MD and SD. However, the trends of the index, , increases as the PAD gradually becomes severity. The proposed screening method provides a finding to evalu- ate the orders of PAD for a routine examination. Its ad- vantages are summarized as follows. The Burg AR method overcomes spectral leakage and smoothes the spectra to determine the characteristic frequencies. The proposed algorithm for the VDP oscillator is eas- ily implemented in hardware devices, such as em- bedded system (ES) and field-programmable gate ar- ray (FPGA) chips. The proposed VDP oscillator can also be imple- mented using analog electronic circuits. The proposed method potentially allows the use of a portable monitor for the estimation of diabetic foot PAD in daily homecare. 5. CONCLUSION The Van der Pol (VDP) oscillator was able to detect pho- Copyright © 2013 SciRes. OPEN ACCESS  J. X. Wu et al. / J. Biomedical Science and Engineering 6 (2013) 1143-1154 1153 toplethysgraphic signals to estimate severity of periph- eral arterial disease (PAD) in patients with diabetes mel- litus. In addition, bilateral non-invasive optical sensors were helpful for acquiring the PPG signals at the right and left great toes, combined with the Burg AR method for determining the frequency spectra of the right- and left-side PPG signals. Using the bilateral frequency spec- tra, the VDP oscillator shows the step damped oscillation responses for diabetic patients with mild and severe se- verity, respectively, with the increasing amplitudes of damped oscillation as PAD severity worsening. The os- cillation amplitude is expressed as an index to differen- tiate between diabetic patients with PAD and normal subjects. The numerical experiments reveal specific ranges that allow confirmation of the degree, which allows tracking the trends of PAD for screening and monitoring of high-risk patients in primary settings as well as in hos- pitals. For an improved diagnostic design, the proposed method can be combined with a fuzzy inference system to derive an index for the diagnosis of PAD. The pro- posed method potentially allows for constructing a port- able bio-monitor and the use of telemedicine in a variety of clinical environments. 6. ACKNOWLEDGEMENTS This work is supported in part by the National Science Council of Tai- wan under contract number: NSC99-2221-E-244-007 (August 1 2010- October 31 2011). The authors would like to thank Dr. Chian-Ming Li for providing his valuable suggestion and help on experiments. REFERENCES [1] I. S. Muller, M. L. Bartelink, W. J. C. Grauw, H. J. M. Hooden, W. H. E. M. Gerwen and G. E. H. M. Rutten, “Foot Ulceration and Low Limb Amputation in Type 2 Diabetic Patients in Dutch Primary Health Care,” Dia- betes Care, Vol. 25, No. 3, 2002, pp. 570-574. http://dx.doi.org/10.2337/diacare.25.3.570 [2] J.-Y. David, S. A. Jones and D. P. Giddens, “Modern Spectral Analysis Techniques for Blood Flow Velocity and Spectral Measurements with Pulsed Doppler Ultra- sound,” IEEE Transactions on Biomedical Engineering, Vol. 38, No. 6, 1991, pp.589-596. http://dx.doi.org/10.1109/10.81584 [3] C. Loewe, M. Schoder, T. Rand, U. Hoffmann, J. Sailer, T. Kos, J. Lammer and S. Thurnher, “Peripheral Vascular Occlusive Disease: Evaluation with Contrast-Enhanced Moving-Bed MR Angiography versus Digital Subtraction Angiography in 106 Patients,” American Journal of Ro- entgenology, Vol. 179, No. 4, 2002, pp. 1013-1021. http://dx.doi.org/10.2214/ajr.179.4.1791013 [4] O. Pablo Vasquez, M. Marco Munguia and B. Manders- son, “Arteriovenous Fistula Stenosis Detection Using Wavelets and Support Vector Machines,” 31st Annual International Conference of the IEEE EMBS, Mineapolis, 2-6 September 2009, pp. 1298-1301. [5] M. Nitzan, A. Babchenko and B. Khonokh, “Very Low Frequency Variability in Arterial Blood Pressure and Blood Volume Pulse,” Medical & Biological Engineering & Computing, Vol. 37, No. 1, 1999, pp. 54-58. http://dx.doi.org/10.1007/BF02513266 [6] E. D. Übeyli, D. Cvetkovic and I. Cosic, “AR Spectral Analysis Technique for Human PPG, ECG and EEG Signals,” Journal of Medical Systems, Vol. 32, No. 3, 2008, pp. 201-206. http://dx.doi.org/10.1007/s10916-007-9123-7 [7] Y. M. Akay, M. Akay, W. Welkowitz, S. Lewkowicz and J. L. Semmlow, “Non Invasive Acoustical Detection of Coronary Artery Disease: A Comparative Study of Signal Processing Methods,” IEEE Transactions on Biomedical Engineering, Vol. 40, No. 6, 1993, pp. 571-578. http://dx.doi.org/10.1109/10.237677 [8] J. Allen, “Photoplethysmography and Its Application in Clinical Physiological Measurement,” Physiological Meas- urement, Vol. 28, No. 3, 2007, pp. R1-R39. http://dx.doi.org/10.1088/0967-3334/28/3/R01 [9] J. Allen and A. Murray, “Age-Related Changes in the Characteristics of the Photoplethysmographic Pulse Shape at Various Body Sites,” Physiological Measurement, Vol. 24, No. 2, 2003, pp. 297-307. http://dx.doi.org/10.1088/0967-3334/24/2/306 [10] R. Erts, J. Spigulis, I. Kukulis and M. Ozols, “Bilateral Photoplethysmography Studies of the Leg Arterial Steno- sis,” Physiological Measurement, Vol. 26, No. 5, 2005, pp. 865-874. http://dx.doi.org/10.1088/0967-3334/26/5/022 [11] J. Allen and A. Murray, “Variability of Photoplethysmo- graphy Peripheral Pulse Measurements at the Ears, Thumbs, and Toes,” IEE Proceedings on Science, Meas- urement and Technology, Vol. 147, No. 6, 2000, pp. 403- 407. http://dx.doi.org/10.1049/ip-smt:20000846 [12] P. A. Bonham, T. Kelechi, M. Mueller and J. Robison, “Are Toe Pressures Measured by a Portable Photo-Phle- thysmograph Equivalent to Standard Laboratory Tests,” Journal of Wound, Ostomy and Continence Nurses Soci- ety, Vol. 37, No. 5, 2010, pp. 475-486. [13] J. Allen, K. Overbeck, A. F. Nath, A. Murray and G. Stansby, “A Prospective Comparison of Bilateral Pho- toplethysmography versus the Ankle-Brachial Pressure Index for Detecting and Quantifying Lower Limb Pe- ripheral Arterial Disease,” Journal of Vascular Surgery, Vol. 47, No. 4, 2008, pp. 794-802. http://dx.doi.org/10.1016/j.jvs.2007.11.057 [14] C.-H. Lin, “Assessment of Bilateral Photoplethysmogra- phy for Lower Limb Peripheral Vascular Occlusive Dis- ease Using Color Relation Analysis Classifier,” Com- puter Method and Program in Biomedicine, Vol. 103, No. 3, 2011, pp. 121-131. [15] J. Allen, C. P. oates, T. A. Lees and A. Murray, “Pho- toplethysmography Detection of Lower Limb Peripheral Arterial Occlusive Disease: A Comparison of Pulse Tim- ing, Amplitude and Shape Characteristics,” Physiological Measurement, Vol. 26, No. 5, 2005, pp. 811-821. http://dx.doi.org/10.1088/0967-3334/26/5/018 [16] M. Fallahpour, D. Megias and M. Ghanbari, “Reversible Copyright © 2013 SciRes. OPEN ACCESS  J. X. Wu et al. / J. Biomedical Science and Engineering 6 (2013) 1143-1154 Copyright © 2013 SciRes. 1154 OPEN ACCESS and Highcapacity Data Hiding in Medical Images,” IET Image Processing, Vol. 5, No. 2, 2011, pp. 190-197. http://dx.doi.org/10.1049/iet-ipr.2009.0226 [17] D. M. Vázquez, J. J. Rubio and J. Pacheco, “A Charac- terization Framework for Epileptic Signals,” IET Image Processing, Vol. 6, No. 9, 2012, pp. 1227-1235. http://dx.doi.org/10.1049/iet-ipr.2012.0037 [18] H. Heidrich, R. Wenk and P. Hesse, “Frequency of As- ymptomatic Peripheral Arterial Disease in Patients En- tering the Department of General and Internal Medicine of a General Care Hospital,” Vasa, Vol. 33, No. 2, 2004, pp. 63-67. http://dx.doi.org/10.1024/0301-1526.33.2.63 [19] I. Kauppinen, J. Kauppinen and P. Saarinen, “A Method for Long Extrapolation of Audio Signals,” Journal of the Audio Engineering Society, Vol. 49, No. 12, 2001, pp. 1167-1180. [20] A. Broadman, F. S. Schlindwein, A. P. Rocha and A. Leite, “A Study on the Optimum Order of Autoregressive Models for Heart Rate Variability,” Physiological Meas- urement, Vol. 23, 2002, pp. 324-336. [21] K. Roth, I. Kauppinen, P. A. A. Esquef and V. Valimaki, “Frequency Warped Burg’s Method for AR-Modeling,” IEEE Workshop on Applications of Signal Processing to Audio and Acoustics, 19-22 October 2003, pp. 5-8. [22] C. Collomb, “Linear Prediction and Levinson-Durbin Al- gorithm,” 2009. http://www.emptyloop.com/technotes/A%20tutorial%20o n%20linear%20prediction%20and%20Levinson-Durbin.p df [23] N. Kannathal, U. Rajendra Acharya, P. Joseph and E. Y. K. Ng, “Analysis of EEG Signals with and without Re- flexology Using FFT and Auto Regressive Modeling Techniques,” Chinese Journal of Medicine, Vol. 1, No. 1, 2006, pp. 12-20. [24] M. Akay, J. L. Semmlow, W. Welkowitz, M. D. Bauer and J. B. Kostis, “Detection of Coronary Occlusions Us- ing Autoregressive Modeling of Diastolic Heart Sounds,” IEEE Transactions on Biomedical Engineering, Vol. 37, No. 4, 1990, pp. 366-373. http://dx.doi.org/10.1109/10.52343 [25] S. B. Waluya and W. T. van Horssen, “On the Periodic Solutions of a Generalized Nonlinear Van der Pol Os- cillator,” Journal of Sound and Vibration, Vol. 268, No. 1, 2003, pp. 209-215. http://dx.doi.org/10.1016/S0022-460X(03)00251-7 [26] Q. S. Bi, “Dynamical Analysis of Two Coupled Paramet- rically Excited Van der Pol Oscillators,” International Journal of Nonlinear Mechanics, Vol. 39, No. 1, 2004, pp. 33-54. http://dx.doi.org/10.1016/S0020-7462(02)00126-9 [27] G. M. Mahmoud and A. A. M. Farghaly, “Chaos Control of Chaotic Limit Cycles of Real and Complex Van der Pol Oscillators,” Chaos, Solitons and Fractals, Vol. 21, No. 4, 2004, pp. 915-924. http://dx.doi.org/10.1016/j.chaos.2003.12.039 [28] Y. Abbas, J. Ann and A. Merna, “A Multistage Adomian Decomposition Method for Solving the Autonomous Van Der Pol System,” Australian Journal of Basic and Ap- plied Sciences, Vol. 3, No. 4, 2009, pp. 4397-4407. [29] N. S. Nise, “Control Systems Engineering,” 4th Edition, John Wiley & Sons, INC., 2004. [30] Y. C. Du and C. H. Lin, “Adaptive Network-Based Fuzzy Inference System for Assessment of Lower Limb Peri- pheral Vascular Occlusive Disease,” Journal of Medical System, Vol. 36, No. 1, 2012, pp. 301-310. http://dx.doi.org/10.1007/s10916-010-9476-1 [31] C. H. Lin, Y. F. Chen, Y. C. Du, J. X. Wu and T. S. Chen, “Chaos Synchronization Detector Combining Radial Ba- sis Network for Estimation of Lower Limb Peripheral Vascular Occlusive Disease,” Lecture Notes in Computer Science, Vol. 6165, 2010, pp. 126-136. http://dx.doi.org/10.1007/978-3-642-13923-9_13 [32] P. A. Bonham, T. Kelechi, M. Mueller and J. Robison, “Are Toe Pressures Measured by a Portable Photophle- thysmograph Equivalent to Standard Laboratory Tests?” Journal of Wound Ostomy & Continence Nursing, Vol. 37, No. 5, 2010, pp. 475-486. http://dx.doi.org/10.1097/WON.0b013e3181eda0c5 [33] P. Angelov, E. Lughofer and X. Zou, “Evolving Fuzzy Classifiers Using Different Model Architectures,” Fuzzy Sets and Systems, Vol. 159, No. 23, 2008, pp. 3160-3182. http://dx.doi.org/10.1016/j.fss.2008.06.019 [34] J. J. Rubio, “SOFMLS: Online Self-Organizing Fuzzy Modified Least Squares Network,” IEEE Transactions on Fuzzy Systems, Vol. 17, No. 6, 2009, pp. 1296-1309. http://dx.doi.org/10.1109/TFUZZ.2009.2029569 [35] C.-H. Lin and G.-W. Lin, “FPGA Implementation of Fractal Patterns Classifier for Multiple Cardiac Arrhyth- mias Detection,” Journal of Biomedical Science and En- gineering, Vol. 5, No. 3, 2012, pp. 120-132.
|