H. CAO ET AL.
Copyright © 2013 SciRes. ENG
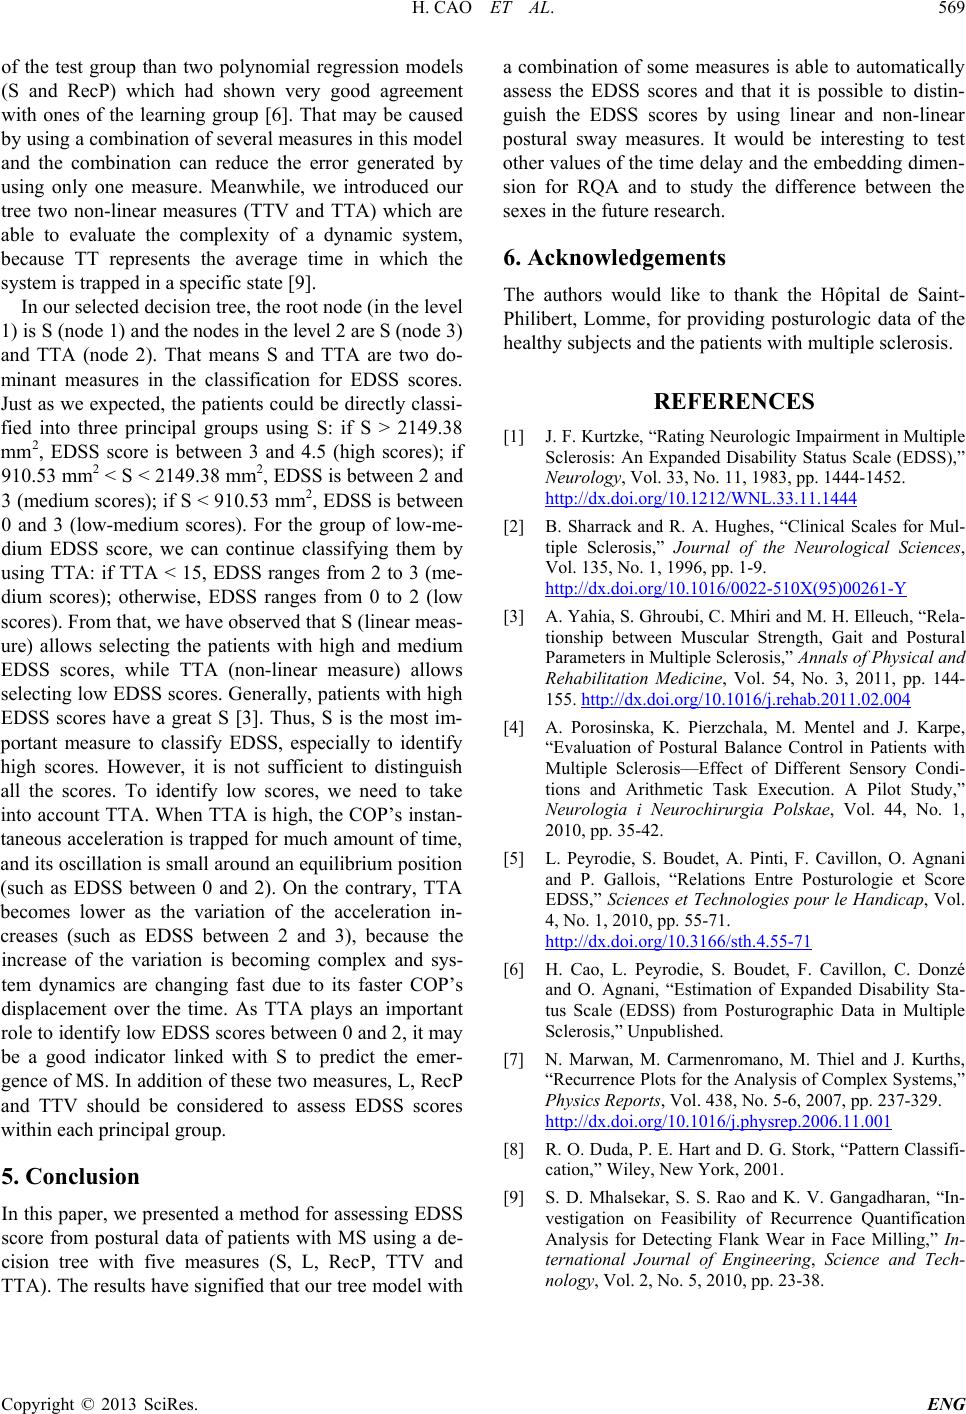
of the test group than two polynomial regression models
(S and RecP) which had shown very good agreement
with ones of the learning group [6]. That may be caused
by using a combination of several measures in this model
and the combination can reduce the error gen erated by
using only one measure. Meanwhile, we introduced our
tree two non-linear measures (TTV and TTA) which are
able to evaluate the complexity of a dynamic system,
because TT represents the average time in which the
system is trapped in a specific state [9].
In our selected decision tree, the root node (in the level
1) is S (node 1) and the nodes in the level 2 are S (node 3)
and TTA (node 2). That means S and TTA are two do-
minant measures in the classification for EDSS scores.
Just as we expected, the patients could be directly classi-
fied into three principal groups using S: if S > 2149.38
mm2, EDSS score is between 3 and 4.5 (high scores); if
910.53 mm2 < S < 2149.38 mm2, EDSS is between 2 and
3 (medium scores); if S < 910.53 mm2, EDSS is between
0 and 3 (low-medium scores). Fo r the group of low-me-
dium EDSS score, w e can continue classifying them by
using TTA: if TTA < 15, EDSS ranges from 2 to 3 (me-
dium scores); otherwise, EDSS ranges fro m 0 to 2 (low
scores). From that, we have observed that S (linear meas-
ure) allows selecting the patients with high and medium
EDSS scores, while TTA (non-linear measure) allows
selecting low EDSS scores. Generally, patients with high
EDSS scores have a great S [3]. Thus, S is the most im-
portant measure to classify EDSS, especially to identify
high scores. However, it is not sufficient to distinguish
all the scores. To identify low scores, we need to take
into account TTA. When TTA is high, the COP’s instan-
taneous acceleration is trapped for much amount of time,
and its oscillation is small around an equilibrium position
(such as EDSS between 0 and 2). On the contrary, TTA
becomes lower as the variation of the acceleration in-
creases (such as EDSS between 2 and 3), because the
increase of the variation is becoming complex and sys-
tem dynamics are changing fast due to its faster COP’s
displacement over the time. As TTA plays an important
role to identify low EDSS scores between 0 and 2, it may
be a good indicator linked with S to predict the emer-
gence of MS. In addition of these two measures, L, RecP
and TTV should be considered to assess EDSS scores
within each principal grou p.
5. Conclusion
In this paper, we presented a method for assessing EDSS
score from postural data of patients with MS using a de-
cision tree with five measures (S, L, RecP, TTV and
TTA). The results have signified that our tree model with
a combination of some measures is able to automatically
assess the EDS S scores and that it is possible to distin-
guish the EDSS scores by using linear and non-linear
postural sway measures. It would be interesting to test
other values of the time d elay and the embedding dimen-
sion for RQA and to study the difference between the
sexes in the future research.
6. Acknowledgements
The authors would like to thank the Hôpital de Saint-
Philibert, Lomme, for prov iding posturologic data of the
healthy subjects and the patients with multiple sclerosis.
REFERENCES
[1] J. F. Kurtzke, “Rating Neurologic Impairment in Multiple
Sclerosis: An Expanded Disability Status Scale (EDSS),”
Neurology, Vol. 33, No. 11, 1983, pp. 1444-1452.
http://dx.doi.org/10.1212/WNL.33.11.1444
[2] B. Sharrack and R. A. Hughes, “Clinical Scales for Mul-
tiple Sclerosis,” Journal of the Neurological Sciences,
Vol. 135, No. 1, 1996, pp. 1-9.
http://dx.doi.org/10.1016/0022-510X(95)00261-Y
[3] A. Yahia, S. Ghroubi, C. Mhiri and M. H. Elleuch, “Rela-
tionship between Muscular Strength, Gait and Postural
Parameters in Multiple Sclerosis,” Annals of Physical and
Rehabilitation Medicine, Vol . 54, No. 3, 2011, pp. 144-
155. http://dx.doi.org/10.1016/j.rehab.2011.02.004
[4] A. Porosinska, K. Pierzchala, M. Mentel and J. Karpe,
“Evaluation of Postural Balance Control in Patients with
Multiple Sclerosis—Effect of Different Sensory Condi-
tions and Arithmetic Task Execution. A Pilot Study,”
Neurologia i Neurochirurgia Polskae, Vol. 44, No. 1,
2010, pp. 35-42.
[5] L. Peyrodie, S. Boudet, A. Pinti, F. Cavillon, O. Agnani
and P. Gallois, “Relations Entre Posturologie et Score
EDSS,” Sciences et Technologies pour le Handicap, Vol.
4, No. 1, 2010, pp. 55-71.
http://dx.doi.org/10.3166/sth.4.55-71
[6] H. Cao, L. Peyrodie, S. Boudet, F. Cavillon, C. Donzé
and O. Agnani, “Estimation of Expanded Disability Sta-
tus Scale (EDSS) from Posturographic Data in Multiple
Sclerosis,” Unpublished.
[7] N. Marwan, M. Carmenromano, M. Thiel and J. Kurths,
“Recurrence Plots for the Analysis of Complex Systems,”
Physics Reports, Vol. 438, No. 5-6, 2007, pp. 237-329.
http://dx.doi.org/10.1016/j.physrep.2006.11.001
[8] R. O. Duda, P. E. Hart and D. G. Stork, “Pattern Classifi-
cation,” Wiley, New York, 2001.
[9] S. D. Mhalsekar, S. S. Rao and K. V. Gangadharan, “In-
vestigation on Feasibility of Recurrence Quantification
Analysis for Detecting Flank Wear in Face Milling,” In-
ternational Journal of Engineering, Science and Tech-
nology, Vol. 2, No. 5, 2010, pp. 23-38.