W. Q. YUAN ET AL.
Copyright © 2013 SciRes. ENG
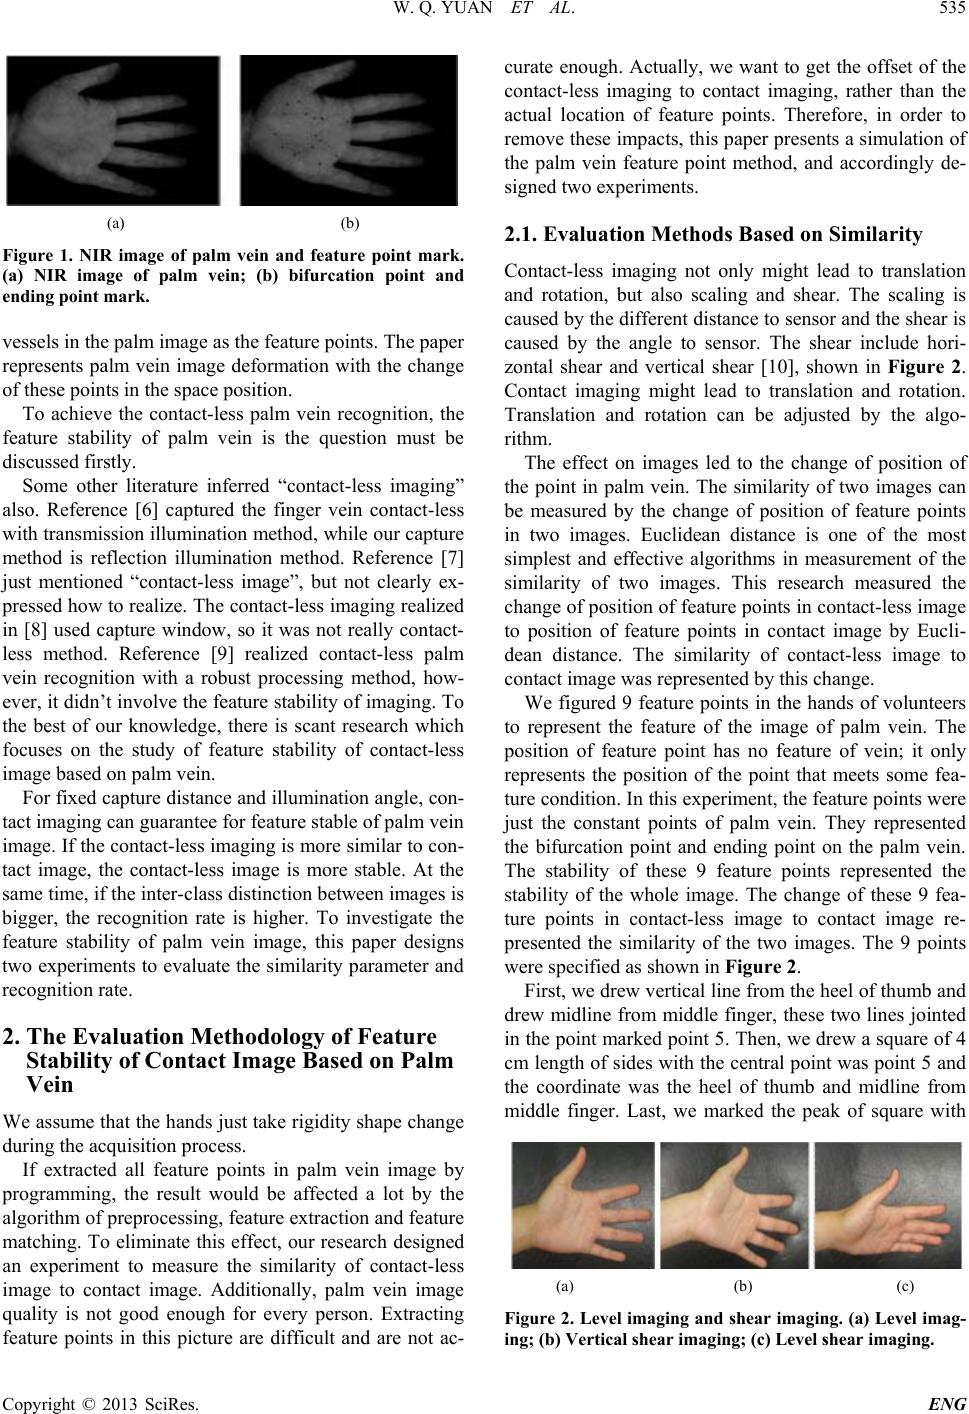
(a) (b)
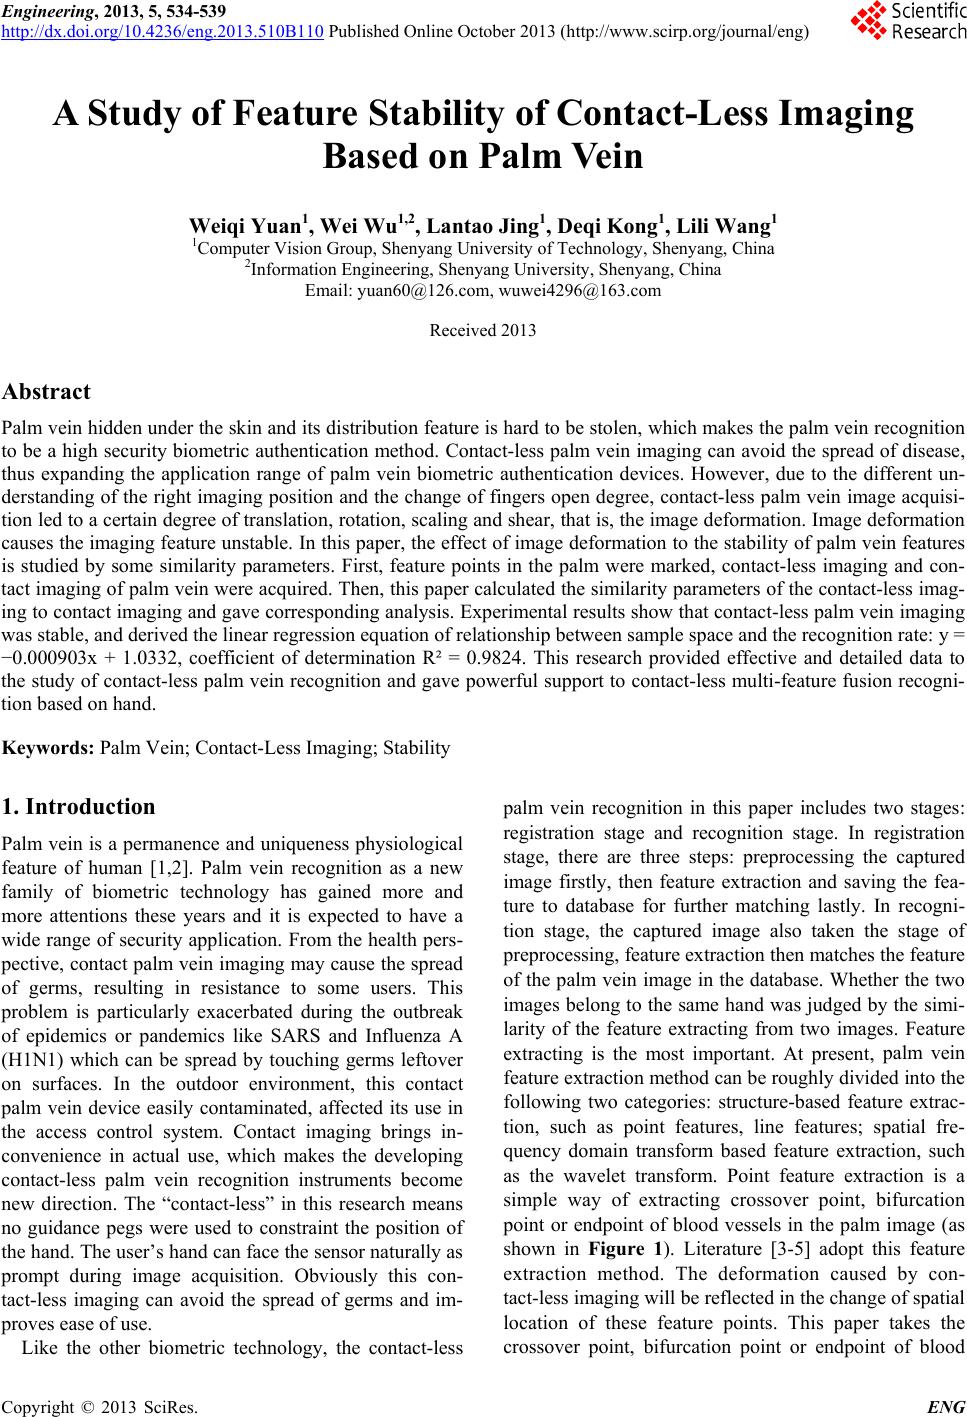
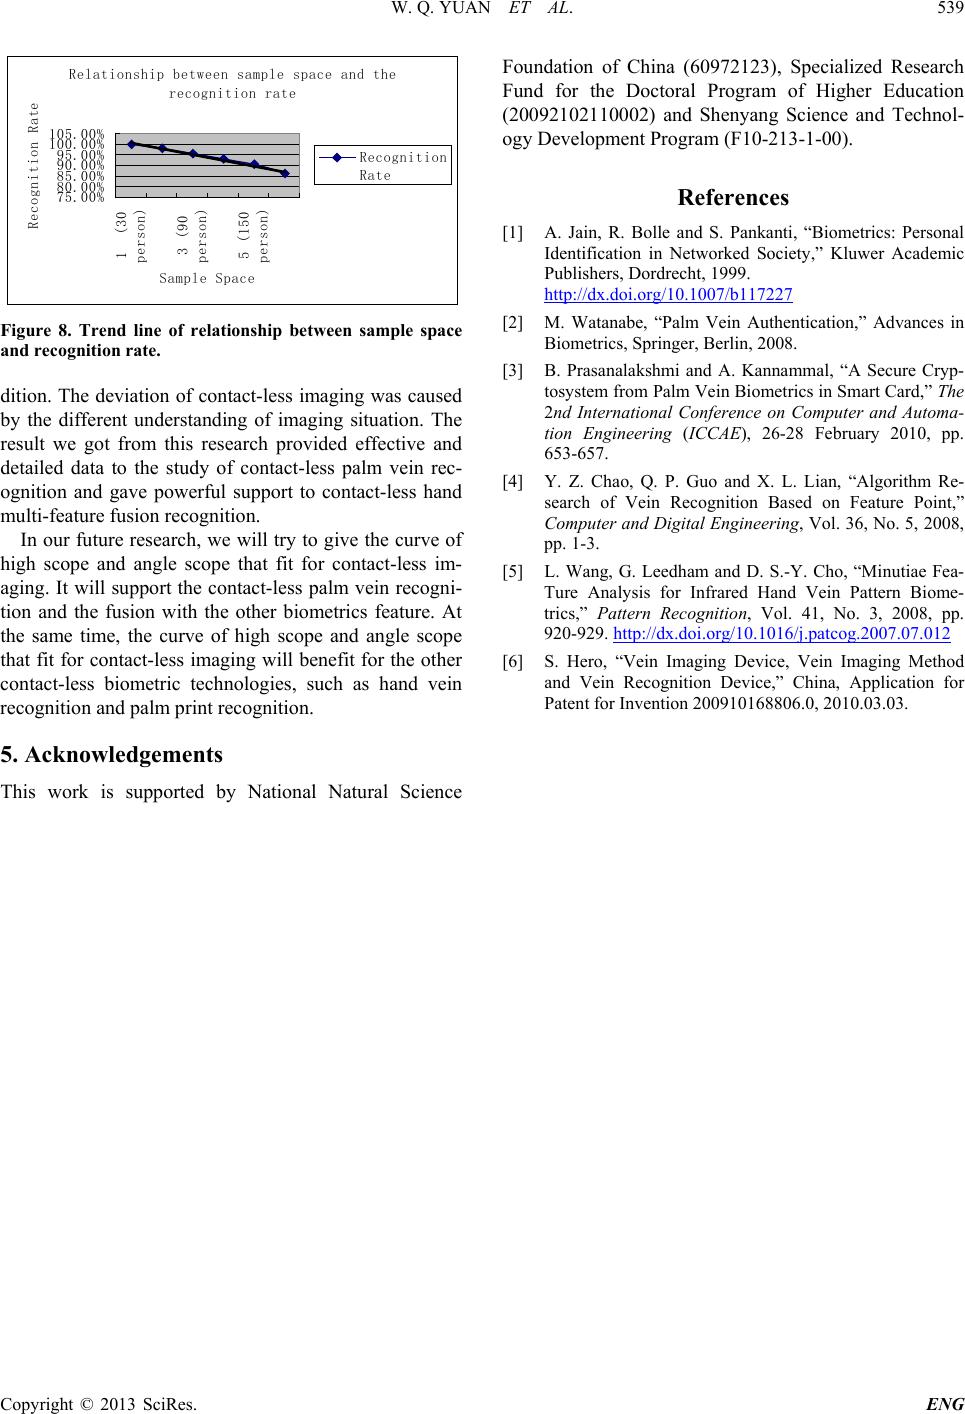
Figure 1. NIR image of palm vein and feature point mark.
(a) NIR image of palm vein; (b) bifurcation point and
ending point m ark.
vessels in the palm image as the feature points. The paper
represents palm vein image deformation with the change
of these p oi nts in the spa c e posit ion.
To achieve the contact-less palm vein recognition, the
feature stability of palm vein is the question must be
discussed firstly.
Some other literature inferred “contact-less imaging”
also. Reference [6] captured the finger vein contact-less
with transmission illumination method, while our capture
method is reflection illumination method. Reference [7]
just mentioned “contact-less image”, but not clearly ex-
pressed how to realize. The contact-less imaging realized
in [8] used capture window, so it was not really contact-
less method. Reference [9] realized contact-less palm
vein recognition with a robust processing method, how-
ever, it didn’t involve the feature stability of imaging. To
the best of our knowledge, there is scant research which
focuses on the study of feature stability of contact-less
image bas ed on palm vein.
For fixed capture distance and illumination angle, co n-
tact imaging can guarantee for feature stable of palm vein
image. If the contact-less imaging is more similar to con-
tact image, the contact-less image is more stable. At the
same time, if the inter-class distinction between images is
bigger, the recognition rate is higher. To investigate the
feature stability of palm vein image, this paper designs
two experiments to ev aluate the similarity parameter and
recognition rate.
2. The Evaluation Methodology of Feature
Stability of Contact Image Based on Palm
Vein
We assume that the hands just take rigidity shape change
during the acquisition process.
If extracted all feature points in palm vein image by
programming, the result would be affected a lot by the
algorithm of preprocessing, feature extraction and feature
matching. To eliminate this eff ect, our research designed
an experiment to measure the similarity of contact-less
image to contact image. Additionally, palm vein image
quality is not good enough for every person. Extracting
feature points in this picture are difficult and are not ac-
curate enough. Actually, we want to get the offset of the
contact-less imaging to contact imaging, rather than the
actual location of feature points. Therefore, in order to
remove these impacts, this paper presents a simulation of
the palm vein feature point method, and accordingly de-
signed two experiments.
2.1. Evaluation Methods Based on Similarity
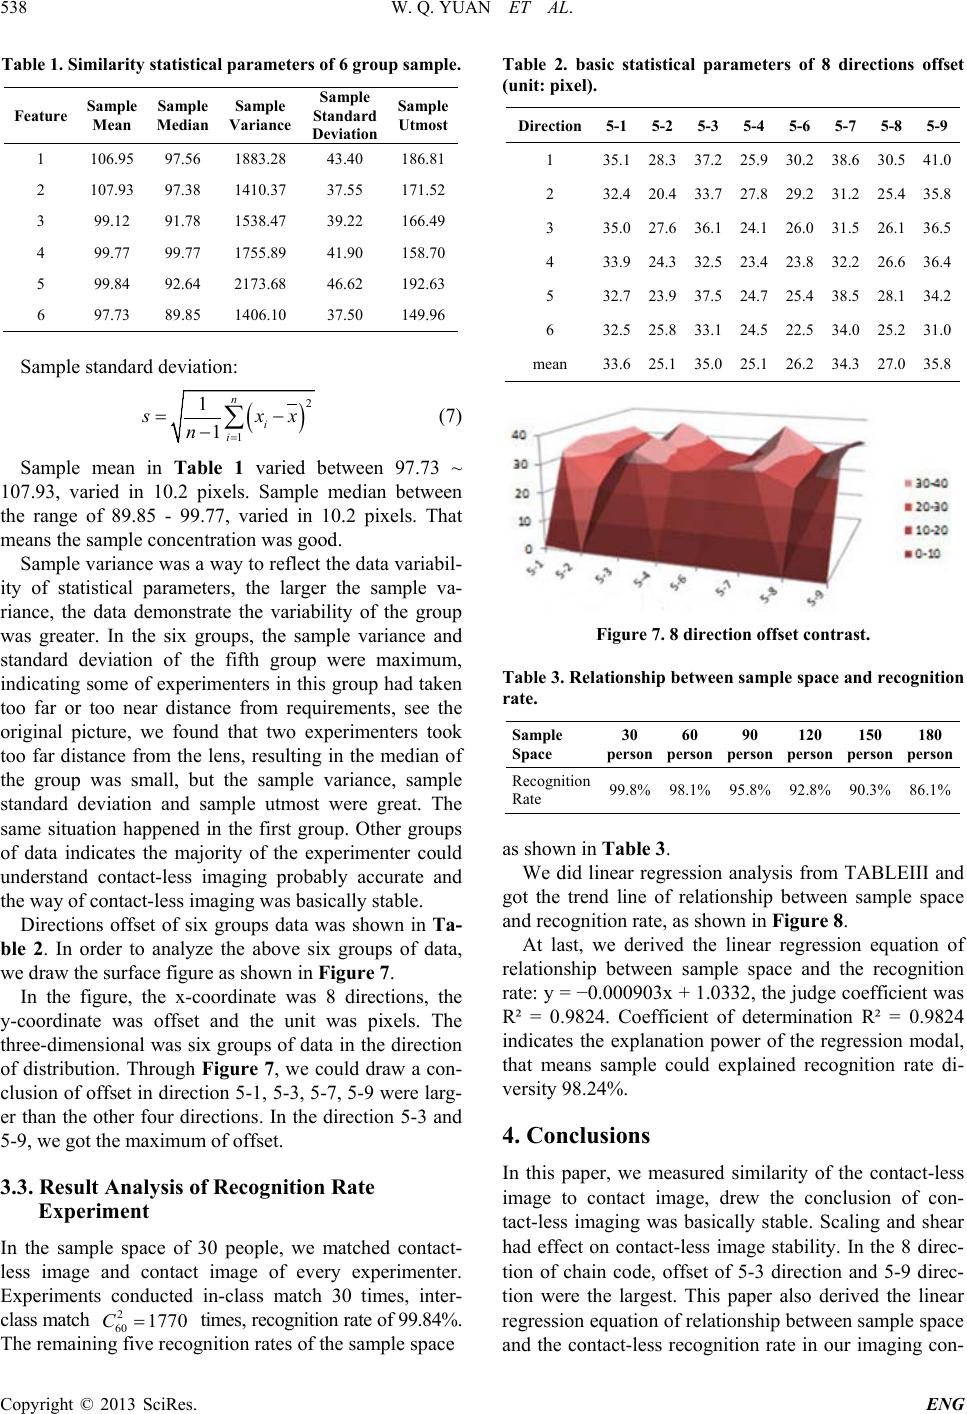
Contact-less imaging not only might lead to translation
and rotation, but also scaling and shear. The scaling is
caused by the different distance to sensor and the shear is
caused by the angle to sensor. The shear include hori-
zontal shear and vertical shear [10], shown in Figure 2.
Contact imaging might lead to translation and rotation.
Translation and rotation can be adjusted by the algo-
rithm.
The effect on images led to the change of position of
the point in palm vein. The similarity of two images can
be measured by the change of position of feature points
in two images. Euclidean distance is one of the most
simplest and effective algorithms in measurement of the
similarity of two images. This research measured the
change of position of feature points in contact-less image
to position of feature points in contact image by Eucli-
dean distance. The similarity of contact-less image to
contact image was represented by this change.
We figured 9 feature points in the hands of volunteers
to represent the feature of the image of palm vein. The
position of feature point has no feature of vein; it only
represents the position of the point that meets some fea-
ture condition. In this experiment, the feature points were
just the constant points of palm vein. They represented
the bifurcation point and ending point on the palm vein.
The stability of these 9 feature points represented the
stability of the whole image. The change of these 9 fea-
ture points in contact-less image to contact image re-
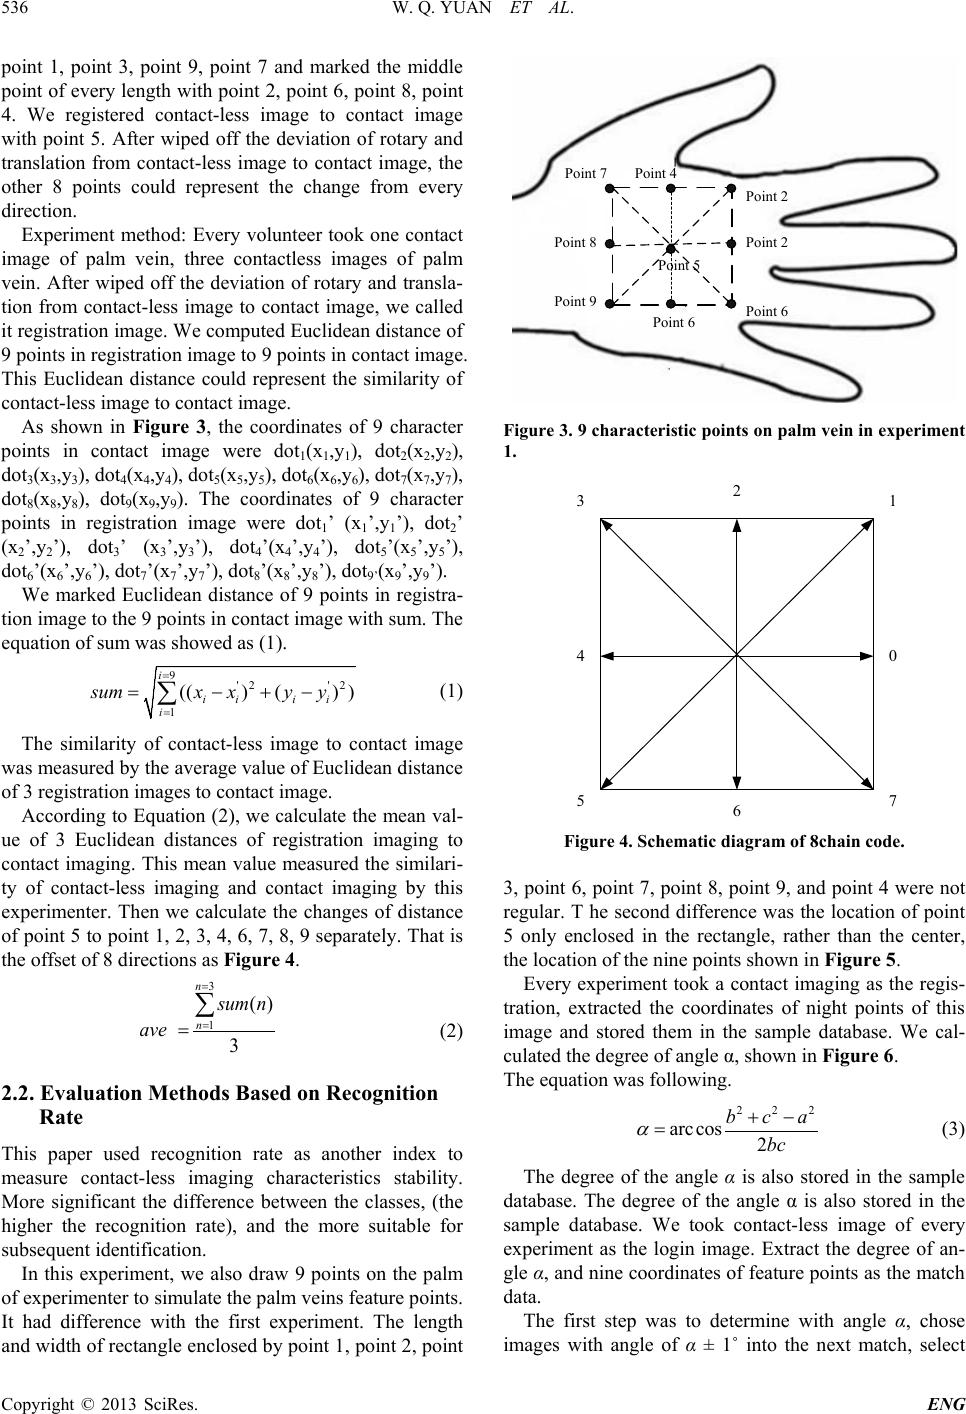
presented the similarity of the two images. The 9 points
were specified as shown in Figure 2.
First, w e drew vertical line from the heel of thumb and
drew midline from middle finger, these two lines jointed
in the point marked point 5. Then, we drew a square of 4
cm length of sides with the central point was point 5 and
the coordinate was the heel of thumb and midline from
middle finger. Last, we marked the peak of square with
(a) (b) (c)
Figure 2. Level imaging and shear imaging. (a) Level imag-
ing; (b) Vertical shear imaging; (c) Level shear imaging.