 Engineering, 2013, 5, 502-508 http://dx.doi.org/10.4236/eng.2013.510B103 Published Online October 2013 (http://www.scirp.org/journal/eng) Copyright © 2013 SciRes. ENG A Scalable Method for Cross-Platform Merging of SNP Array Datasets Peikai Chen, Y. S. Hung Department of Electrical and Electronic Engineering, The University of Hong Kong, Hong Kong, China Email: pkchen@eee.hku.hk, yshung@eee.hku.hk Received 2013 ABSTRACT Single nucleotide polymorphism (SNP) array is a recently developed biotechnology that is extensively used in the study of cancer genomes. The various available platforms make cross-study validations/comparisons difficult. Meanwhile, sample sizes of the studies are fast increasing, which poses a heavy computational burden to even the fastest PC. Here, we describe a novel method that can generate a platform-inde pendent da taset given SNP arrays from multiple platforms. It extracts the common probesets from individual platforms, and performs cross-platform normalizations and summari- zations based on these probesets. Since different platforms may have different numbers of probes per probeset (PPP), the above steps produce preprocessed signals with different noise levels for the platforms. To handle this problem, we adopt a platform-dependent smoothing strategy, and produce a preprocessed dataset that demonstrates uniform noise levels for individual samples. To increase the scalability of the method to a large number of samples, we devised an algorithm that split the samples into multiple tasks, and probesets into multiple segments before submitting to a parallel computing facility. This scheme results in a drastically reduced computation time and increa sed ability to process ultra - large sample sizes and arrays. Keywords: SNP Array; Scalable Processing; Cross-Platform 1. Introduction SNP array is a recent advancement in the high through- put biomedical measurements at the molecular level [1]. Each array is a finger-tip sized and one-sample-only bio- chip, on which millions of grids can be found. Each grid contains millions of identical copies of short single- stranded DNA sequences that are to be bound with the DNAs from the measuring sample. Each grid is called a probe, and a number of probes (usually 6, 12 or 20), re- ferred to as a probeset, may be needed to detect (in a process known as summarization) the signal of an allele (of a locus) in the DNA. In a study, often multiple sam- ples are used on separate arrays. As a result, the levels of DNAs in each sample, though quantified before experi- ment, may vary and th e probe signal benchmarks in e ach array vary as well. A process known as normalization is usually conducted to reduce this bias [2]. Ultimately, given samples and arrays, each with bi- allelic (namely, A/B alleles) probesets, for a sample , there will be ordered-pairs of signals, denoted as ,, (,){1,.., } ij ij AB SS jJ∈ , where and , B S are the A and B allele signals, respectively. The summa- rized signals can be used for a variety of purposes, such as calling the genotypes of a SNP locus [3], estimating the copy numbers of a gene [4-6], or pre- dicting the LOH likelihood of a region [6]. This genetic information, especially for a disease sample, has strong biological meanings attached to them. Therefore, the pro - per preprocessing of SNP arrays from probe level signals to summarized signals are very important for correctly identifying the disease-susceptible loci. Recent years have witnessed the rise of cross-institu- tional collaborations in biomedical studies, where large numbers of samples can be harvested and measured in different batches by different platforms. Furthermore, similar studies may be conducted using different plat- forms, making the cross-study comparison extremely difficult. For example, samples may be in Affyme- trix Human Mapping 250 K arrays, while other 2 N samples are in Affymetrix SNP6.0. This presents a prob- lem because the former array contains about a quarter of a million probesets, while the latter contai ns close to two million probesets (half of which are SNP/allelic and the other half are non-allelic probesets). Researchers may either choose to use samples of only one array, say the one with more probesets, or choose to use the probesets common to both arrays and have a larger sample size. The latter is often more desirable since it will increase the statistical power of a finding. Furthermore, SNP ar- 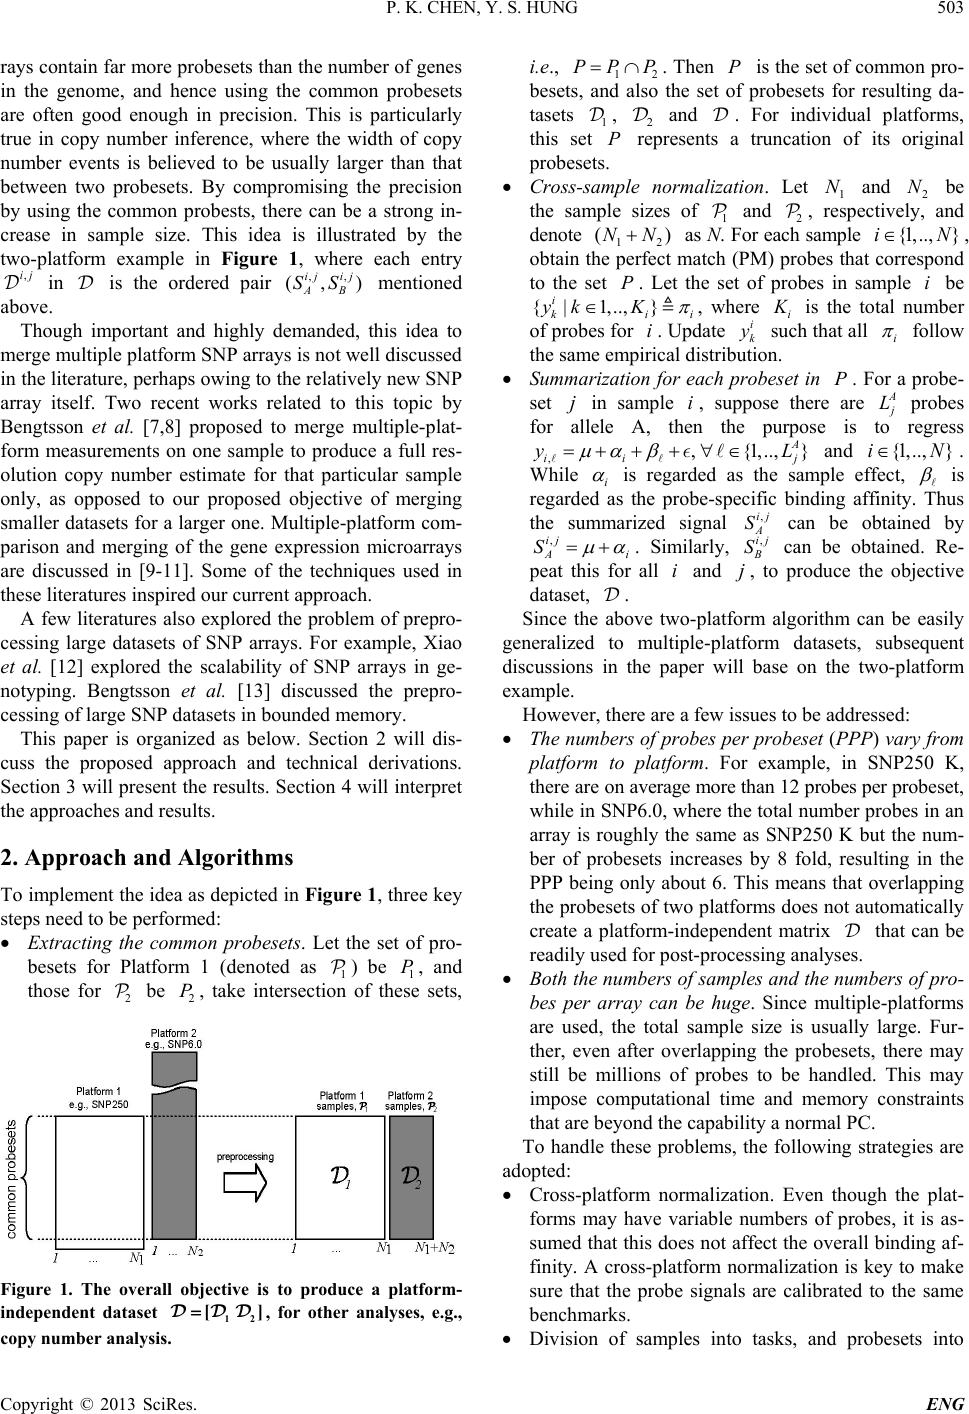 P. K. CHEN, Y. S. HUNG Copyright © 2013 SciRes. ENG rays contain far more probesets than the number of genes in the genome, and hence using the common probesets are often good enough in precision. This is particularly true in copy number inference, where the width of copy number events is believed to be usually larger than that between two probesets. By compromising the precision by using the common probests, there can be a strong in- crease in sample size. This idea is illustrated by the two-platform example in Figure 1, where each entry in is the ordered pair mentioned above. Though important and highly demanded, this idea to merge multiple platform SNP arrays is not well discussed in the literature, perhaps owing to the relatively new SNP array itself. Two recent works related to this topic by Bengtsson et al. [7,8] proposed to merge multiple-plat- form measurements on one sample to produce a full res- olution copy number estimate for that particular sample only, as opposed to our proposed objective of merging smaller datasets for a larger one. Multiple -platform com- parison and merging of the gene expression microarrays are discussed in [9-11]. Some of the techniques used in these literatures inspired our current approach. A few literatures also explored the problem of prepro- cessing large datasets of SNP arrays. For example, Xiao et al. [12] explored the scalability of SNP arrays in ge- notyping. Bengtsson et al. [13] discussed the prepro- cessing of large SNP datasets in bounded memory. This paper is organized as below. Section 2 will dis- cuss the proposed approach and technical derivations. Section 3 will present th e results. Section 4 will interpret the approaches and results. 2. Approach and Algorithms To implement the idea as depicted in Fi gure 1 , three key steps nee d to b e pe r f or med: • Extracting the common probesets. Let the set of pro- besets for Platform 1 (denoted as ) be , and those for be , take intersection of these sets, Figure 1. The overall objective is to produce a platform- independent dataset , for other analyses, e.g., copy number analysis. i.e., . Then is the set of common pro- besets, and also the set of probesets for resulting da- tasets , and . For individual platforms, this set represents a truncation of its original probesets. • Cross-sample normalization. Let and 2 N be the sample sizes of and , respectively, and denote as N. For each sa mple , obtain the perfect match (PM) probes that correspond to the set . Let the set of probes in sample be , where is the total number of probes for . Update such that all follow the same empirical distribution. • Summarization for each probeset in . For a probe- set in sample , suppose there are probes for allele A, then the purpose is to regress , ,{1,.., } A ii j yL µα β =+++ ∀∈ and . While is regarded as the sample effect, is regarded as the probe-specific binding affinity. Thus the summarized signal , A S can be obtained by . Similarly, , B S can be obtained. Re- peat this for all and , to produce the objective dataset, . Since the above two-platform algorithm can be easily generalized to multiple-platform datasets, subsequent discussions in the paper will base on the two-platform example. However, there are a few issues to be addressed: • The numbers of probes per probeset (PPP) vary from platform to platform. For example, in SNP250 K, there are on average more than 12 probes per probeset, while in SNP6.0, where the total number probes in an array is roughly the same as SNP250 K but the num- ber of probesets increases by 8 fold, resulting in the PPP being only about 6. This means that overlapping the probese ts of two platforms does not automatically create a platform-independent matrix that can be readily used for post-processing analyses. • Both the numbers of samples and the numbers of pro- bes per array can be huge. Since multiple-platforms are used, the total sample size is usually large. Fur- ther, even after overlapping the probesets, there may still be millions of probes to be handled. This may impose computational time and memory constraints that are beyond the capability a normal PC. To handle these problems, the following strategies are adopted: • Cross-platform normalization. Even though the plat- forms may have variable numbers of probes, it is as- sumed that this does not affect the overall binding af- finity. A cross-platform normalization is key to make sure that the probe signals are calibrated to the same benchmarks. • Division of samples into tasks, and probesets into 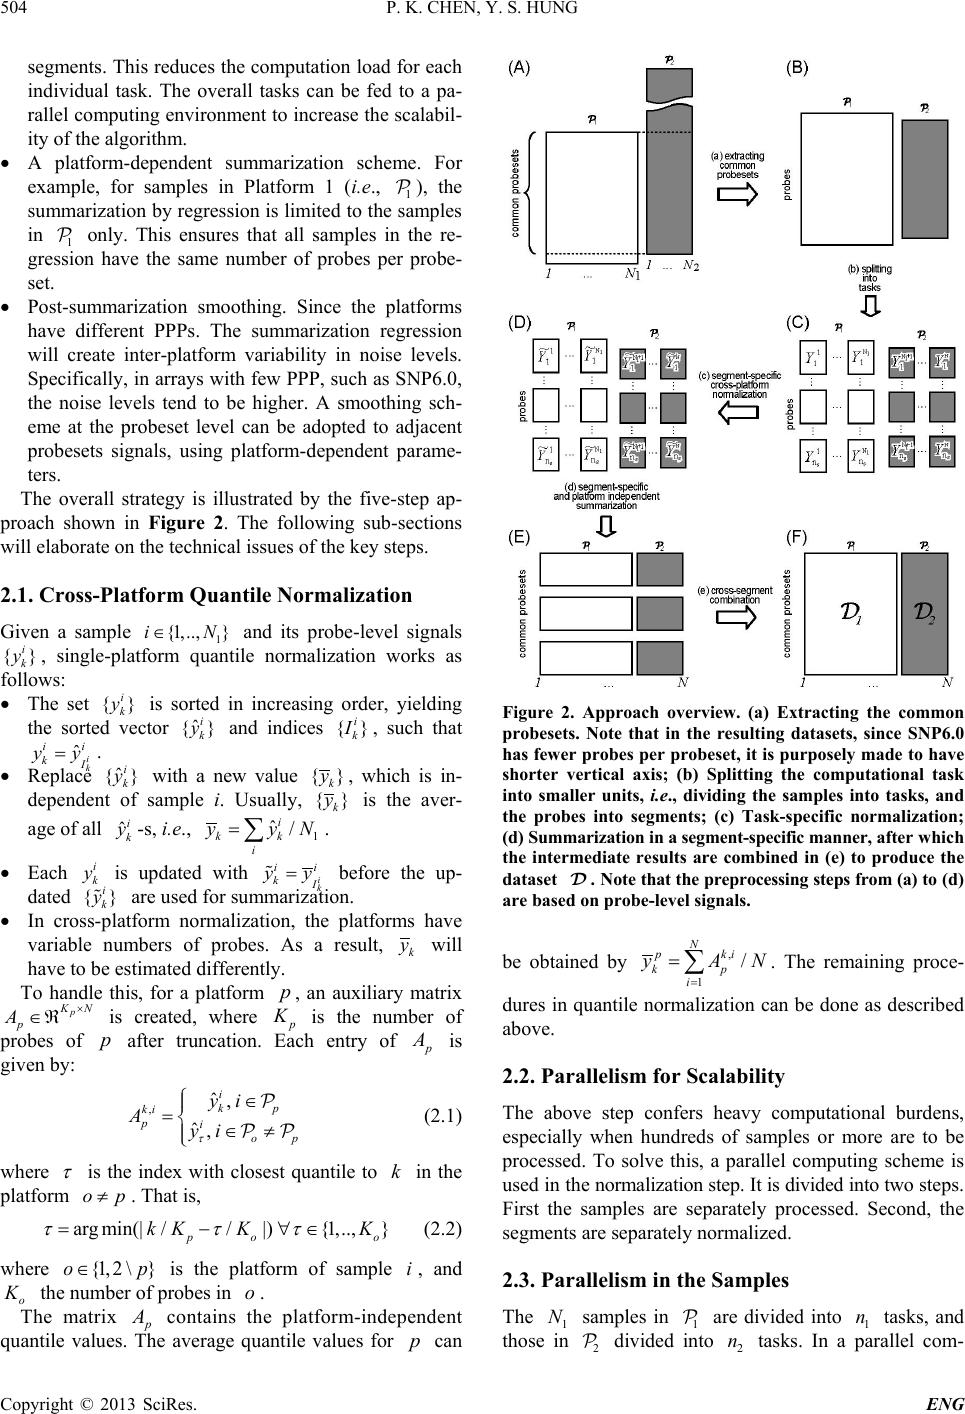 P. K. CHEN, Y. S. HUNG Copyright © 2013 SciRes. ENG segments. This reduces the computation load for each individual task. The overall tasks can be fed to a pa- rallel computing environment to increase the scalabil- ity of the algorithm. • A platform-dependent summarization scheme. For example, for samples in Platform 1 (i.e., ), the summarization by regression is limited to the s amples in only. This ensures that all samples in the re- gression have the same number of probes per probe- set. • Post-summarization smoothing. Since the platforms have different PPPs. The summarization regression will create inter-platform variability in noise levels. Specifically, in arrays with few PPP, such as SNP6.0, the noise levels tend to be higher. A smoothing sch- eme at the probeset level can be adopted to adjacent probesets signals, using platform-dependent parame- ters. The overall strategy is illustrated by the five-step ap- proach shown in Figure 2. The following sub-sections will elaborate on the technical issues of the key steps. 2.1. Cross-Platform Quantile Normalization Given a sample and its probe-level signals , single-platform quantile normalization works as follows: • The set is sorted in increasing order, yielding the sorted vector and indices , such that . • Replace with a new value , which is in- dependent of sample i. Usually, is the aver- age of all -s, i.e., . • Each is updated with before the up- dated are us ed for sum mariza t ion. • In cross-platform normalization, the platforms have variable numbers of probes. As a result, will have to be estimated differently. To handle this, for a platform , an auxiliary matrix is created, where is the number of probes of after truncation. Each entry of is given by: , ˆ, ˆ, i kp ki piop yi Ayi τ ∈ =∈≠ (2.1) where is the index with closest quantile to in the platform . That is, argmin(|//|){1,..,} po o kK KK τ ττ =− ∀∈ (2.2) where is the platform of sample , and o K the number of probes in . The matrix contains the platform-independent quantile values. The average quantile values for can Figure 2. Approach overview. (a) Extracting the common probesets. Note that in the resulting datasets, since SNP6.0 has fewer probes per probeset, it is purposely made to have shorter vertical axis; (b) Splitting the computational task into smaller units, i.e., dividing the samples into tasks, and the probes into segments; (c) Task-specific normalization; (d) Summarization in a segment-specific manner, after which the intermediate results are combined in (e) to produce the dataset . Note that the preprocessing steps from (a) to (d) are based on probe-level signals. be obtained by . The remaining proce- dures in quantile normalization can be done as described above. 2.2. Parallelism for Scalability The above step confers heavy computational burdens, especially when hundreds of samples or more are to be processed. To solve this, a parallel computing scheme is used in the normalization s tep . I t is d ivid ed i nto two steps. First the samples are separately processed. Second, the segments are separately normalized. 2.3. Parallelism in the Samples The samples in are divided into tasks, and those in divided into tasks. In a parallel com- 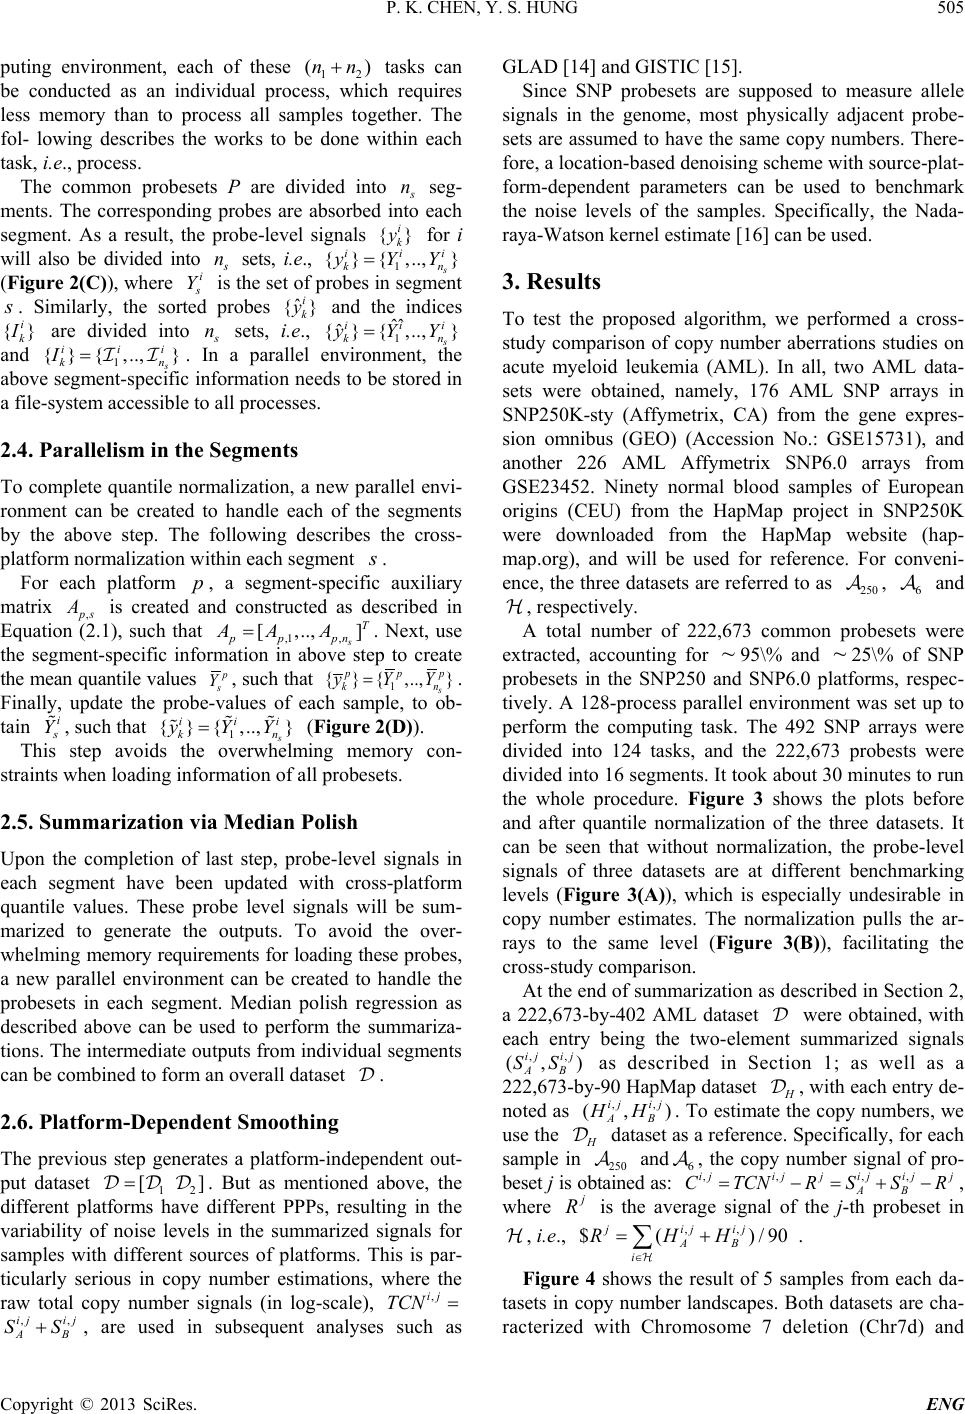 P. K. CHEN, Y. S. HUNG Copyright © 2013 SciRes. ENG puting environment, each of these tasks can be conducted as an individual process, which requires less memory than to process all samples together. The fol- lowing describes the works to be done within each task, i.e., process. The common probesets P are divided into seg- ments. The corresponding probes are absorbed into each segment. As a result, the probe-level signals for i will also be divided into sets, i.e., (Figure 2(C)), where is the set of probes in segment . Similarly, the sorted probes and the indices are divided into sets, i.e., and . In a parallel environment, the above segment-specific information needs to be stored in a file-system accessible to all processes. 2.4. Parallelism in the Segments To complete quantile normalization, a new parallel envi- ronment can be created to handle each of the segments by the above step. The following describes the cross- platform normalization within each segment . For each platform , a segment-specific auxiliary matrix is created and constructed as described in Equation (2.1), such that . Next, use the segment-specific information in above step to create the mean quantil e values , such that . Finally, update the probe-values of each sample, to ob- tain , such that (Figure 2(D)). This step avoids the overwhelming memory con- straints when loading information of all probesets. 2.5. Summarization via Median Polish Upon the completion of last step, probe-level signals in each segment have been updated with cross-platform quantile values. These probe level signals will be sum- marized to generate the outputs. To avoid the over- whelming memory requirements for loading these probes, a new parallel environment can be created to handle the probesets in each segment. Median polish regression as described above can be used to perform the summariza- tions. The intermediate outputs from individual segments can be combined to form an overall dataset . 2.6. Platform-Dependent Smoothing The previous step generates a platform-independent out- put dataset . But as mentioned above, the different platforms have different PPPs, resulting in the variability of noise levels in the summarized signals for samples with different sources of platforms. This is par- ticularly serious in copy number estimations, where the raw total copy number signals (in log-scale), , are used in subsequent analyses such as GLAD [14] and GISTIC [15]. Since SNP probesets are supposed to measure allele signals in the genome, most physically adjacent probe- sets are assumed to have the same copy numbers. There- fore, a location-based denoising scheme with source-plat- form-dependent parameters can be used to benchmark the noise levels of the samples. Specifically, the Nada- raya-Watson kernel estimate [16] can be used. 3. Results To test the proposed algorithm, we performed a cross- study comparison of copy number aberrations studies on acute myeloid leukemia (AML). In all, two AML data- sets were obtained, namely, 176 AML SNP arrays in SNP250K-sty (Affymetrix, CA) from the gene expres- sion omnibus (GEO) (Accession No.: GSE15731), and another 226 AML Affymetrix SNP6.0 arrays from GSE23452. Ninety normal blood samples of European origins (CEU) from the HapMap project in SNP250K were downloaded from the HapMap website (hap- map.org), and will be used for reference. For conveni- ence, the three datasets are referred to as , and , respectively. A total number of 222,673 common probesets were extracted, accounting for 95\% and 25\% of SNP probesets in the SNP250 and SNP6.0 platforms, respec- tively. A 128-process parallel environment was set up to perform the computing task. The 492 SNP arrays were divided into 124 tasks, and the 222,673 probests were divided into 16 segments. It took about 30 minutes to run the whole procedure. Figure 3 shows the plots before and after quantile normalization of the three datasets. It can be seen that without normalization, the probe-level signals of three datasets are at different benchmarking levels (Figure 3(A)), which is especially undesirable in copy number estimates. The normalization pulls the ar- rays to the same level (Figure 3(B)), facilitating the cross-study comparison. At the end of summarization as described in Section 2, a 222,673-by-402 AML dataset were obtained, with each entry being the two-element summarized signals as described in Section 1; as well as a 222,673-by-90 HapMap dataset , with each entry de- noted as . To estimate the copy numbers, we use the dataset as a reference. Specifically, for each sample in and , the copy number signal of pro- beset j is obtained as: , ,,,ijij jijijj AB CTCNR SSR=−=+− , where j is the average signal of the j-th probeset in , i.e., ,, $() / 90 jij ij AB i R HH ∈ = + ∑ . Figure 4 shows the result of 5 samples from each da- tasets in copy number landscapes. Both datasets are cha- racterized with Chromosome 7 deletion (Chr7d) and  P. K. CHEN, Y. S. HUNG Copyright © 2013 SciRes. ENG Figure 3. Before and after cross-platform quantile normalization. (A) Probe-level boxplots of the three datasets before nor- malization. Red, AML SNP250 ( ); Green, HapMap CEU90 SNP250 ( ); Black, AML SNP6.0 ( 6 ); (B) Boxplots for the same samples after cross-platform quantile normalization. Chromosome 8 amplifications (Chr8a), which is consis- tent with a recent finding [17]. In Figu re 4(A), w he re th e TCNs are not smoothed, it can be seen that the SNP6 samples tend to have higher noise levels. This may cause serious problems in copy number analysis such as GIS- TIC [15]. A Gaussian window filtering with platform- dependent parameters, i.e., the width of the window, yields noise of the samples that are in the same levels (Figure 4(B)). 4. Conclusions In here we describe a scalable algorithm for merging cross-platform datasets of SNP arrays. It has major  P. K. CHEN, Y. S. HUNG Copyright © 2013 SciRes. ENG Figure 4. Copy number landscapes of selected samples of the two AML datasets, before and after smoothing. (A) Before smoothing; (B) After smoothing. Horizontal axis is chromosomes. Vertical axis is the copy number signal values. The lower 5 samples in black are from the AML SNP250 dataset ( ), while the 5 green samples are from the AML SNP6.0 dataset ( 6 ). advantages that may help the biomedical community perform cross-platform study and cross-study compari- sons. First, the cross-platform normalization and source- dependent smoothing make it possible to have a plat- form-independent dataset for probeset-level ana- lyses such as GLAD and GISTIC. Second, the algorithm is carefully designed to avoid computational time and memory constraints. The break- down of the original computing task into smaller units vastly increases the scalability of the algorithm so that hundreds of arrays or more can be processed simulta-  P. K. CHEN, Y. S. HUNG Copyright © 2013 SciRes. ENG neously and completed within a reasonable time frame. 5. Acknowledgements The work describe d in this paper is partially support ed by the Hong Kong SAR RGC GRF (Project No HKU_ 762111M) and CRCG of the University of Hong Kong. REFERENCES [1] N. Rabbee and T. P. Speed, “A Genotype Calling Algo- rithm for Affymetrix SNP Arrays,” Bioinformatics, Vol. 22, No. 1, 2006, pp. 7-12. http://dx.doi.org/10.1093/bioinformatics/bti741 [2] B. Carvalho, H. Bengtsson, et al., “Exploration, Norma- lization, and Genotype Calls of High-Density Oligonuc- leotide SNP Array Data,” Biostatistics, Vol. 8, No. 2, 2007, pp. 485-499. http://dx.doi.org/10.1093/biostatistics/kxl042 [3] Affymetrix, “BRLMM: An Improved Genotype Calling Method for the Genechip Human Mapping 500k Array Set,” Affymetrix Inc., Tech. Rep., 2006. [4] Y. Nannya, M. Sanada, et al., “A Robust Algorithm for Copy Number Detection Using High-Density Oligonuc- leotide Single Nucleotide Polymorphism Genotyping Ar- rays,” Cancer Research, Vol. 65, No. 14, 2005, pp. 6071- 6079. http://dx.doi.org/10.1158/0008-5472.CAN-05-0465 [5] G. Yamamoto, Y. Nannya, et al., “Highly Sensitive Me- thod for Genomewide Detection of Allelic Composition in Non-Paired, Primary Tumor Specimens by Use of Af- fymetrix Single-Nucleotide-Polymorphism Genotyping Microarrays,” American Journal of Human Genetics, Vol. 81, No. 1, 2007, pp. 114-126. http://dx.doi.org/10.1086/518809 [6] Affymetrix, “Cnat4.0: Copy Numbers and Loss of Hete- rozygosity Estimation Algorithms for the Genechip Hu- man Mapping 10/50/100/250/500k Array Set,” Affyme- trix Inc., Tech. Rep., 2007. [7] H. Bengtsson, P. Wirapati and T. P. Speed, “A Single- Array Preprocessing Method for Estimating Full-Resolu- tion Raw Copy Numbers from All Affymetrix Genotyp- ing Arrays Including Genome-Wide Snp5&6,” Bioinfor- matics, Vol. 25, No. 17, 2009, pp. 2149-2156. http://dx.doi.org/10.1093/bioinformatics/btp371 [8] H. Bengtsson, A. Ray, et al., “A Single-Sample Method for Normalizing and Combining Full-Resolution Copy Numbers from Multiple Platforms, Labs and Analysis Methods,” Bioinformatics, Vol. 25, No. 7, 2009, pp. 861- 867. [9] R. Bosotti, G. Locatelli, et al., “Cross Platform Microar- ray Analysis for Robust Identification of Differentially Expressed Genes,” BMC Bioinformatics, Vol. 8, Supple- ment 1, 2007, p. S5. http://dx.doi.org/10.1186/1471-2105-8-S1-S5 [10] A. A. Shabalin, H. Tjelm eland , et al., “Merging Two Gene- Expression Studies via Cross-Platform Normalization,” Bioinformatics, Vol. 24, No. 9, 2008, pp. 1154¨ C60. [11] F. Klinglmueller, T. Tuechler and M. Posch, “Cross- Platform Comparison of Microarray Data Using Order Restricted Inference,” Bioinformatics, Vol. 27, No. 7, 2011, pp. 953-960. [12] Y. Xiao, M. R. Segal, et al., “A Multi-Array Multi-SNP Genotyping Algorithm for Affymetrix SNP Microarrays,” Bioinformatics, Vol. 23, No. 12, 2007, pp. 1459-1467. [13] H. Bengtsson, K. Simpson, et al., “aroma.affymetrix: A Generic Framework in R for Analyzing Small to Very Large Affymetrix Data Sets in Bounded Memory,” Tech. Rep., February 2008. [14] P. Hupe, N. Stransky, et al., “Analysis of Array CGH Data: From Signal Ratio to Gain and Loss of DNA Re- gions,” Bioinformatics, Vol. 20, No. 18, 2004, pp. 3413- 3422. [15] R. Beroukhim, G. Getz, et al., “Assessing the Signifi- cance of Chromosomal Aberrations in Cancer: Metho- dology and Application to Glioma,” Proceedings of the National Academy of Sciences of the United States of America, Vol. 104, No. 50, 2007, pp. 20007-20012. [16] M. G. Schimek, “Smoothing and Regre ssion: Approaches, Computation, and Application,” Wiley Series in Probabil- ity and Statistics Applied Probability and Statistics Sec- tion, Wiley, New York, 2000. http://dx.doi.org/10.1002/9781118150658 [17] M. J. Walter, J. E. Payton, et al., “Acquired Copy Num- ber Alterations in Adult Acute Myeloid Leukemia Ge- nomes,” Proceedings of the National Academy of Sci- ences of the United States of America, Vol. 106, No. 31, 2009, pp. 12950-12955.
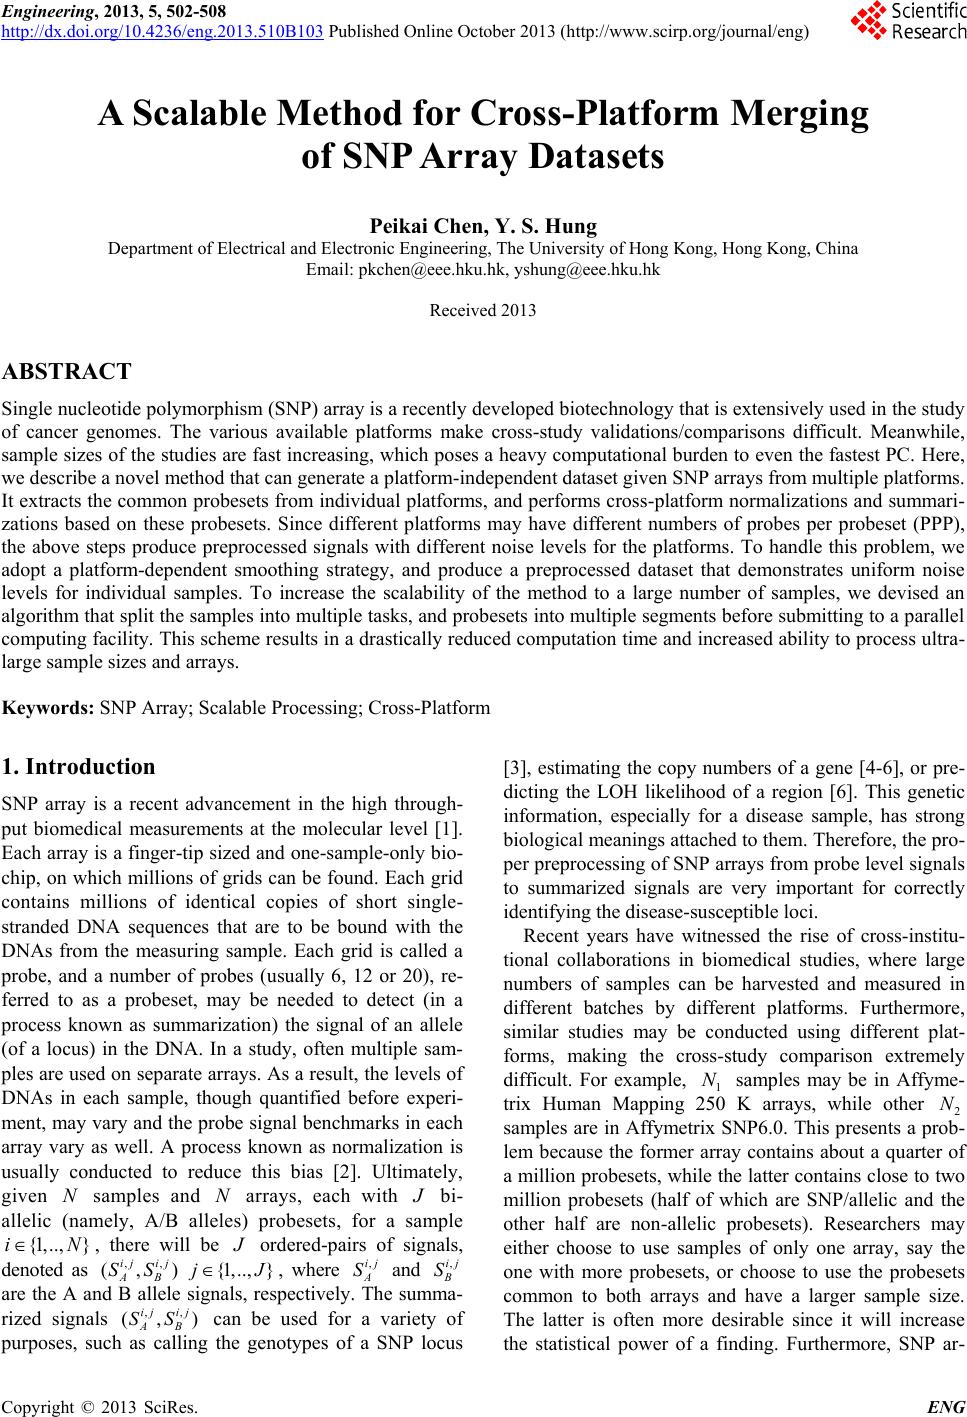
|