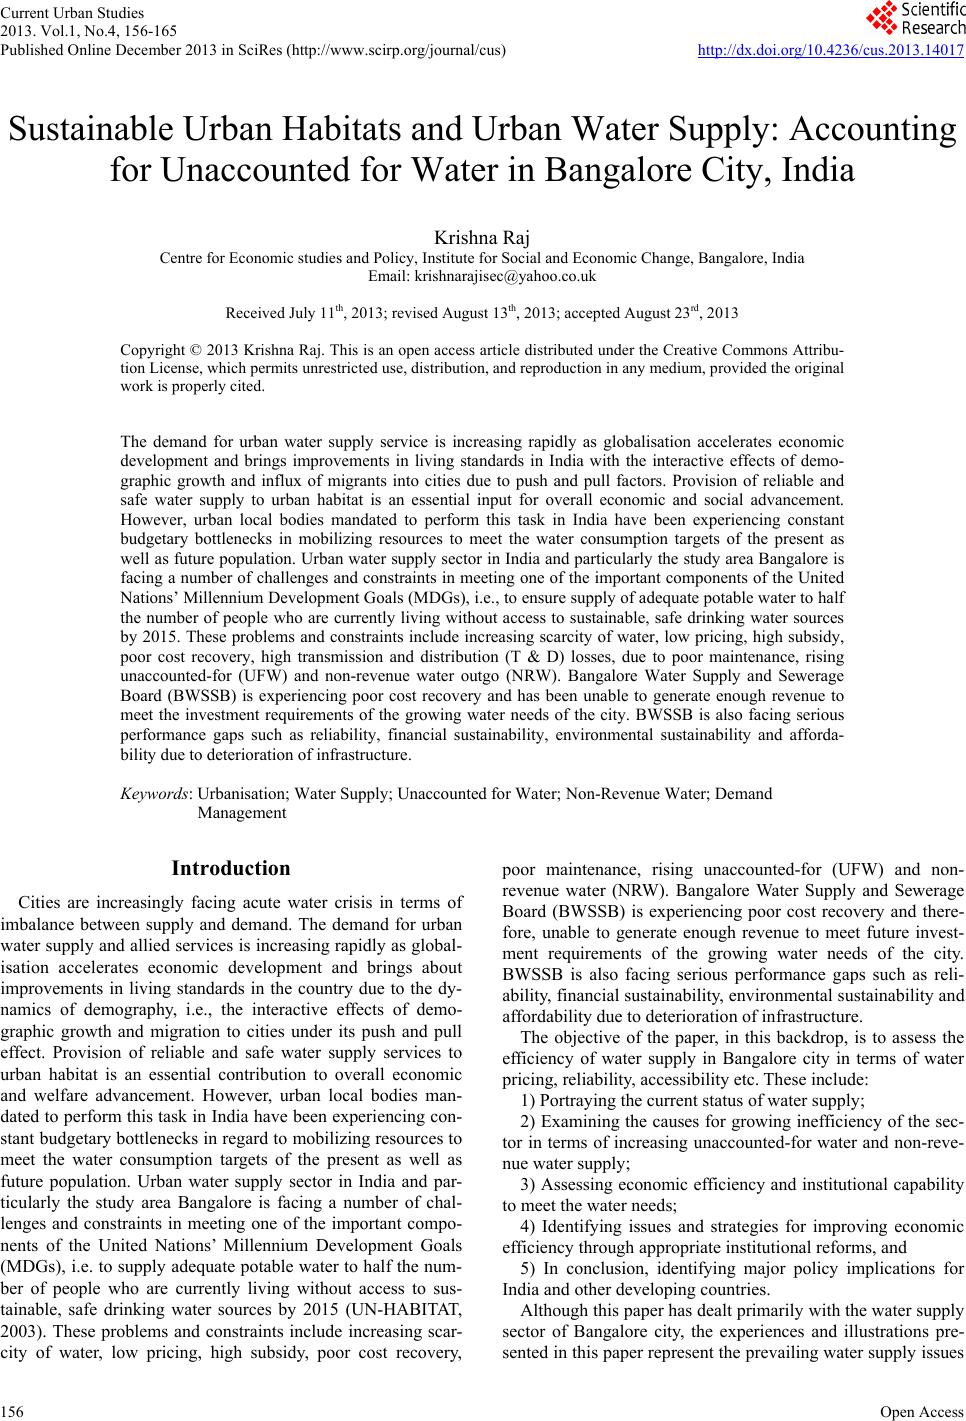
 Current Urban Studies 2013. Vol.1, No.4, 156-165 Published Online December 2013 in SciRes (http://www.scirp.org/journal/cus) http://dx.doi.org/10.4236/cus.2013.14017 Open Access 156 Sustainable Urban Habitats and Urban Water Supply: Accounting for Unaccounted for Water in Bangalore City, India Krishna Raj Centre for Economic studies and Policy, Institute for Social and Economic Change, Bangalore, India Email: krishnarajisec@yahoo.co.uk Received July 11th, 2013; revised August 13th, 2013; accepted August 23rd, 2013 Copyright © 2013 Krishna Raj. This is an open access article distributed under the Creative Commons Attribu- tion License, which permits unrestricted use, distribution, and reproduction in any medium, provided the original work is properly cited. The demand for urban water supply service is increasing rapidly as globalisation accelerates economic development and brings improvements in living standards in India with the interactive effects of demo- graphic growth and influx of migrants into cities due to push and pull factors. Provision of reliable and safe water supply to urban habitat is an essential input for overall economic and social advancement. However, urban local bodies mandated to perform this task in India have been experiencing constant budgetary bottlenecks in mobilizing resources to meet the water consumption targets of the present as well as future population. Urban water supply sector in India and particularly the study area Bangalore is facing a number of challenges and constraints in meeting one of the important components of the United Nations’ Millennium Development Goals (MDGs), i.e., to ensure supply of adequate potable water to half the number of people who are currently living without access to sustainable, safe drinking water sources by 2015. These problems and constraints include increasing scarcity of water, low pricing, high subsidy, poor cost recovery, high transmission and distribution (T & D) losses, due to poor maintenance, rising unaccounted-for (UFW) and non-revenue water outgo (NRW). Bangalore Water Supply and Sewerage Board (BWSSB) is experiencing poor cost recovery and has been unable to generate enough revenue to meet the investment requirements of the growing water needs of the city. BWSSB is also facing serious performance gaps such as reliability, financial sustainability, environmental sustainability and afforda- bility due to deterioration of infrastructure. Keywords: Urbanisation; Water Supply; Unaccounted for Water; Non-Revenue Water; Demand Management Introduction Cities are increasingly facing acute water crisis in terms of imbalance between supply and demand. The demand for urban water supply and allied services is increasing rapidly as global- isation accelerates economic development and brings about improvements in living standards in the country due to the dy- namics of demography, i.e., the interactive effects of demo- graphic growth and migration to cities under its push and pull effect. Provision of reliable and safe water supply services to urban habitat is an essential contribution to overall economic and welfare advancement. However, urban local bodies man- dated to perform this task in India have been experiencing con- stant budgetary bottlenecks in regard to mobilizing resources to meet the water consumption targets of the present as well as future population. Urban water supply sector in India and par- ticularly the study area Bangalore is facing a number of chal- lenges and constraints in meeting one of the important compo- nents of the United Nations’ Millennium Development Goals (MDGs), i.e. to supply adequate potable water to half the num- ber of people who are currently living without access to sus- tainable, safe drinking water sources by 2015 (UN-HABITAT, 2003). These problems and constraints include increasing scar- city of water, low pricing, high subsidy, poor cost recovery, poor maintenance, rising unaccounted-for (UFW) and non- revenue water (NRW). Bangalore Water Supply and Sewerage Board (BWSSB) is experiencing poor cost recovery and there- fore, unable to generate enough revenue to meet future invest- ment requirements of the growing water needs of the city. BWSSB is also facing serious performance gaps such as reli- ability, financial sustainability, environmental sustainability and affordability due to deterioration of infrastructure. The objective of the paper, in this backdrop, is to assess the efficiency of water supply in Bangalore city in terms of water pricing, reliability, accessibility etc. These include: 1) Portraying the current status of water supply; 2) Examining the causes for growing inefficiency of the sec- tor in terms of increasing unaccounted-for water and non-reve- nue water supply; 3) Assessing economic efficiency and institutional capability to meet the water needs; 4) Identifying issues and strategies for improving economic efficiency through appropriate institutional reforms, and 5) In conclusion, identifying major policy implications for India and other developing countries. Although this paper has dealt primarily with the water supply sector of Bangalore city, the experiences and illustrations pre- sented in this paper represent the prevailing water supply issues 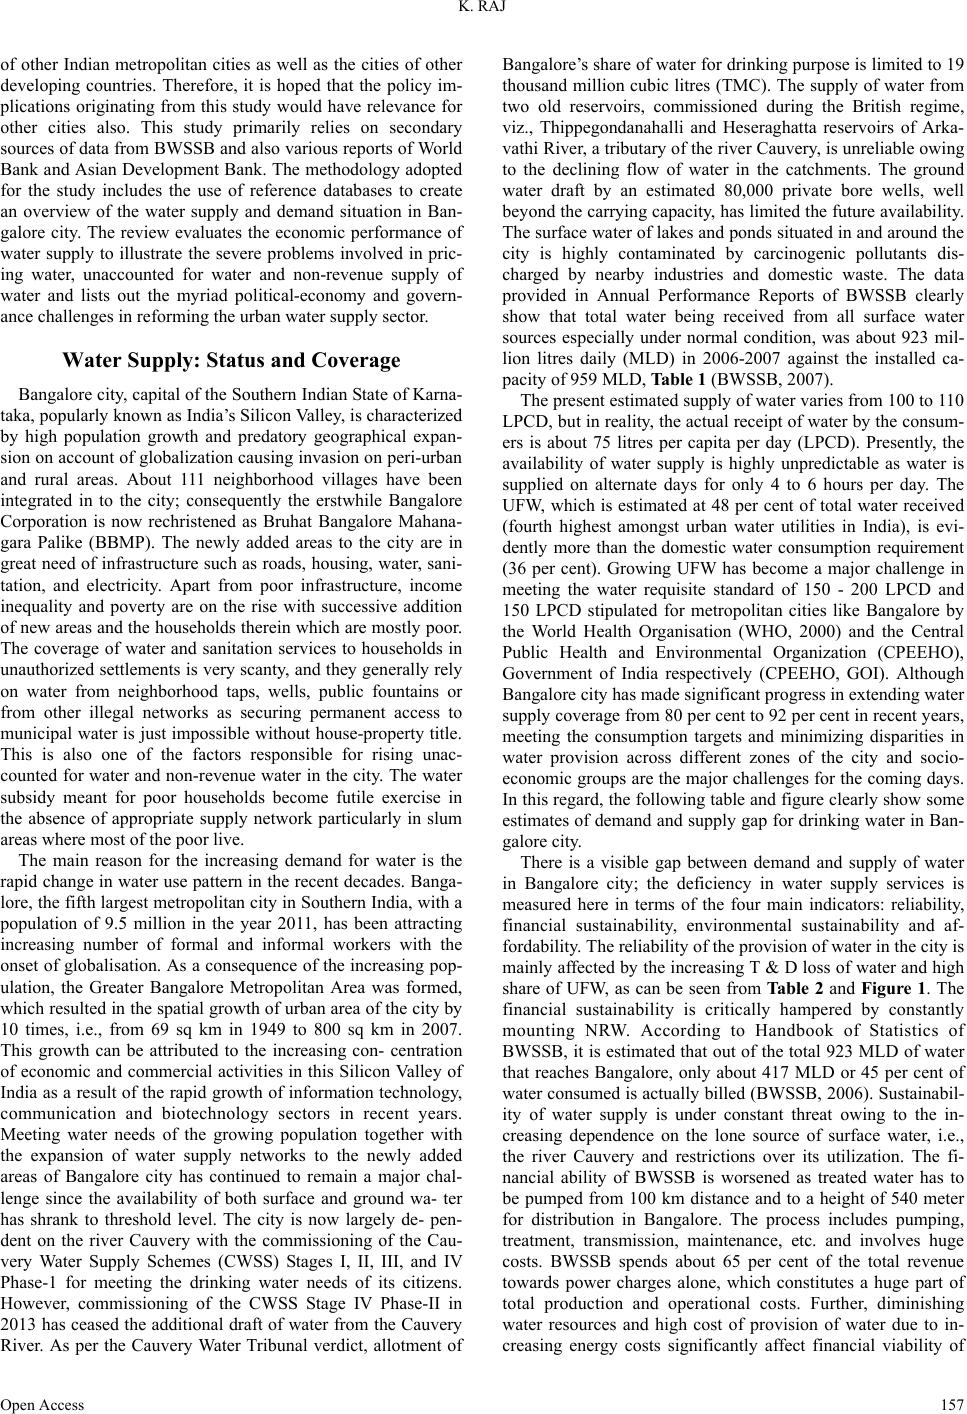 K. RAJ of other Indian metropolitan cities as well as the cities of other developing countries. Therefore, it is hoped that the policy im- plications originating from this study would have relevance for other cities also. This study primarily relies on secondary sources of data from BWSSB and also various reports of World Bank and Asian Development Bank. The methodology adopted for the study includes the use of reference databases to create an overview of the water supply and demand situation in Ban- galore city. The review evaluates the economic performance of water supply to illustrate the severe problems involved in pric- ing water, unaccounted for water and non-revenue supply of water and lists out the myriad political-economy and govern- ance challenges in reforming the urban water supply sector. Water Supply: Status and Coverage Bangalore city, capital of the Southern Indian State of Karna- taka, popularly known as India’s Silicon Valley, is characterized by high population growth and predatory geographical expan- sion on account of globalization causing invasion on peri-urban and rural areas. About 111 neighborhood villages have been integrated in to the city; consequently the erstwhile Bangalore Corporation is now rechristened as Bruhat Bangalore Mahana- gara Palike (BBMP). The newly added areas to the city are in great need of infrastructure such as roads, housing, water, sani- tation, and electricity. Apart from poor infrastructure, income inequality and poverty are on the rise with successive addition of new areas and the households therein which are mostly poor. The coverage of water and sanitation services to households in unauthorized settlements is very scanty, and they generally rely on water from neighborhood taps, wells, public fountains or from other illegal networks as securing permanent access to municipal water is just impossible without house-property title. This is also one of the factors responsible for rising unac- counted for water and non-revenue water in the city. The water subsidy meant for poor households become futile exercise in the absence of appropriate supply network particularly in slum areas where most of the poor live. The main reason for the increasing demand for water is the rapid change in water use pattern in the recent decades. Banga- lore, the fifth largest metropolitan city in Southern India, with a population of 9.5 million in the year 2011, has been attracting increasing number of formal and informal workers with the onset of globalisation. As a consequence of the increasing pop- ulation, the Greater Bangalore Metropolitan Area was formed, which resulted in the spatial growth of urban area of the city by 10 times, i.e., from 69 sq km in 1949 to 800 sq km in 2007. This growth can be attributed to the increasing con- centration of economic and commercial activities in this Silicon Valley of India as a result of the rapid growth of information technology, communication and biotechnology sectors in recent years. Meeting water needs of the growing population together with the expansion of water supply networks to the newly added areas of Bangalore city has continued to remain a major chal- lenge since the availability of both surface and ground wa- ter has shrank to threshold level. The city is now largely de- pen- dent on the river Cauvery with the commissioning of the Cau- very Water Supply Schemes (CWSS) Stages I, II, III, and IV Phase-1 for meeting the drinking water needs of its citizens. However, commissioning of the CWSS Stage IV Phase-II in 2013 has ceased the additional draft of water from the Cauvery River. As per the Cauvery Water Tribunal verdict, allotment of Bangalore’s share of water for drinking purpose is limited to 19 thousand million cubic litres (TMC). The supply of water from two old reservoirs, commissioned during the British regime, viz., Thippegondanahalli and Heseraghatta reservoirs of Arka- vathi River, a tributary of the river Cauvery, is unreliable owing to the declining flow of water in the catchments. The ground water draft by an estimated 80,000 private bore wells, well beyond the carrying capacity, has limited the future availability. The surface water of lakes and ponds situated in and around the city is highly contaminated by carcinogenic pollutants dis- charged by nearby industries and domestic waste. The data provided in Annual Performance Reports of BWSSB clearly show that total water being received from all surface water sources especially under normal condition, was about 923 mil- lion litres daily (MLD) in 2006-2007 against the installed ca- pacity of 959 MLD, Table 1 (BWSSB, 2007). The present estimated supply of water varies from 100 to 110 LPCD, but in reality, the actual receipt of water by the consum- ers is about 75 litres per capita per day (LPCD). Presently, the availability of water supply is highly unpredictable as water is supplied on alternate days for only 4 to 6 hours per day. The UFW, which is estimated at 48 per cent of total water received (fourth highest amongst urban water utilities in India), is evi- dently more than the domestic water consumption requirement (36 per cent). Growing UFW has become a major challenge in meeting the water requisite standard of 150 - 200 LPCD and 150 LPCD stipulated for metropolitan cities like Bangalore by the World Health Organisation (WHO, 2000) and the Central Public Health and Environmental Organization (CPEEHO), Government of India respectively (CPEEHO, GOI). Although Bangalore city has made significant progress in extending water supply coverage from 80 per cent to 92 per cent in recent years, meeting the consumption targets and minimizing disparities in water provision across different zones of the city and socio- economic groups are the major challenges for the coming days. In this regard, the following table and figure clearly show some estimates of demand and supply gap for drinking water in Ban- galore city. There is a visible gap between demand and supply of water in Bangalore city; the deficiency in water supply services is measured here in terms of the four main indicators: reliability, financial sustainability, environmental sustainability and af- fordability. The reliability of the provision of water in the city is mainly affected by the increasing T & D loss of water and high share of UFW, as can be seen from Ta bl e 2 and Figure 1. The financial sustainability is critically hampered by constantly mounting NRW. According to Handbook of Statistics of BWSSB, it is estimated that out of the total 923 MLD of water that reaches Bangalore, only about 417 MLD or 45 per cent of water consumed is actually billed (BWSSB, 2006). Sustainabil- ity of water supply is under constant threat owing to the in- creasing dependence on the lone source of surface water, i.e., the river Cauvery and restrictions over its utilization. The fi- nancial ability of BWSSB is worsened as treated water has to be pumped from 100 km distance and to a height of 540 meter for distribution in Bangalore. The process includes pumping, treatment, transmission, maintenance, etc. and involves huge costs. BWSSB spends about 65 per cent of the total revenue towards power charges alone, which constitutes a huge part of total production and operational costs. Further, diminishing water resources and high cost of provision of water due to in- reasing energy costs significantly affect financial viability of c Open Access 157  K. RAJ Open Access 158 Table 1. Water sources of Bangalore city and installed capacity. Sl. No Sources Year of commissioning Distance to Bangalore Installed capacity (MLD) Availability (MLD) 1 Heseraghatta 1986 18 36 00 2 Thippagondana Halli 1933 28 148 58 3 Cauvery Stage I 1974 100 135 145 4 Cauvery Stage II 1982 100 135 146 5 Cauvery Stage III 1993 100 270 324 6 Cauvery Stage IV Phase-I 2002 100 270 250 7 Cauvery Stage IV Phase-II* 2011 100 500** 00 Total Water Availability - - 959 923 Note: *Work has been taken up since 2007; **Proposed water supply. Table 2. Demand and supply gap for drinking water (in MLD) in Bangalore. Water Needs/Demand Shortage Year Population (Lakhs) Water Potential Available Net Water Supply UFW At 150 LPCD At 200 LPCD At 150 LPCD At 200 LPCD 2000 57 705 433 218 (33) 862 1150 −157 −445 2001 62 705 458 220 (32) 934 1245 −229 −540 2002 64 995 462 250 (35) 966 1288 29 −293 2003 67 995 484 269 (36) 999 1333 −4 −338 2004 64 959 512 331 (39) 956 1275 3 −316 2005 65 959 542 340 (39) 981 1309 −22 −350 2006 67 959 531 372 (41) 1006 1342 −46 −383 2007 70 959 550 509 (48) 1032 1376 −73 −417 Figure 1. Gross, net supply and un-accounted for water in Bangalore city. the Board. The estimated cost of production and distribution of water to Bangalore has increased from Rs 12 per kilo litre to Rs 23 per kilo litre in the last five years, which is now the highest among urban water utilities of cities like Mumbai (Rs 2.17) and Chennai (Rs 5.73). The average cost of water supply has in- creased from Rs 3.60 to 13.20 per cubic meter (m3) while the average revenue has increased only from Rs 2.60 to 8.67/m3. The undue increase in the cost of water supply and the sluggish  K. RAJ increase in revenue earnings are found to be due to inefficient management. While the demand for water increased by 16 per cent during the period 1991 to 2001, the increase was by 20 per cent during the period 2001 to 2010 (Saleth & Sastry, 2004). The increase in the production cost of water particularly when the demand for water is growing is highly distressing, given the lowering ground water table and the limited surface water available. Causes and Effects of Inefficiency in Urban Water Supply Increasing share of UFW (the difference between water pro- duced minus water consumed and water in store) in total water production has significantly reduced the water availability for domestic and non-domestic/productive use. About 48 per cent of water currently distributed is UFW, which is very high as compared to the level of UFW in well managed urban water supply systems (15 - 20 per cent) across world cities. The per- centage of UFW in Indian metropolitan cities is as follows: Kolkata 50 per cent, Chennai 20 per cent, Delhi 26 per cent and Mumbai 18 per cent. The total water loss (UFW) is as high as 509 MLD in Bangalore. This wasted or un-metered amount of water would be more than sufficient to eliminate unmet water demand norm of 150 LPCD for Bangalore city. Presently, the actual availability of water for domestic consumption is just about 75 LPCD against the official estimation of 120 LPCD. The difference between the estimated quantity and the actually billed-for quantity of water comes to 45 LPCD. This huge loss is directly attributed to the water seepage at various stages of supply. Water leakages largely take place at distribution mains, service pipes and stand posts and together account for 88.5 per cent of water spillover, the rest being low leakages at main valve, meter joint stop valve, ferrule, air valve and others (Ta- ble 3 and Figure 2). The augmented water supply through various stages of Cau- very river water supply projects has been offset by the pre- dominance of UFW; conversely, enhancement of per capita water availability to 150 LPCD remains unfulfilled as several unauthorized water connections siphon off half the water pro- duced. Despite the offer of BWSSB to regularize unauthorized connections if applied within a stipulated time and the threat of imposing a of penalty of Rs. 10,000 apart from six months im- prisonment for unauthorized water pilferage continues unabated in the city. Poor recovery of operational, maintenance and capital costs from user charges is attributed to the inefficiency of water sup- ply management in Bangalore city. BWSSB charges water tariff at Rs 5 per 1000 litres of water. However, supplying of 1,000 liters of water costs Rs 40 and as a result of which, the Board incurs an annual revenue loss of Rs. 27 crores owing to the prevalence of high UFW and poor tariff collection. Thus, the revenue generated from water supply services is insufficient even to meet the O & M costs of BWSSB; therefore, the Board is perennially dependent on the state government for funding. Financial support of government has become inevitable in the present context of rising electricity charges, poor O & M, dete- rioration of water supply service assets and unwillingness of decision makers to increase water tariffs. These factors have further aggravated the poor health of water supply services. Research evidence shows that in Bangalore, politicians are un- willing to raise water tariffs despite evidence of people’s will- Table 3. Type of leakages in the pilot project area. Sl No. Type of leakages Per cent 1 Main 38.1 2 Service Pipe 32.8 3 Stand post 17.6 4 Main Valve 6.6 5 Meter joint 2.0 6 Stop valve 1.6 7 Ferrule 0.7 8 Air valve 0.1 9 Others 0.5 Total 100 Source: BWSSB annual performance report 2005-06. Figure 2. Types of unaccounted for water leakages. ingness to pay more for a good quality of water supply services. The poor quality of water supply services in the city is attrib- uted to the unrevised domestic tariff rates coupled with poor metering, increase in non-revenue water and deteriorating effi- ciency in O & M of infrastructure. Water quality has deterio- rated in the city due to inadequate sewage, effluent discharge and wastewater treatment facilities. This in turn has resulted in the occurrence of water-borne diseases in several localities, and contributed to productivity losses and mounting health costs. Poor water delivery is also imposing indirect coping costs on households in terms of time spent in fetching water, which is increasingly depriving education to many girls, particularly those living in the slums of the city. Growing Scarcity of Drinking Water in Bangalore: Issues Bangalore city has prospered not only due to industrialization but also due to rapid urbanization and population growth. Con- sequently, demand for water has been witnessing an increasing trend over the years. Projections of water demand in Bangalore under various future scenarios have shown that there will be growing mismatch between demand and supply of water. Plug- ging this demand-supply gap and ensuring sustainability of resources and their efficient utilization are major policy chal- Open Access 159 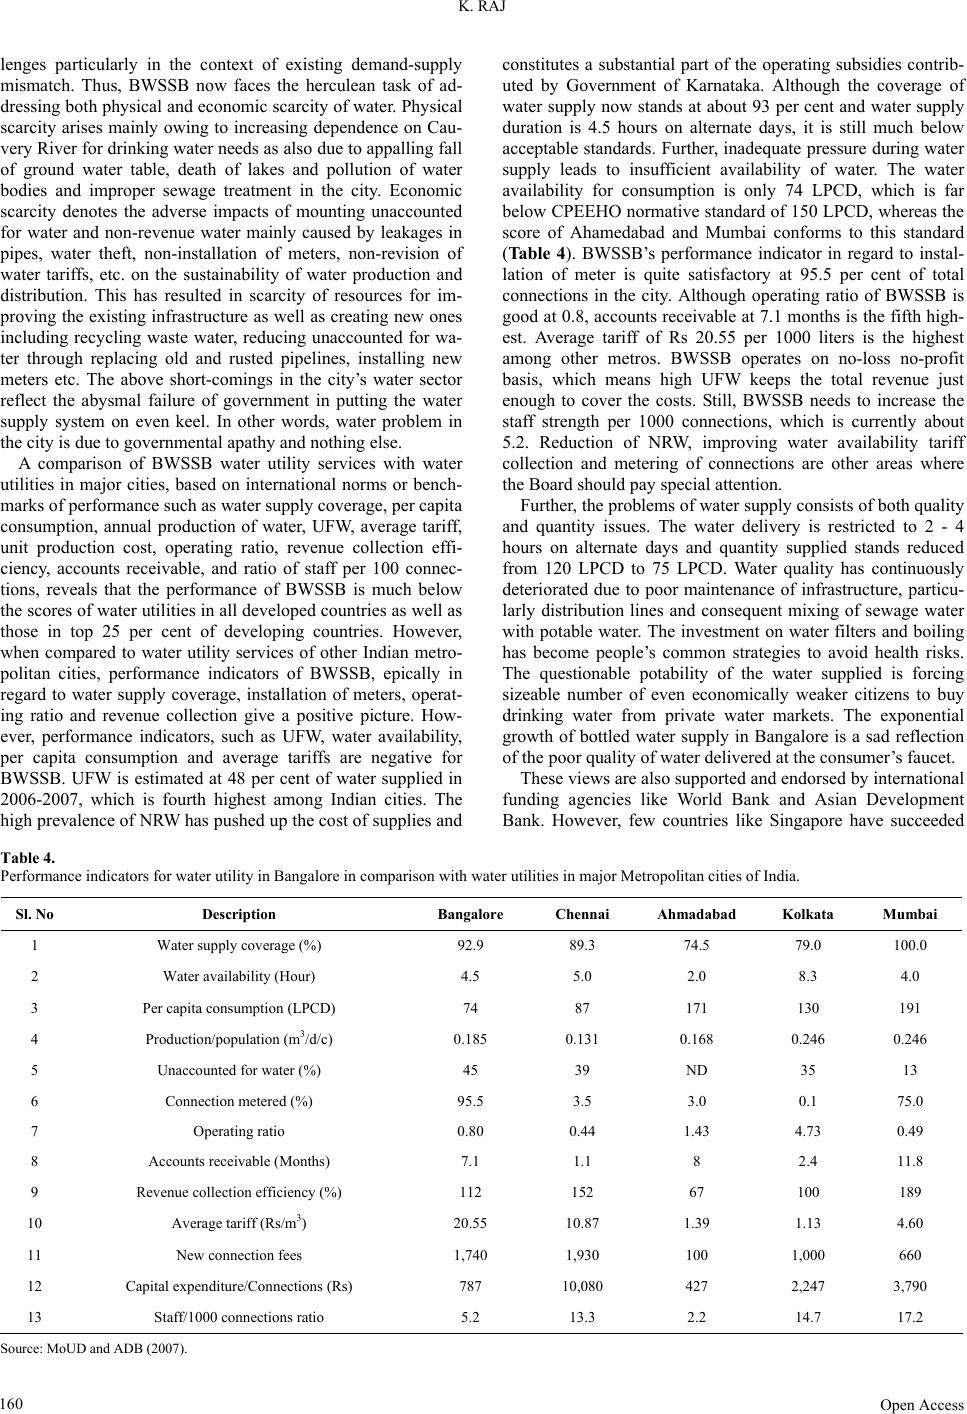 K. RAJ Open Access 160 lenges particularly in the context of existing demand-supply mismatch. Thus, BWSSB now faces the herculean task of ad- dressing both physical and economic scarcity of water. Physical scarcity arises mainly owing to increasing dependence on Cau- very River for drinking water needs as also due to appalling fall of ground water table, death of lakes and pollution of water bodies and improper sewage treatment in the city. Economic scarcity denotes the adverse impacts of mounting unaccounted for water and non-revenue water mainly caused by leakages in pipes, water theft, non-installation of meters, non-revision of water tariffs, etc. on the sustainability of water production and distribution. This has resulted in scarcity of resources for im- proving the existing infrastructure as well as creating new ones including recycling waste water, reducing unaccounted for wa- ter through replacing old and rusted pipelines, installing new meters etc. The above short-comings in the city’s water sector reflect the abysmal failure of government in putting the water supply system on even keel. In other words, water problem in the city is due to governmental apathy and nothing else. A comparison of BWSSB water utility services with water utilities in major cities, based on international norms or bench- marks of performance such as water supply coverage, per capita consumption, annual production of water, UFW, average tariff, unit production cost, operating ratio, revenue collection effi- ciency, accounts receivable, and ratio of staff per 100 connec- tions, reveals that the performance of BWSSB is much below the scores of water utilities in all developed countries as well as those in top 25 per cent of developing countries. However, when compared to water utility services of other Indian metro- politan cities, performance indicators of BWSSB, epically in regard to water supply coverage, installation of meters, operat- ing ratio and revenue collection give a positive picture. How- ever, performance indicators, such as UFW, water availability, per capita consumption and average tariffs are negative for BWSSB. UFW is estimated at 48 per cent of water supplied in 2006-2007, which is fourth highest among Indian cities. The high prevalence of NRW has pushed up the cost of supplies and constitutes a substantial part of the operating subsidies contrib- uted by Government of Karnataka. Although the coverage of water supply now stands at about 93 per cent and water supply duration is 4.5 hours on alternate days, it is still much below acceptable standards. Further, inadequate pressure during water supply leads to insufficient availability of water. The water availability for consumption is only 74 LPCD, which is far below CPEEHO normative standard of 150 LPCD, whereas the score of Ahamedabad and Mumbai conforms to this standard (Ta b le 4 ). BWSSB’s performance indicator in regard to instal- lation of meter is quite satisfactory at 95.5 per cent of total connections in the city. Although operating ratio of BWSSB is good at 0.8, accounts receivable at 7.1 months is the fifth high- est. Average tariff of Rs 20.55 per 1000 liters is the highest among other metros. BWSSB operates on no-loss no-profit basis, which means high UFW keeps the total revenue just enough to cover the costs. Still, BWSSB needs to increase the staff strength per 1000 connections, which is currently about 5.2. Reduction of NRW, improving water availability tariff collection and metering of connections are other areas where the Board should pay special attention. Further, the problems of water supply consists of both quality and quantity issues. The water delivery is restricted to 2 - 4 hours on alternate days and quantity supplied stands reduced from 120 LPCD to 75 LPCD. Water quality has continuously deteriorated due to poor maintenance of infrastructure, particu- larly distribution lines and consequent mixing of sewage water with potable water. The investment on water filters and boiling has become people’s common strategies to avoid health risks. The questionable potability of the water supplied is forcing sizeable number of even economically weaker citizens to buy drinking water from private water markets. The exponential growth of bottled water supply in Bangalore is a sad reflection of the poor quality of water delivered at the consumer’s faucet. These views are also supported and endorsed by international funding agencies like World Bank and Asian Development Bank. However, few countries like Singapore have succeeded Table 4. Performance indicators for water utility in Bangalore in comparison with water utilities in major Metropolitan cities of India. Sl. No Description Bangalore Chennai Ahmadabad Kolkata Mumbai 1 Water supply coverage (%) 92.9 89.3 74.5 79.0 100.0 2 Water availability (Hour) 4.5 5.0 2.0 8.3 4.0 3 Per capita consumption (LPCD) 74 87 171 130 191 4 Production/population (m3/d/c) 0.185 0.131 0.168 0.246 0.246 5 Unaccounted for water (%) 45 39 ND 35 13 6 Connection metered (%) 95.5 3.5 3.0 0.1 75.0 7 Operating ratio 0.80 0.44 1.43 4.73 0.49 8 Accounts receivable (Months) 7.1 1.1 8 2.4 11.8 9 Revenue collection efficiency (%) 112 152 67 100 189 10 Average tariff (Rs/m3) 20.55 10.87 1.39 1.13 4.60 11 New connection fees 1,740 1,930 100 1,000 660 12 Capital expenditure/Connections (Rs) 787 10,080 427 2,247 3,790 13 Staff/1000 connections ratio 5.2 13.3 2.2 14.7 17.2 Source: MoUD and ADB (2007). 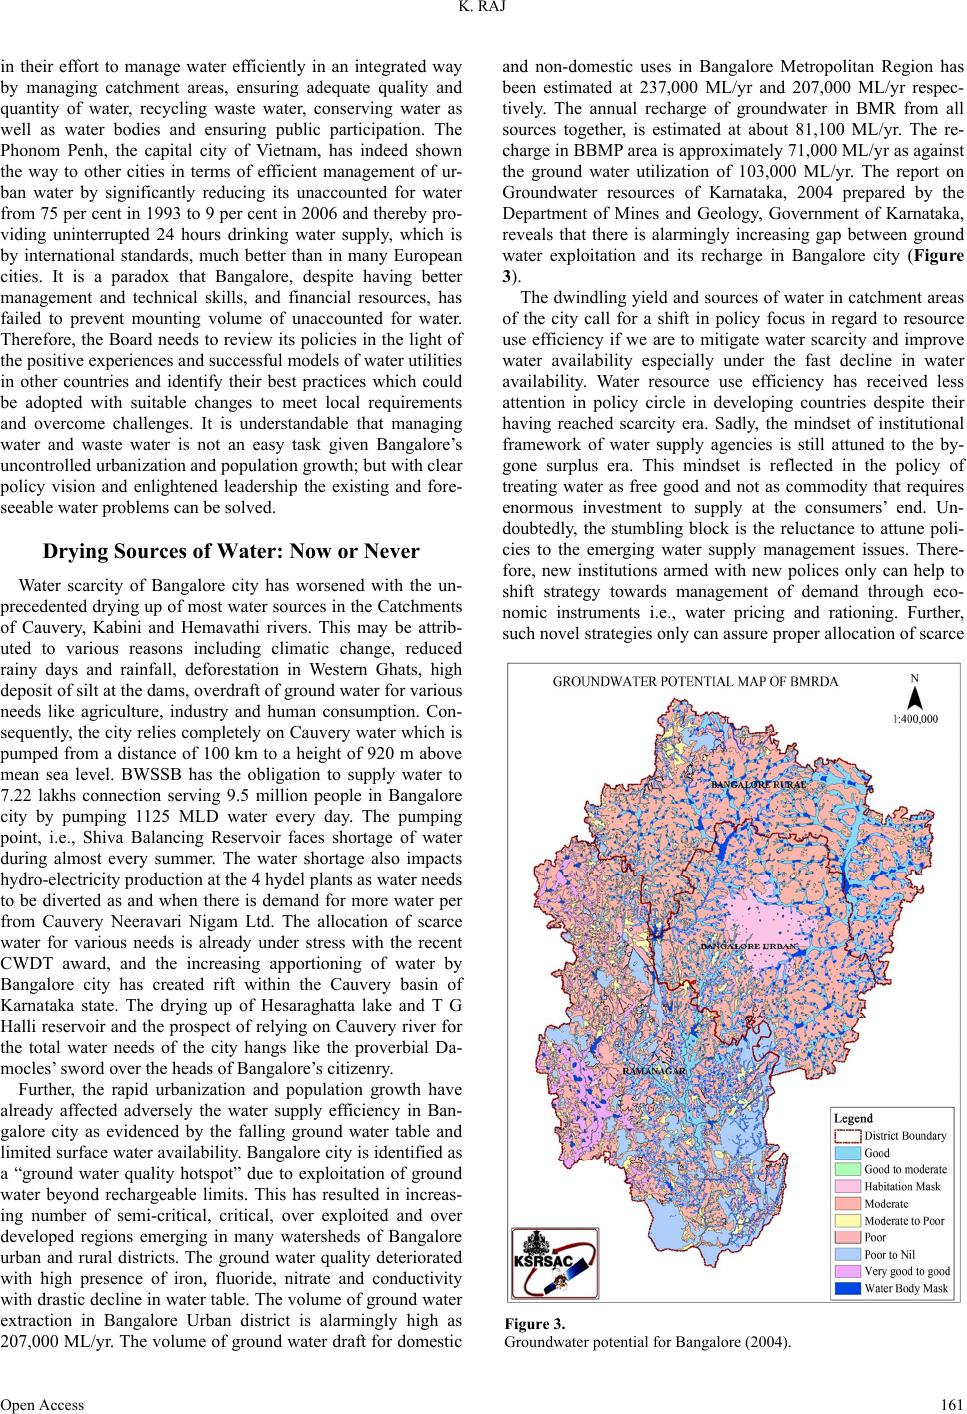 K. RAJ in their effort to manage water efficiently in an integrated way by managing catchment areas, ensuring adequate quality and quantity of water, recycling waste water, conserving water as well as water bodies and ensuring public participation. The Phonom Penh, the capital city of Vietnam, has indeed shown the way to other cities in terms of efficient management of ur- ban water by significantly reducing its unaccounted for water from 75 per cent in 1993 to 9 per cent in 2006 and thereby pro- viding uninterrupted 24 hours drinking water supply, which is by international standards, much better than in many European cities. It is a paradox that Bangalore, despite having better management and technical skills, and financial resources, has failed to prevent mounting volume of unaccounted for water. Therefore, the Board needs to review its policies in the light of the positive experiences and successful models of water utilities in other countries and identify their best practices which could be adopted with suitable changes to meet local requirements and overcome challenges. It is understandable that managing water and waste water is not an easy task given Bangalore’s uncontrolled urbanization and population growth; but with clear policy vision and enlightened leadership the existing and fore- seeable water problems can be solved. Drying Sources of Water: Now or Never Water scarcity of Bangalore city has worsened with the un- precedented drying up of most water sources in the Catchments of Cauvery, Kabini and Hemavathi rivers. This may be attrib- uted to various reasons including climatic change, reduced rainy days and rainfall, deforestation in Western Ghats, high deposit of silt at the dams, overdraft of ground water for various needs like agriculture, industry and human consumption. Con- sequently, the city relies completely on Cauvery water which is pumped from a distance of 100 km to a height of 920 m above mean sea level. BWSSB has the obligation to supply water to 7.22 lakhs connection serving 9.5 million people in Bangalore city by pumping 1125 MLD water every day. The pumping point, i.e., Shiva Balancing Reservoir faces shortage of water during almost every summer. The water shortage also impacts hydro-electricity production at the 4 hydel plants as water needs to be diverted as and when there is demand for more water per from Cauvery Neeravari Nigam Ltd. The allocation of scarce water for various needs is already under stress with the recent CWDT award, and the increasing apportioning of water by Bangalore city has created rift within the Cauvery basin of Karnataka state. The drying up of Hesaraghatta lake and T G Halli reservoir and the prospect of relying on Cauvery river for the total water needs of the city hangs like the proverbial Da- mocles’ sword over the heads of Bangalore’s citizenry. Further, the rapid urbanization and population growth have already affected adversely the water supply efficiency in Ban- galore city as evidenced by the falling ground water table and limited surface water availability. Bangalore city is identified as a “ground water quality hotspot” due to exploitation of ground water beyond rechargeable limits. This has resulted in increas- ing number of semi-critical, critical, over exploited and over developed regions emerging in many watersheds of Bangalore urban and rural districts. The ground water quality deteriorated with high presence of iron, fluoride, nitrate and conductivity with drastic decline in water table. The volume of ground water extraction in Bangalore Urban district is alarmingly high as 207,000 ML/yr. The volume of ground water draft for domestic and non-domestic uses in Bangalore Metropolitan Region has been estimated at 237,000 ML/yr and 207,000 ML/yr respec- tively. The annual recharge of groundwater in BMR from all sources together, is estimated at about 81,100 ML/yr. The re- charge in BBMP area is approximately 71,000 ML/yr as against the ground water utilization of 103,000 ML/yr. The report on Groundwater resources of Karnataka, 2004 prepared by the Department of Mines and Geology, Government of Karnataka, reveals that there is alarmingly increasing gap between ground water exploitation and its recharge in Bangalore city (Figure 3). The dwindling yield and sources of water in catchment areas of the city call for a shift in policy focus in regard to resource use efficiency if we are to mitigate water scarcity and improve water availability especially under the fast decline in water availability. Water resource use efficiency has received less attention in policy circle in developing countries despite their having reached scarcity era. Sadly, the mindset of institutional framework of water supply agencies is still attuned to the by- gone surplus era. This mindset is reflected in the policy of treating water as free good and not as commodity that requires enormous investment to supply at the consumers’ end. Un- doubtedly, the stumbling block is the reluctance to attune poli- cies to the emerging water supply management issues. There- fore, new institutions armed with new polices only can help to shift strategy towards management of demand through eco- nomic instruments i.e., water pricing and rationing. Further, such novel strategies only can assure proper allocation of scarce Figure 3. Groundwater potential for Bangalore (2004). Open Access 161  K. RAJ water among various economic needs by taking into account economic, social and environmental gains for the society. In this direction, it may be noted that many cities have already switched over to demand driven water management based on consumers’ choice and willingness to pay. This policy shift will help to attract investment on urban water infrastructure which would hopefully result in augmentation of water availability, improving the quality of water supplied and recycling of waste water. Economics of Urban Water Supply Finding solution to water scarcity and unreliable water sup- ply from the perspective of economic efficiency is very crucial for ensuring sustainable urban habitat. Proper valuation of mul- tiple benefits of water provides its actual utility construed as value-in-use, as asserted by Adam Smith (Batten, 2007). Zerah observes that many instances of water shortages stem from the widespread failure to value water’s true worth. Growing scar- city of drinking water in metropolitan cities is reflected in the increasing economic value of water resources (Zerah, 2000). However, urban water utilities have largely failed to factor in the importance of economic aspects of water supply in major policy frameworks. Demand for water is estimated based on projections and normative requirements of water for the grow- ing population, but the effect of price on the demand for water is seldom recognized. The quantity of water demanded is sig- nificantly affected by the price of water and other socio-eco- nomic factors. Demand for water is inversely related to its price, and positively to individual income; however, a certain mini- mum quantity of water will always be in demand regardless of price. Therefore, augmentation of water supply is given higher priority than demand management in the policy circles, and this leads to the emergence of “low-level-equilibrium-trap” (Reddy, 1999). Whenever the demand for water exceeds supply, urban water utilities quickly design water supply strategies, giving little importance to demand control or management. Failure of Water supply authorities to incorporate demand-side factors in their policies leads to “system-collapse” or “institutional fail- ure”. For instance, in Bangalore city, without first addressing the towering level of UFW (48 per cent), the BWSSB has tried to over-draw from already strained water sources at huge public investment without offering “economic justification” for taking up new water supply projects. But the demand-side manage- ment principles advocate operating within the limits of current supplies. Even today, supply augmentation strategies get prece- dence in urban water resource planning in developing countries over demand management opportunities, despite the fact that most developed countries have overturned its dominance in their water policies. Under these circumstances it is difficult to achieve economic efficiency in water utilization unless demand management options get priority over supply enhancement options. Even today, it is non-economic factors such as political considerations that get priority in urban water management decision-making over economic or market instruments; there is therefore, need to factor in both economic and welfare aspects of water supply in order to ensure the long term sustainability of scarce water resources. Presently, most developing countries lack the capacity/will to evolve proper market based instru- ments for ensuring allocation of water efficiently and equitably. Efficiency of public water supply system developing countries is often constrained by a combination of factors like financial stringency, poor maintenance system, etc., with the result the percentage of UFW goes up, which is often two to three times higher than that in developed countries. The cost of inefficiency in terms of unreliable water imposes high cost on the house- holds, forcing adoption of compensatory strategies. The cost of unreliable supply of water in Delhi has been estimated at Rs 3000 million annually, which works out to an average cost of Rs 2182 per household per year. The greater efficiency of wa- ter use is found positively associated with fixing of the price of water to in line with the real cost of supplying it. Better pricing —levying and collecting appropriate user charges—solves wa- ter scarcity by promoting allocation of this scarce resource more efficiently and equitably. Economic Efficiency and Institutional Capability Research studies in urban water management policy have clearly identified the reasons for inefficiency as the lack of recognition of water as a scarce or economic commodity, and the failure of market or pricing policies to account for the full economic costs of its production and supply. It is essential to include opportunity costs related to alternate uses of water, user costs, cost of externalities such as ground water depletion, pol- lution of water bodies etc. If cost recovery is based merely on water production and supply, it may lead to under pricing of water and result in inefficiency in operation and also inadequate investment on new projects and even in operation and mainte- nance. It is seen from experience that economic instruments such as higher water pricing or tariffs have remarkably reduced household water consumption levels and also promoted aware- ness about water conservation. Market signals the scarcity value and also opportunity cost of water, which helps in effi- cient allocation of water among various competing sectors. Realization of an ideal state of economic efficiency in urban water supply system is not likely in the near future, as already a number of cities of the world have been afflicted with water distress and mounting water production and supply costs as also political compulsions in this matter. Niemczynowicz observes that “Water-related problems in [the] cities are already enor- mous, and further degradation is expected. Water shortage is a growing problem and delivery of safe drinking water cannot be assured” (Niemczynowicz, 1996). However, improvement in economic efficiency depends on short-term and long-term in- stitutional capability to address the main water supply indica- tors such as reliability, financial sustainability, environmental sustainability and affordability. Economic efficiency should also reflect the goal of supplying clean and quality of water for 24 hours by providing universal access to water for all. Im- provement of economic efficiency depends on evolving an effective water pricing mechanism taking into account the eco- nomic status and ability of households to pay. Economic status influences the peoples’ willingness to pay for improvement in access and quality of water supply. Policy of water pricing, therefore, needs to achieve two objectives simultaneously: re- covery of the full cost of production from supply of water, and provision of efficient and reliable water supply service to the consumers. Without any provision for better water supply ser- vices, mere increase in water tariffs are doomed to fail in this objective as established by many research studies. Open Access 162 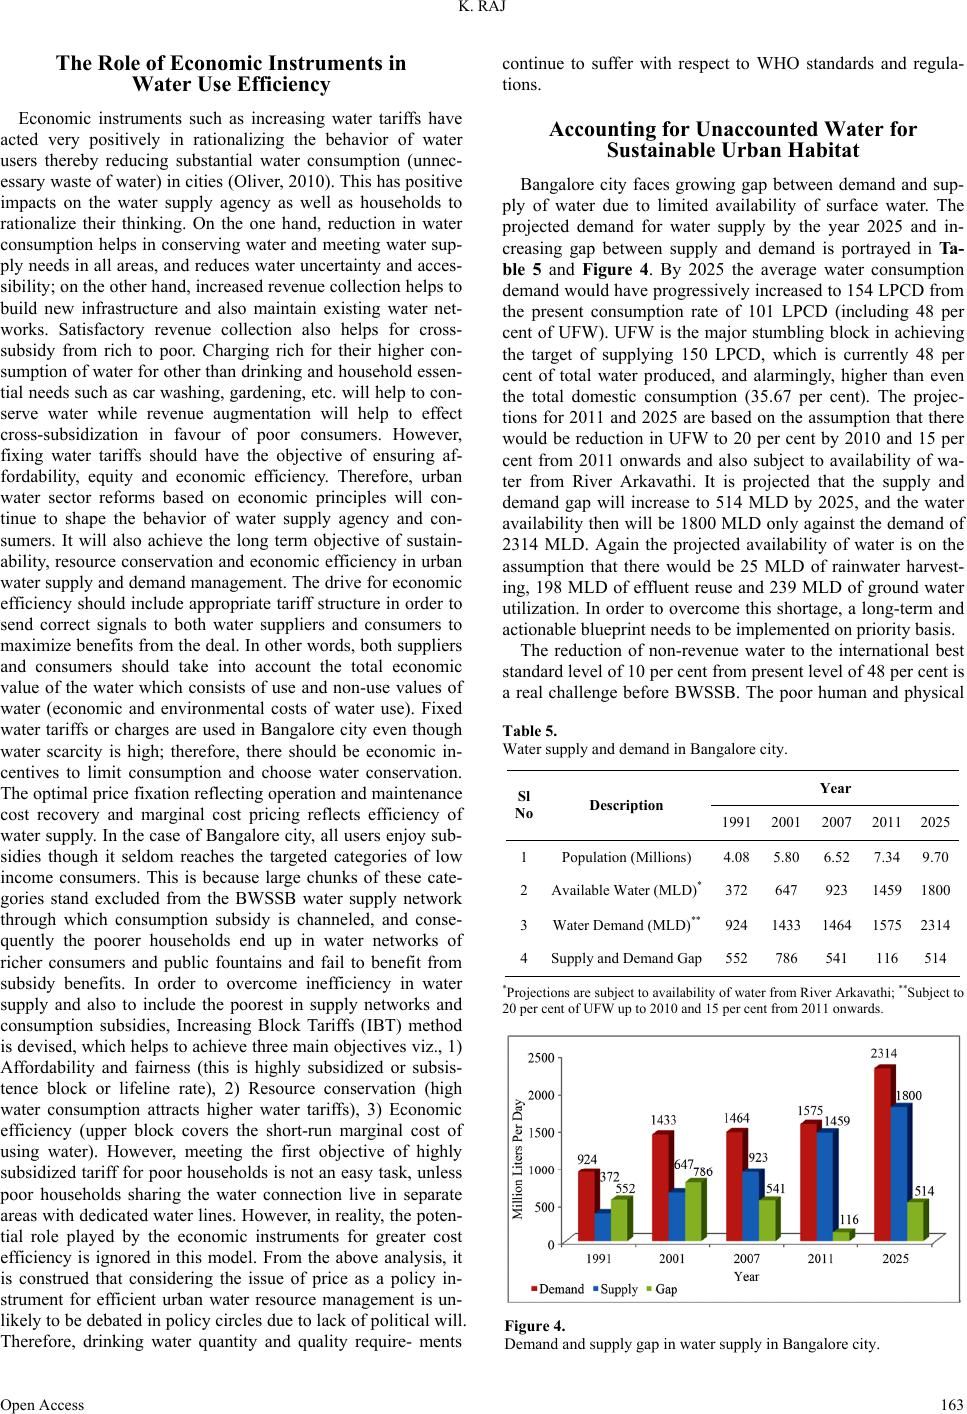 K. RAJ The Role of Economic Instruments in Water Use Efficiency Economic instruments such as increasing water tariffs have acted very positively in rationalizing the behavior of water users thereby reducing substantial water consumption (unnec- essary waste of water) in cities (Oliver, 2010). This has positive impacts on the water supply agency as well as households to rationalize their thinking. On the one hand, reduction in water consumption helps in conserving water and meeting water sup- ply needs in all areas, and reduces water uncertainty and acces- sibility; on the other hand, increased revenue collection helps to build new infrastructure and also maintain existing water net- works. Satisfactory revenue collection also helps for cross- subsidy from rich to poor. Charging rich for their higher con- sumption of water for other than drinking and household essen- tial needs such as car washing, gardening, etc. will help to con- serve water while revenue augmentation will help to effect cross-subsidization in favour of poor consumers. However, fixing water tariffs should have the objective of ensuring af- fordability, equity and economic efficiency. Therefore, urban water sector reforms based on economic principles will con- tinue to shape the behavior of water supply agency and con- sumers. It will also achieve the long term objective of sustain- ability, resource conservation and economic efficiency in urban water supply and demand management. The drive for economic efficiency should include appropriate tariff structure in order to send correct signals to both water suppliers and consumers to maximize benefits from the deal. In other words, both suppliers and consumers should take into account the total economic value of the water which consists of use and non-use values of water (economic and environmental costs of water use). Fixed water tariffs or charges are used in Bangalore city even though water scarcity is high; therefore, there should be economic in- centives to limit consumption and choose water conservation. The optimal price fixation reflecting operation and maintenance cost recovery and marginal cost pricing reflects efficiency of water supply. In the case of Bangalore city, all users enjoy sub- sidies though it seldom reaches the targeted categories of low income consumers. This is because large chunks of these cate- gories stand excluded from the BWSSB water supply network through which consumption subsidy is channeled, and conse- quently the poorer households end up in water networks of richer consumers and public fountains and fail to benefit from subsidy benefits. In order to overcome inefficiency in water supply and also to include the poorest in supply networks and consumption subsidies, Increasing Block Tariffs (IBT) method is devised, which helps to achieve three main objectives viz., 1) Affordability and fairness (this is highly subsidized or subsis- tence block or lifeline rate), 2) Resource conservation (high water consumption attracts higher water tariffs), 3) Economic efficiency (upper block covers the short-run marginal cost of using water). However, meeting the first objective of highly subsidized tariff for poor households is not an easy task, unless poor households sharing the water connection live in separate areas with dedicated water lines. However, in reality, the poten- tial role played by the economic instruments for greater cost efficiency is ignored in this model. From the above analysis, it is construed that considering the issue of price as a policy in- strument for efficient urban water resource management is un- likely to be debated in policy circles due to lack of political will. Therefore, drinking water quantity and quality require- ments continue to suffer with respect to WHO standards and regula- tions. Accounting for Unaccounted Water for Sustainable Urban Habitat Bangalore city faces growing gap between demand and sup- ply of water due to limited availability of surface water. The projected demand for water supply by the year 2025 and in- creasing gap between supply and demand is portrayed in Ta- ble 5 and Figure 4. By 2025 the average water consumption demand would have progressively increased to 154 LPCD from the present consumption rate of 101 LPCD (including 48 per cent of UFW). UFW is the major stumbling block in achieving the target of supplying 150 LPCD, which is currently 48 per cent of total water produced, and alarmingly, higher than even the total domestic consumption (35.67 per cent). The projec- tions for 2011 and 2025 are based on the assumption that there would be reduction in UFW to 20 per cent by 2010 and 15 per cent from 2011 onwards and also subject to availability of wa- ter from River Arkavathi. It is projected that the supply and demand gap will increase to 514 MLD by 2025, and the water availability then will be 1800 MLD only against the demand of 2314 MLD. Again the projected availability of water is on the assumption that there would be 25 MLD of rainwater harvest- ing, 198 MLD of effluent reuse and 239 MLD of ground water utilization. In order to overcome this shortage, a long-term and actionable blueprint needs to be implemented on priority basis. The reduction of non-revenue water to the international best standard level of 10 per cent from present level of 48 per cent is a real challenge before BWSSB. The poor human and physical Table 5. Water supply and demand in Bangalore city. Year Sl No Description 1991 2001 2007 20112025 1Population (Millions) 4.08 5.80 6.52 7.349.70 2Available Water (MLD)*372 647 923 14591800 3Water Demand (MLD)** 924 1433 1464 15752314 4Supply and Demand Gap552 786 541 116514 *Projections are subject to availability of water from River Arkavathi; **Subject to 20 per cent of UFW up to 2010 and 15 per cent from 2011 onwards. Figure 4. Demand and supply gap in water supply in Bangalore city. Open Access 163  K. RAJ infrastructure has hindered the work of water leak detection, replacing corroded and old pipes and installing water meters. The deteriorating financial performance of BWSSB, therefore, continues to impact the efficiency of water supply on account of rising unaccounted for water, non-revenue water, increased electricity charges and high operation and maintenance cost. The mounting fiscal crisis has made BWSSB to heavily depend on state government for meeting O & M costs without consid- ering ways and means of improving cost recovery and the per- formance of water supply system. Therefore, the water utility in the city is unlikely to improve if effective steps are not taken to cap UFW in water distribution system, especially heavy seep- age due to corrosion of main pipes, eliminate thefts and over- flows, improper metering, and illegal connections. Demand- side management of urban water supply, including metering of public fountains, necessarily requires reduction of UFW from the existing level of 48 per cent. Scientific assessment of water leakages, whether due to real loss or apparent loss, has to be prioritized by the BWSSB. Real loss of water is mainly due to technical snags, i.e. unscientific recording of total water sup- plied on account of leakages, theft and overflow prior to reach- ing end users. Apparent losses are those stems from improper recording of total water utilized by the consumers owing to faulty meter reading and administrative inefficiency. It can be inferred from the water leakages estimation that real loss of water is indeed higher than the apparent loss. Extensive re- placement of corrosive pipes is required to reduce UFW in Bangalore city. The high UFW is mainly due to two types of distributional losses: first, distributional loss due to damages and leakages in water supply system and, second, unauthorized water connections which are not billed at all. The growing scar- city of water sources and increasing cost of production (water treatment) and distribution essentially calls for treating water as of economic good, rather than just a renewable resource. Water should be essentially treated as “economic good” or an “eco- nomic and social good” to emphasize the urgent need for its rational use by human beings. Further, instead of defining water as a “renewable resource”, water should be redefined and re- classified as “conditionally renewable resources” as water re- charge or natural replenishment has been much below the ex- ploited quantity in recent years. Water conservation is the im- mediate need for improving ground water table to ensure avail- ability of water for productive use. Augmentation can be by means of storage of water in surface bodies such as lakes, res- ervoirs, tanks, ponds and wells and ground water bodies such as soil. Government should also prioritize rejuvenation of de- graded traditional surface water bodies such as lakes and ponds in Bangalore urban and rural districts. Good efforts towards water conservation inevitably demand some sort of economic incentives in the form of payment and rewards for the restora- tion of water ecosystems. Therefore, devising promotional eco- nomic instruments like subsidies, payments or compensations are the need of the hour. Rainwater or roof water harvesting is considered to be the best alternative and cost-effective option, but this has to be implemented strictly by making new laws with adequate economic incentives. Enhancing wastewater treatment capacity can reduce the quantum on fresh water re- quirement in the future. Judicious and economic use of both tap and ground water has to be encouraged by imparting awareness about growing concerns in respect of fresh water scarcity. Pre- vention of contamination of water bodies from industrial and domestic pollutants at point source and non-point source needs to be given priority in the policy. Strategies for Improving Economic Efficiency BWSSB, after realizing its failure to reduce UFW and non- revenue water, is planning to bring appropriate institutional reforms in water supply. Its major priorities and challenges are to achieve economic self-sufficiency by effectively reducing/ eliminating subsidized supply of water on the lines of other market based institutions. BWSSB also needs to educate the masses about the urgency inevitability and economic justifica- tion of increasing water tariffs. It also needs to switchover to efficient management practices such as computerizing water supply, achieving 100 per cent metering, charging appropriate user charges, overcoming NRW through reduction in UFW and water losses. There is also a need for a long-term plan of aug- ment water availability from present 75 LPCD to 150 LPCD, apart from extending coverage to all sections of the society for 24/7, by 2011-2012. BWSSB has given the highest priority to plugging water leakages in the distribution system, the volume which is currently equivalent to 7-day’s water supply, and im- proves revenue collection by 20 to 30 per cent. The cost in- volving of Rs 4000 million is being met with financial assis- tance the Japan International Cooperation Agency (JICA). The Government of Karnataka has shown its interest in reducing water scarcity through its Agenda for Bangalore Infrastructure Development, 2008. What is envisaged is to address the water shortage of 349 MLD or 40 per cent of drinking water needs of the city, by harvesting water from lakes in and around the city. The state government has also come up with a major plan cost- ing Rs 1700 million to replace all old and corroded water pipe- lines and install dual pipelines in new layouts of the city within two years. However, adequate attention has not been given to wastewater treatment. Bangalore city generates about 1000 MLD of waste-water of which just about 721 MLD is treated, and the rest goes without any economic use. Only 70 MLD of waste water under tertiary treatment is currently used by the Bangalore International Airport, Bharath Electronics Limited, Rail Wheel Factory, and other industries for non-potable pur- pose. Enhancement of tertiary treatment capacity to achieve at least 10 per cent of reuse of treated wastewater will reduce the current heavy dependence on surface and ground water. Ban- galore city receives uninterrupted and well-distributed rainfall with an average rainfall of 970 mms annually. Rainwater har- vesting involves low capital and transaction costs; besides it helps to reduce water stress of the city by over 20% in the fu- ture. Therefore, an integrated water resource management ap- proach, combining water supply augmentation and demand management strategies is certain to improve economic effi- ciency of the city’s water supply system (Table 6). Poor governance and political interference have generally acted against induction of knowledge, experience and technol- ogy in water management in the city. The governance structure needs urgent reforms to bring about greater accountability and coordination as also to effect devolution of powers to user groups on the basis of economic rewards. There is also an ur- gent need to bring about cohesive coordination among political, social, economic, educational and environmental institutions in order to achieve common objectives in water sector. Incentives need to be evolved on the basis of market based instruments for brining improvements in environmental governance i.e. effec- tive management of water resources. BWSSB can adopt several Open Access 164 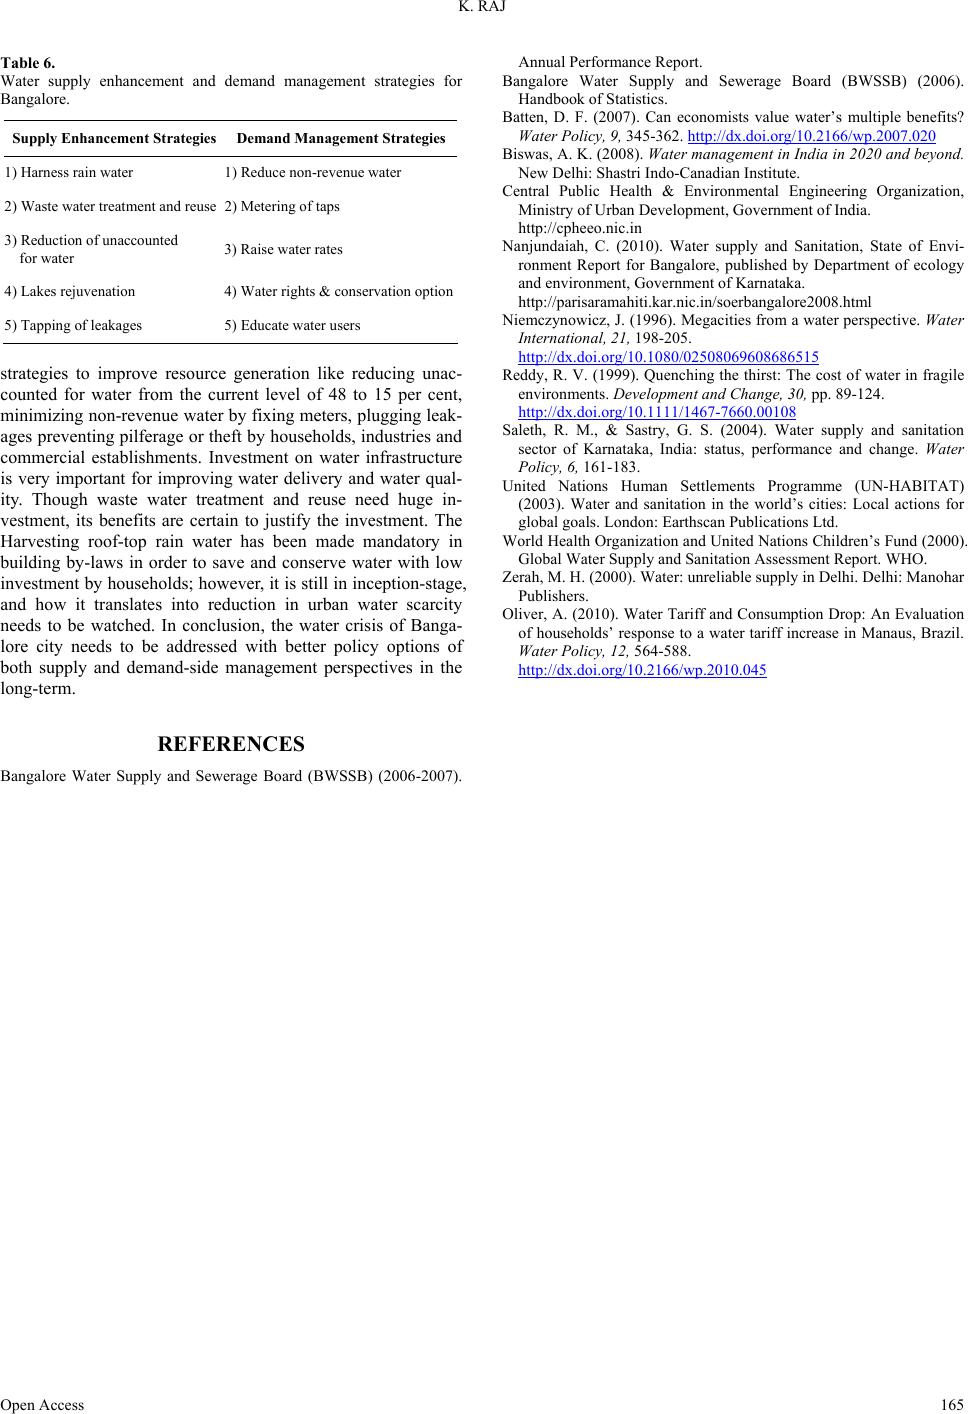 K. RAJ Open Access 165 Table 6. Water supply enhancement and demand management strategies for Bangalore. Supply Enhancement St rategies Demand Management Strategies 1) Harness rain water 1) Reduce non-revenue water 2) Waste water treatment and reuse 2) Metering of taps 3) Reduction of unaccounted for water 3) Raise water rates 4) Lakes rejuvenation 4) Water rights & conservation option 5) Tapping of leakages 5) Educate water users strategies to improve resource generation like reducing unac- counted for water from the current level of 48 to 15 per cent, minimizing non-revenue water by fixing meters, plugging leak- ages preventing pilferage or theft by households, industries and commercial establishments. Investment on water infrastructure is very important for improving water delivery and water qual- ity. Though waste water treatment and reuse need huge in- vestment, its benefits are certain to justify the investment. The Harvesting roof-top rain water has been made mandatory in building by-laws in order to save and conserve water with low investment by households; however, it is still in inception-stage, and how it translates into reduction in urban water scarcity needs to be watched. In conclusion, the water crisis of Banga- lore city needs to be addressed with better policy options of both supply and demand-side management perspectives in the long-term. REFERENCES Bangalore Water Supply and Sewerage Board (BWSSB) (2006-2007). Annual Performance Report. Bangalore Water Supply and Sewerage Board (BWSSB) (2006). Handbook of Statistics. Batten, D. F. (2007). Can economists value water’s multiple benefits? Water Policy, 9, 345-362. http://dx.doi.org/10.2166/wp.2007.020 Biswas, A. K. (2008). Water management in India in 2020 and beyond. New Delhi: Shastri Indo-Canadian Institute. Central Public Health & Environmental Engineering Organization, Ministry of Urban Development, Government of India. http://cpheeo.nic.in Nanjundaiah, C. (2010). Water supply and Sanitation, State of Envi- ronment Report for Bangalore, published by Department of ecology and environment, Government of Karnataka. http://parisaramahiti.kar.nic.in/soerbangalore2008.html Niemczynowicz, J. (1996). Megacities from a water perspective. Water International, 21, 198-205. http://dx.doi.org/10.1080/02508069608686515 Reddy, R. V. (1999). Quenching the thirst: The cost of water in fragile environments. Development and Change, 30, pp. 89-124. http://dx.doi.org/10.1111/1467-7660.00108 Saleth, R. M., & Sastry, G. S. (2004). Water supply and sanitation sector of Karnataka, India: status, performance and change. Water Policy, 6, 161-183. United Nations Human Settlements Programme (UN-HABITAT) (2003). Water and sanitation in the world’s cities: Local actions for global goals. London: Earthscan Publications Ltd. World Health Organization and United Nations Children’s Fund (2000). Global Water Supply and Sanitation Assessment Report. WHO. Zerah, M. H. (2000). Water: unreliable supply in Delhi. Delhi: Manohar Publishers. Oliver, A. (2010). Water Tariff and Consumption Drop: An Evaluation of households’ response to a water tariff increase in Manaus, Brazil. Water Policy, 12, 564-588. http://dx.doi.org/10.2166/wp.2010.045
|