 Low Carbon Economy, 2013, 4, 137-145 Published Online December 2013 (http://www.scirp.org/journal/lce) http://dx.doi.org/10.4236/lce.2013.44015 Open Access LCE 137 Allocation of Emission Allowances within the European Union Emissions Trading Scheme to the Waste Sector Nina Braschel, Alfred Posch, Vera Pusterhofer Institute of Systems Sciences, Innovation and Sustainability Research, University of Graz, Graz, Austria. Email: nina.braschel@uni-graz.at Received July 12th, 2013; revised August 10th, 2013; accepted August 18th, 2013 Copyright © 2013 Nina Braschel et al. This is an open access article distributed under the Creative Commons Attribution License, which permits unrestricted use, distribution, and reproduction in any medium, provided the original work is properly cited. ABSTRACT The present study develops an approach explicitly to cover the waste sector under the Emissions Trading Scheme of the European Union (EU ETS). The objective is to analyze various allocation possibilities and the resulting monetary bur- dens for the waste sector. Three different allocation variants for allocating emission allowances and their financial bur- den to the waste sector are developed. These variants support implementation within the EU ETS in the third trading period from 2013 to 2020. The respective distributions of emission allowances to the Austrian waste sector are esti- mated for each variant calculated. Allowances vary depending on specific industry, the relative share of free and pur- chased allowances, and the relative costs entailed in additional purchase. Although the present paper focuses exp licitly on the Austrian waste sector, in principle, the calculation procedure is applicable to waste sectors in other developed countries as well. Keywords: Allocation of Emission Allowances; Distribution of Free/Purchased Allowances; European Union Emissions Trading Scheme; Financial Burden; Waste Sector 1. Introduction As part of the Kyoto agreement in 1997, the European Union (EU) committed itself to reducing by 2012 climate effective emissions by 8 percent below the 1990 emis- sions level. The Kyoto protocol defined three flexible mechanisms for reaching the reduction targets: Joint Im- plementation (JI), the Clean Development Mechanism (CDM) and Emission Trading (ET) [1-5]. When using the trading of emission allowances as a climate-policy instrument, a limit or cap is set for the total amount of emissions allowed. This emissions limit can then be reached by countries trading emission al- lowances in a cost-effective and economically efficient manner [1-7]. The basic idea is that one emission allow- ance is needed for every ton of GHG emissions pro- duced. The Emissions Trading Scheme of the EU (hereafter EU ETS) covered the sectors energy and industry in its first (2005-2 007) and second (2008- 2012) trading period , but not the waste sector. While a few studies show how the waste sector can contribute to climate protection, and how the actors of the waste sector can generate economic profits, mainly by participating in one of the two project- based flexible mechanisms JI and CDM (see, e.g., [8]), no existing study has yet described precisely how, and under which circumstances, inclusion of the waste sector in the EU ETS might be possible and what the conse- quences might be. The present study takes the economic model lying behind the emission allowance allocation and develops three allocation variants in order to reflect the different allocation possibilities available for the waste sector (it is assumed here that the waste sector will actually be included in the third EU ETS trading period (2013-2020)). The objective is to analyze different allocation possi- bilities and their respective monetary burdens so as to assess the potential financial impact of an inclusion of the Austrian waste sector. While the data used and outcomes calculated are based specifically on the Austrian waste sector, the concept can be applied generally to assess the impact of waste sector inclusion in other similar countries. The paper is divided into four further sections. Section 2, provides basic information on the EU ETS. Section 3, offers a suitable definition for th e term “waste sector”. In Section 4, the basic economic model is described. This  Allocation of Emission Allowances within the European Union Emissions Trading Scheme to the Waste Sector 138 section also contains explanations of related allocation rules and variables, of parameters and assumptions, and of the three allocation variants calculated. In addition, data from the Austrian waste sector are applied to the model in order to calculate different allocation possibili- ties. The potential impact of waste sector inclusion on emission allowance quantities and related fund ing is thus made visible. The results for the different allocation pos- sibilities and their respective financial burdens are re- vealed in Section 5. The last section, Section 6, discu sses the limitations of the approach and some conclusions are drawn for future research. 2. The European Union Emissions Trading Scheme The EU ETS is the world’s biggest cap-and-trade system. By enabling emission allowance trading among the 27 EU member states, plus Iceland, Liechtenstein and Nor- way, it has created an economically cost-efficient means for reaching Kyoto emission targets. To date, at the end of the second trading period, the regulation system cov- ers industrial sectors of energy conversion and energy transformation, iron and steel production and processing, the mineral industry (cement, lime, glass, ceramics, brick) and other industrial branches (pulp, paper, board), the sectors nitric acid, petrochemicals, ammonia and alu- minium, as well as the aviation sector., The emissions regulated by the EU ETS include CO2 and N2O from the production of nitric, adipic and glyoxylic acids, as well as PFCs from the aluminium sector [2,9-11]. The EU ETS was first launched in 2005 and has since been divided into three trading periods. The first pilot phase was from 2005 to 2007. The data gained during this testing period was used as a basis for the second, trading phase, which began in 2008, and which is due to end in 2012. The third implementation phase will span the years 2013 to 2020. The basic principle of the EU ETS is that every opera- tor of an industrial installatio n subject to EU ETS regula- tion is required to have a permit for every ton of CO2 emissions emitted. Some energy-intensive industries whose competitiveness was judged to be at risk and who are therefore potentially prone to carbon leakage may be exempted [7,12-15]. The initial allocation of the emission allowances in the first two phases is covered in national allocation plans (hereafter NAPs). For these two periods the EU member states set their own individual caps on emissions allow- ances. In addition to sectoral and branch allocations the respective NAPs also determine allocations at the plant level. Every member state NAP has to be confirmed by the European Commission [2,10,11,16]. The vast majority of all allowances distributed during the first and second trading periods were given out free of charge. As various problems arose with this approach, it was decided that from 2013 onwards auctioning would form the basis for allocating allowances. A progressive transition to auctioning is planned, starting with a 20 percent share of allowances distributed in 2013, and reaching full auctioning in 2027 [4,5,13-15,17]. 3. Definition of the Term “Austrian Waste Sector” No matter how often the topic “waste” is studied, defin- ing the term “waste management”, “was te sector” or “wa- ste industry” seems to become more, rather than less, problematic. Obviously, before any meaningful discussion con- cerning an incorporation of the waste sector into the EU ETS can take place at all, a clear definition of what is meant by the term is needed, e.g. which areas are to be included and which excluded [18]. The objective in the present paper is to calculate the different possibilities concerning inclusion of the Aus- trian waste sector in the EU ETS. For this purpose, the standard definition was considered adequate and was adopted here. This definition covers four basic divisions [1,19-22]: 1) Solid waste disposal on land/landfills; 2) Wastewater treatment; 3) Waste incineration; 4) Other waste treatment (composting, mechanical- biological treatment). The decision to adopt the standard definition was based on the following: 1) To date, the EU ETS only includes carbon dioxide emissions (CO2). Two exceptions are Austria and the Netherlands where nitrous oxide emissions (N2O), caused by the production of nitric acid (HNO3), are now considered in the second trading period (2008-2012). Within the above four divisions only waste incineration facilities cause CO2 emissions. However, for the present study methane (CH4) and N2O also need to be consid- ered. 2) The position of the European Parliament (EP) on the improvement and extension of the trading scheme says that “…the Community scheme should be extended to other installations […] which are capable of being monitored, reported and verified with the same level of accuracy as that which applies under the monitoring, reporting and verification requirements currently appli- cable.” [23] Although the EP is pushing to extend the scheme to other installations, it is debatable whether in- stallations of the waste sector can fulfil the necessary requirements [24]. 3) The term “waste incineration facilities” covers in- Open Access LCE  Allocation of Emission Allowances within the European Union Emissions Trading Scheme to the Waste Sector Open Access LCE 139 cineration plants for municipal waste and other thermal waste treatment facilities. These facilities lead to CO2, but are only respon sible for a small par t of all g reenh ou se gas (hereafter GHG) emissions in the waste sector [21, 22,25]. Moreover, incineration plants with energy recov- ery and co-combustion plants are classed as belonging to the sectors energy and industry and are therefore already included in the EU ETS. This results in a (seemingly) relatively low level of emitted carbon within the waste sector. For purposes of the present study, the fact that the European Union Emissions Trading Scheme mainly ad- dresses carbon dioxide emissions is reason enough to include this subsector in the definition of the Austrian waste industry. European ETS. 4. Method This section provides a basic description of the economic model employed and includes explanations of the respec- tive allocation rules, parameters and assumptions used in calculating the three cases. The relationship between allocation type (i.e. Variant 1, 2 or 3) and expected fi- nancial burden upon inclusion of the waste sector, is also given. 4.1. Economic Model for Allocating Emission Allowances 4) With regard to climate effective gases, CH4 com- prises the majority of all GHG emissions in the waste sector (80% in Austria in 2010). The main driver of CH4 emissions is solid waste disposal on land (with a share of 75% in Austria in 2010) [21]. Various council directives and amendments governing landfill, e.g. 1999/31/EC, regulation No. 1882/2003 and No. 1137/2008, and the EU Waste Framework Directive 2006/12/EC. The dis- posal restriction of waste containing more than five per- cent organic carbon (in terms of mass) was the most im- portant measurement to reduce CH4 from landfills [26, 27]. Different kinds of allocation mechanisms are described in the literature. The three most common are: 1) Grandfathering: this uses historical data on emis- sions as a basis for the future allocation of emission al- lowances [13,16,28]. 2) Benchmarking: here, the best available technique is used as the basis for emission allowance allocation [13,14, 28]. 3) Auctioning: under this procedure, instead of direct allocation, emission permits are auctioned according to demand [13,14]. In the first and second trading period of the EU, ETS emission allowances were distributed based on the grandfathering mechanism and subsequently on coun- try-specific, independently d etermined NAPs [2,4,16,29 ]. In drawing up the initial NAP each country used the his- torical CO2 emission data for the installations covered by the EU ETS as a basis for calculation. Directive 2003/ 87/EC defines the relevant criteria for establishing NAPs. These are valid for all member states and are listed in Annex III of the directive. Unfortunately, allocation methods across countries still vary considerably, making uniform emission comparison difficult [29]. 5) Although recent restrictions on waste disposal are rigorous, the waste deposited in earlier periods is still there and still causing GHG emissions. However, so far, CH4 emissions are still not considered in the EU ETS, nor is there any direct evidence that they might be in- cluded in the near future [12,23]. Nevertheless, this sub- sector could not be taken out of account at all and has therefore be considered in the present calculation. 6) While N2O emissions mainly arise from wastewater treatment, they also occur in waste treatment facilities such as composting plants. Hence, the present definition includes both wastewater treatment and composting fa- cilities. To aid understanding, the distribution methods used in Austria are now stated below. The type of distribution is first stated in terms of a standard equation, and is then followed by a textual description (see [30,31]). Since most of the parameters are used in more than one equa- tion, a more detailed description of all individual pa- rameters is also presented in a more comprehensible form subsequent to the economic model in the next sec- tion, Section 4.2. The allocation variants calculated here are based on theoretical assumptions. The intentio n is simply to gain a better understanding of the future possibilities with re- spect to the interface between the EU ETS and the waste sector. Nonetheless, inclusion of the waste sector in the EU ETS is a clear legal option. This is stated in th e orig- inal directive 2003/87/EC and also in revised form in 2009/29/EC. Article 24 points out that subject to com- mission agreement, and assuming specific criteria are met, various activities and installations can be incorpo- rated into the regulatory system at the national lev el. The alternative would be a reconfiguration of the whole When beginning a new trading period within the EU ETS, an overall greenhouse gas emissions level, i.e. a cap for the allowances to be distributed, first needs to be de- fined. Equation (1): Defini ng the total quant ity (emissi ons cap) 00 sector TotalQuantityEmission Forecast1ClimateProtec tionContribution ttn ttn (1)  Allocation of Emission Allowances within the European Union Emissions Trading Scheme to the Waste Sector 140 The total quantity of emission allowances allocated to a country is obtained by taking the total from the emis- sion forecast for the period (in the present study the pe- riod 2013-2020), and then subtracting the sum of all mandatory climate protection contribution factors for the period for all sectors included. Equation (2): Defining sectoral emission allowances (see Equation (2)). The quantity of emission allowances allocated to one sector is given by finding the total of business-as-usual forecasts for all industries (sub-sectors) in the sector, in the present case all four industries of the waste sector, and then subtracting the product of the climate protection contribution for the respective sector, multiplied by the relevant reserve factor (this was taken to be 1 percent in the present study). Equation (3): Defining amount of free allocation for the sector sector sector sector Free AllocationAllocation 1Auctioning Share (3) To define the amount of emission allowances distrib- uted free of charge to a specific sector, the auctioning share per sector, in the present case a constant share of 20 percent, has to be deducted from the total quantity of emission allowances allocated to the respective sector. Equation (4): Defining amount of free allocation for a specific industry (see Equation (4)) The quantity of emission allowances allocated free of charge at the industry lev el is obtained by multiplying the allocation base of the respective industry by the growth factor of the industry’s emissions, by the potential factor of the industry, and by the respective compliance factor (this is the same for all industries within a single sector). Equation (5): Defining growth factors for industry emissions industry industry industry BusinessAs Usual Growth FactorAllocation Base (5) The growth factor for an industry captures the ex- pected development in the industry’s greenhouse gas emissions. The business-as-usual forecasts are used as a basis for determining the expected future growth rate of the industry’s emissions. 4.2. Parameters and Assumptions As far as the present analysis is concerned, the model focus is placed on the sectoral and industry level. Each allocation variant determines the number of emission allowances distributed to the respective sector and its industries. In the following calculations, apart from the level of the climate protection contribution, all variables are kept constant. The crucial difference in the three al- location variants is therefore the assumption about the level of the climate pro tection contribution factor. Based on data from the Environment Agency Austria the average expected GHG emissions up to 2020, as well as an emission projection for the third trading period, are calculated and presented in Table 1. This is the basis for all three allocation variants calculated. The allocation base and the growth factor for each industry are also given in this table. The parameters and assumptions used are now described below. 1) Allocation base: The allocation base, in the present case of an industry, reflects an industry’s average emis- sions level within the previous trading period or within that of another stated period. In the present study the emission levels of 2008 and 2009 were extrapolated to obtain values for the period 2008 till 2012, which was then used as the allocation base (see Table 1). 2) Auctioning share: Within the EU ETS 20 percent of allowances are to be made available via auctioning in 2013, so this share was also adopted for the present study [12]. An auctioning share of 20 percent means that 80 percent of the potential allo cation of emission allowances in the Austrian waste sector are handed out for free and 20 percent have to be purchased via auctioning at the beginning of the trading period. 3) Business-as-usual forecast: Business-as-usual fore- casts calculate an industry’s future GHG emissions level, assuming that certain factors remain constant. Historical trends for production volumes or energy intensities are extrapolated into the future in order to establish an in- dustry’s potential demand for emission allowances. The sum of business-as-usual forecasts for those industries belonging to the respective sector leads to the expected amount of GHG emissions at the sectoral level (see Ta- ble 2). 4) Climate protection contribution factor: The climate protection contribution is the amount by which GHG emissions need to be reduced within a respective trading period. This factor has a huge influence on the distribu- tion of emission allowances and reflects the difference between the amount of GHG emissions in a business-as- usual scenario and the set target-value for a certain year. sectorindustrysector sector AllocationBusiness As Usual1Climate Protection Contribution1ReserveFactor (2) industry industryindustry industrysector Free AllocationAllocationBaseGrowthFactorPotential FactorCompliance Factor (4) Open Access LCE 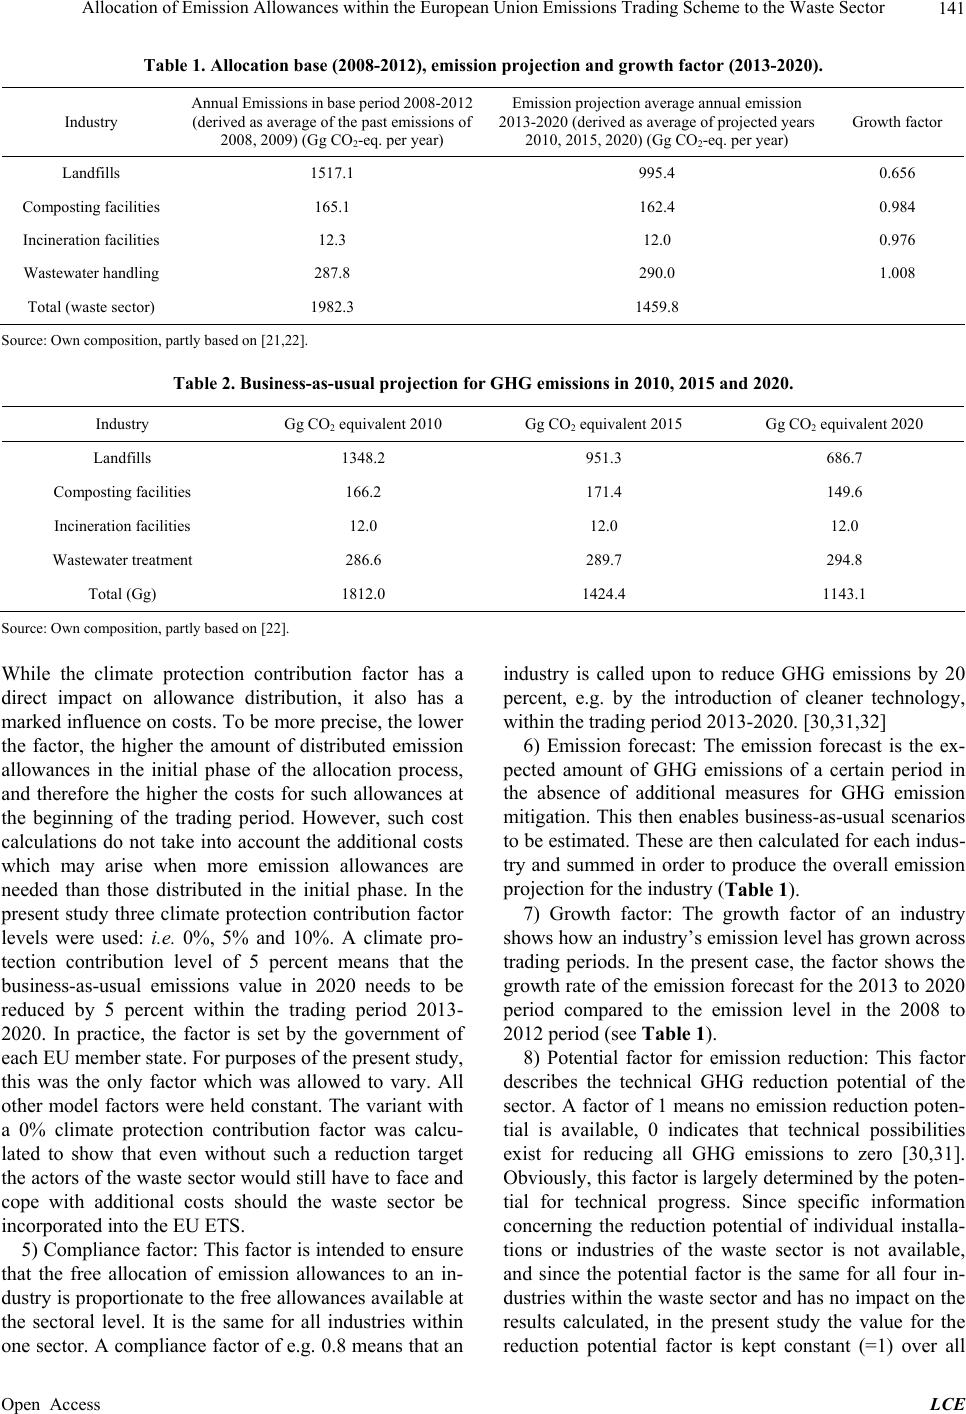 Allocation of Emission Allowances within the European Union Emissions Trading Scheme to the Waste Sector 141 Table 1. Allocation base (2008-2012), emission projection and growth factor (2013-2020). Industry Annu al Em iss ion s i n bas e pe ri od 2 00 8-2 012 (derived as average of the past emissions of 2008, 2009) (Gg CO2-eq. per year) Emission projection average annual emission 2013-2020 (derived as average of projected years 2010, 2015, 2020) (Gg CO2-eq. per year) Growth factor Landfills 1517.1 995.4 0.656 Composting facilities 165.1 162.4 0.984 Incineration facilities 12.3 12.0 0.976 Wastewater handling 287.8 290.0 1.008 Total (waste sector) 1982.3 1459.8 Source: Own composition, partly based on [21,22]. Table 2. Business-as-usual projection for GHG emissions in 2010, 2015 and 2020. Industry Gg CO2 equivalent 2010 Gg CO2 equivalent 2015 Gg CO2 equivalent 2020 Landfills 1348.2 951.3 686.7 Composting facilities 166.2 171.4 149.6 Incineration facilities 12.0 12.0 12.0 Wastewater treatment 286.6 289.7 294.8 Total (Gg) 1812.0 1424.4 1143.1 Source: Own composition, partly based on [22]. While the climate protection contribution factor has a direct impact on allowance distribution, it also has a marked influence on costs. To be more precise, the lower the factor, the higher the amount of distributed emission allowances in the initial phase of the allocation process, and therefore the higher the costs for such allowances at the beginning of the trading period. However, such cost calculations do not take into account the additional costs which may arise when more emission allowances are needed than those distributed in the initial phase. In the present study three climate protection contribution factor levels were used: i.e. 0%, 5% and 10%. A climate pro- tection contribution level of 5 percent means that the business-as-usual emissions value in 2020 needs to be reduced by 5 percent within the trading period 2013- 2020. In practice, the factor is set by the government of each EU member state. For purposes of the present study, this was the only factor which was allowed to vary. All other model factors were held constant. The variant with a 0% climate protection contribution factor was calcu- lated to show that even without such a reduction target the actors of the waste sector would still have to face and cope with additional costs should the waste sector be incorporated into the EU ETS. 5) Compliance factor: This factor is intended to ensure that the free allocation of emission allowances to an in- dustry is proportionate to the free allowances available at the sectoral level. It is the same for all industries within one sector. A compliance factor of e.g. 0.8 means that an industry is called upon to reduce GHG emissions by 20 percent, e.g. by the introduction of cleaner technology, within the trading period 2013-2020. [30,31,32] 6) Emission forecast: The emission forecast is the ex- pected amount of GHG emissions of a certain period in the absence of additional measures for GHG emission mitigation. This then enables business-as-usual scenarios to be estimated. These are then calculated for each indus- try and summed in order to produce the overall emission projection for the industry (Table 1). 7) Growth factor: The growth factor of an industry shows how an industry’s emission level has grown across trading periods. In the present case, the factor shows the growth rate of the emission forecast for the 2013 to 2020 period compared to the emission level in the 2008 to 2012 period (see Table 1). 8) Potential factor for emission reduction: This factor describes the technical GHG reduction potential of the sector. A factor of 1 means no emission reduction poten- tial is available, 0 indicates that technical possibilities exist for reducing all GHG emissions to zero [30,31]. Obviously, this f actor is largely determined by the po ten- tial for technical progress. Since specific information concerning the reduction potential of individual installa- tions or industries of the waste sector is not available, and since the potential factor is the same for all four in- dustries within the waste sector and has no impact on the results calculated, in the present study the value for the reduction potential factor is kept constant (=1) over all Open Access LCE 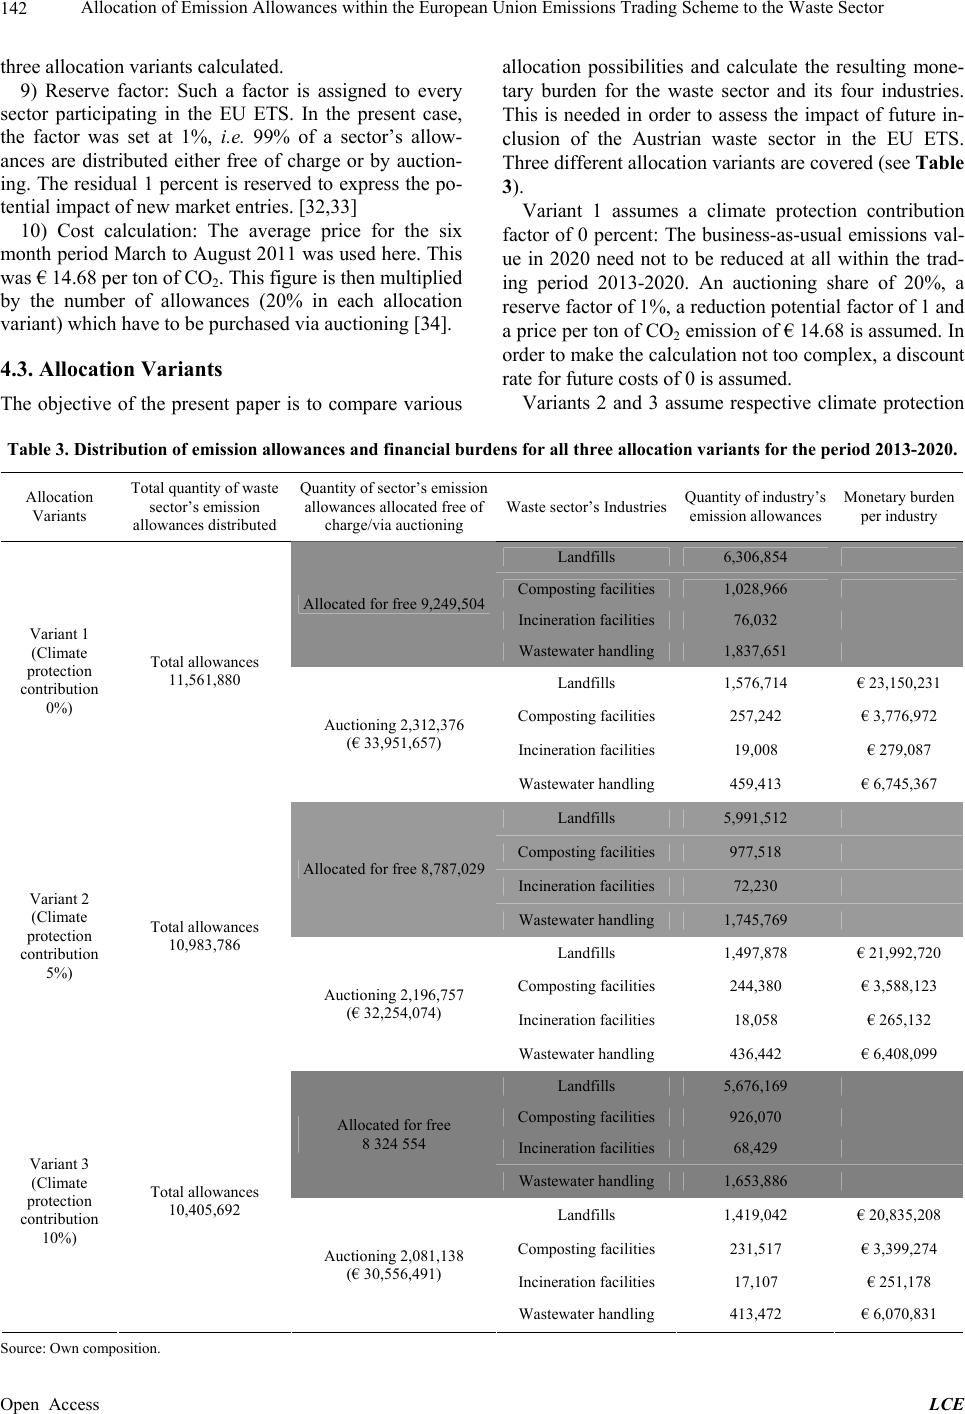 Allocation of Emission Allowances within the European Union Emissions Trading Scheme to the Waste Sector 142 three allocation variants calculated. 9) Reserve factor: Such a factor is assigned to every sector participating in the EU ETS. In the present case, the factor was set at 1%, i.e. 99% of a sector’s allow- ances are distributed either free of charge or by auction- ing. The residual 1 percent is reserved to express the po- tential impact of new market entries. [32,33] 10) Cost calculation: The average price for the six month period March to August 2011 was used here. This was € 14.68 per ton of CO2. This figure is then multiplied by the number of allowances (20% in each allocation variant) which have to be purc hased via auctioning [34] . 4.3. Allocation Variants The objective of the present paper is to compare various allocation possibilities and calculate the resulting mone- tary burden for the waste sector and its four industries. This is needed in order to assess the impact of future in- clusion of the Austrian waste sector in the EU ETS. Three different allocation variants are covered (see Table 3). Variant 1 assumes a climate protection contribution factor of 0 percent: The business-as-usual emissions val- ue in 2020 need not to be reduced at all within the trad- ing period 2013-2020. An auctioning share of 20%, a reserve factor of 1%, a reduction potential factor of 1 and a price per ton of CO2 emission of € 14.68 is assumed. In order to make the calculation not too complex, a discount rate for future costs of 0 is assumed. Variants 2 and 3 assume respective climate protection Table 3. Distribution of emission allowances and financial burdens for all three allocation variants for the period 2013-2020. Allocation Variants Total quantity of waste sector’s emission allowances distributed Quantity of sector’s emission allowances allocated free of charge/via auctioning Waste sector’s IndustriesQuantity of industry’s emission allowances Monetary burden per industry Landfills 6,306,854 Composting facilities 1,028,966 Incineration facilities 76,032 Allocated for free 9,249,504 Wastewater handling 1,837,651 Landfills 1,576,714 € 23,150,231 Composting facilities 257,242 € 3,776,972 Incineration facilities 19,008 € 279,087 Variant 1 (Climate protection contribution 0%) Total allowances 11,561,880 Auctioning 2,312,376 (€ 33,951,657) Wastewater handling 459,413 € 6,745,367 Landfills 5,991,512 Composting facilities 977,518 Incineration facilities 72,230 Allocated for free 8,787,029 Wastewater handling 1,745,769 Landfills 1,497,878 € 21,992,720 Composting facilities 244,380 € 3,588,123 Incineration facilities 18,058 € 265,132 Variant 2 (Climate protection contribution 5%) Total allowances 10,983,786 Auctioning 2,196,757 (€ 32,254,074) Wastewater handling 436,442 € 6,408,099 Landfills 5,676,169 Composting facilities 926,070 Incineration facilities 68,429 Allocated for free 8 324 554 Wastewater handling 1,653,886 Landfills 1,419,042 € 20,835,208 Composting facilities 231,517 € 3,399,274 Incineration facilities 17,107 € 251,178 Variant 3 (Climate protection contribution 10%) Total allowances 10,405,692 Auctioning 2,081,138 (€ 30,556,491) Wastewater handling 413,472 € 6,070,831 Source: Own composition. Open Access LCE 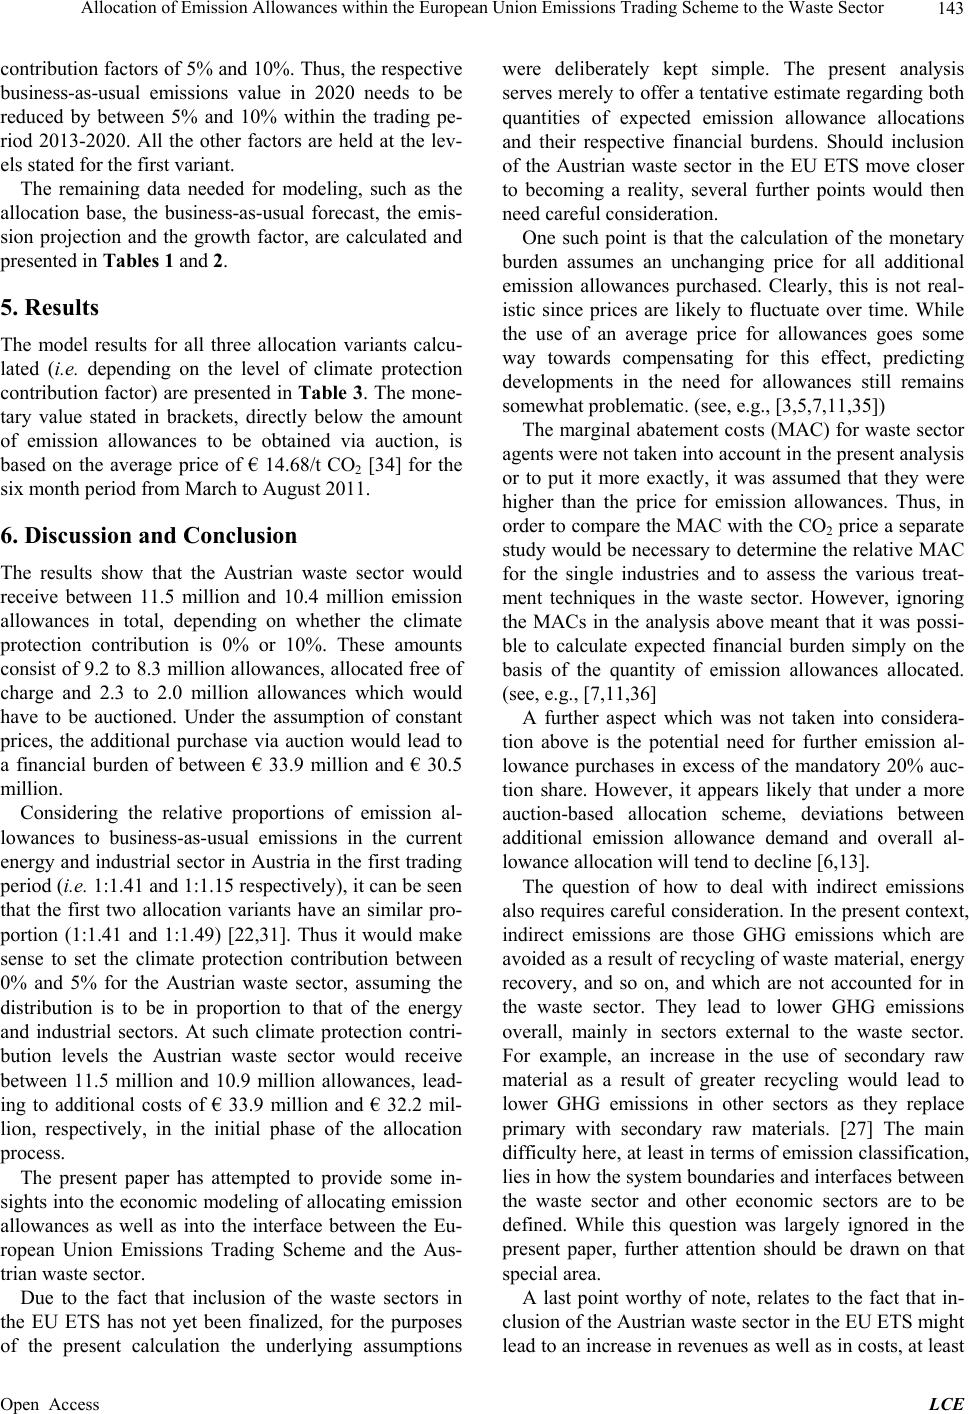 Allocation of Emission Allowances within the European Union Emissions Trading Scheme to the Waste Sector 143 contribution factors of 5% and 10%. Thus, the respective business-as-usual emissions value in 2020 needs to be reduced by between 5% and 10% within the trading pe- riod 2013-2020. All the other factors are held at the lev- els stated for the first variant. The remaining data needed for modeling, such as the allocation base, the business-as-usual forecast, the emis- sion projection and the growth factor, are calculated and presented in Table s 1 and 2. 5. Results The model results for all three allocation variants calcu- lated (i.e. depending on the level of climate protection contribution factor) are presented in Table 3. The mone- tary value stated in brackets, directly below the amount of emission allowances to be obtained via auction, is based on the average price of € 14.68/t CO2 [34] for the six month period from March to August 2011. 6. Discussion and Conclusion The results show that the Austrian waste sector would receive between 11.5 million and 10.4 million emission allowances in total, depending on whether the climate protection contribution is 0% or 10%. These amounts consist of 9.2 to 8.3 million allowances, allocated free of charge and 2.3 to 2.0 million allowances which would have to be auctioned. Under the assumption of constant prices, the additional purchase via auction would lead to a financial burden of between € 33.9 million and € 30.5 million. Considering the relative proportions of emission al- lowances to business-as-usual emissions in the current energy and industrial sector in Austria in the first trading period (i.e. 1:1.41 and 1:1.15 respectively), it can be seen that the first two allocation variants have an similar pro- portion (1:1.41 and 1:1.49) [22,31]. Thus it would make sense to set the climate protection contribution between 0% and 5% for the Austrian waste sector, assuming the distribution is to be in proportion to that of the energy and industrial sectors. At such climate protection contri- bution levels the Austrian waste sector would receive between 11.5 million and 10.9 million allowances, lead- ing to additional costs of € 33.9 million and € 32.2 mil- lion, respectively, in the initial phase of the allocation process. The present paper has attempted to provide some in- sights into the economic modeling of allocating emission allowances as well as into the interface between the Eu- ropean Union Emissions Trading Scheme and the Aus- trian waste sector. Due to the fact that inclusion of the waste sectors in the EU ETS has not yet been finalized, for the purposes of the present calculation the underlying assumptions were deliberately kept simple. The present analysis serves merely to offer a tentative estimate regarding both quantities of expected emission allowance allocations and their respective financial burdens. Should inclusion of the Austrian waste sector in the EU ETS move closer to becoming a reality, several further points would then need careful consideration. One such point is that the calculation of the monetary burden assumes an unchanging price for all additional emission allowances purchased. Clearly, this is not real- istic since prices are likely to fluctuate over time. While the use of an average price for allowances goes some way towards compensating for this effect, predicting developments in the need for allowances still remains somewhat problematic. (see, e.g., [3,5,7,11,35]) The marginal abatement costs (MAC) for waste sector agents were not taken into account in the present analysis or to put it more exactly, it was assumed that they were higher than the price for emission allowances. Thus, in order to compare the MAC with the CO2 price a separate study would be necessary to determine the relative MAC for the single industries and to assess the various treat- ment techniques in the waste sector. However, ignoring the MACs in the analysis above meant that it was possi- ble to calculate expected financial burden simply on the basis of the quantity of emission allowances allocated. (see, e.g., [7,11,36] A further aspect which was not taken into considera- tion above is the potential need for further emission al- lowance purchases in excess of the mandatory 20% auc- tion share. However, it appears likely that under a more auction-based allocation scheme, deviations between additional emission allowance demand and overall al- lowance allocation will tend to decline [6,13]. The question of how to deal with indirect emissions also requires careful consideration. In the present context, indirect emissions are those GHG emissions which are avoided as a result of recycling of waste material, energy recovery, and so on, and which are not accounted for in the waste sector. They lead to lower GHG emissions overall, mainly in sectors external to the waste sector. For example, an increase in the use of secondary raw material as a result of greater recycling would lead to lower GHG emissions in other sectors as they replace primary with secondary raw materials. [27] The main difficulty here, at least in terms of emission classification, lies in how the system boundaries and interfaces between the waste sector and other economic sectors are to be defined. While this question was largely ignored in the present paper, further attention should be drawn on that special area. A last point worthy of note, relates to the fact that in- clusion of the Austrian waste sector in the EU ETS might lead to an increase in revenues as well as in costs, at least Open Access LCE  Allocation of Emission Allowances within the European Union Emissions Trading Scheme to the Waste Sector 144 for some players. If the waste sector causes fewer GHG emissions than expected, the internal demand for emis- sion allowances may decrease, leading to the possibility of some agents gaining revenues by selling the superflu- ous emission allowances to other EU ETS sectors and/or players. Such a change in requirements would also affect the market price for emission allowances (see, e.g., [6,7,35,37]. How and to what extent this interdependency between internal emission reduction, supply and demand of emission allowances and their market price would affect the waste sector cannot be predicted and thus were not part of the present paper. Clearly, considerable further research is needed in or- der to address all the points associated with inclusion of the Austrian waste sector in the EU ETS. 7. Acknowledgements This study is par t of a r esearch proj ect fund ed b y Altstoff Recycling Austria AG and Saubermacher Dienstleistungs AG. The authors wish to thank them both for their con- structive ideas and support, especially Christoph Scharff, Roland Pomberger, Dieter Schuch and Hannes Klampfl- Pernold. REFERENCES [1] United Nations (UN), “Kyoto-Protocol to the United Na- tions Framework Convention on Climate Change,” 1998. http://unfccc.int/resource/docs/convkp/kpeng.pdf [2] European Commission (EC), “Directive 2003/87/EC of 13 October 2003 of the European Parliament and of the Council Establishing a Scheme for Greenhouse Gas Emission Allowance Trading within the Community and Amending Council Directive 96/61/EC,” Brussels, 2003. [3] D. Toke, “Trading Schemes, Risks and Costs: The Chase of the European Union Emissions Trading Scheme and the Renewables Obligation,” Environment and Planning C: Government and Policy, Vol. 26, No. 5, 2008, pp. 938- 953. http://dx.doi.org/10.1068/c0728j [4] F. Schuppert, “Climate Change Mitigation and Intergen- erational Justice,” Environmental Politics, Vol. 20, No. 3, 2011, pp. 303-321. http://dx.doi.org/10.1080/09644016.2011.573351 [5] S. Goers and B. Pflüglmayer, “Post-Kyoto Global Emis- sions Trading: Perspectives for Linking National Emis- sions Trading Schemes with the EU ETS in a Bottom-Up Approach,” Low Carbon Economy, Vol. 3, No. 3A, 2012, pp. 69-79. http://dx.doi.org/10.4236/lce.2012.323010 [6] M. Grubb and K. Neuhoff, “Allocation and Competitive- ness in the EU Emissions Trading Scheme: Policy Over- view,” Climate Policy, Vol. 6, No. 1, 2006, pp. 7-30. http://dx.doi.org/10.1080/14693062.2006.9685586 [7] D. C. Matisoff, “Making Cap-and-Trade Work: Lessons from the European Union experience,” Environment: Science and Policy for Sustainable Development, Vol. 52, No. 1, 2010, pp. 10-19. http://dx.doi.org/10.1080/00139150903479530 [8] E. Gentil, T. H. Christensen and E. Aoustin, “Greenhouse Gas Accounting and Waste Management,” Waste Man- agement and Research, Vol. 27, No. 8, 2009, pp. 696- 706. [9] European Commission (EC), “Directive 2008/101/EC of 19 November 2009 of the European Parliament and of the Council Amending Directive 2003/87/EC so as to Include Aviation Activities in the Scheme for Greenhouse Gas Emission Allowance Trading within the Community,” Brussels, 2008. [10] S. Perdan and A. Azapagic, “Carbon Trading: Current Schemes and Future Developments,” Energy Policy, Vol. 39, No. 10, 2011, pp. 6040-6054. http://dx.doi.org/10.1016/j.enpol.2011.07.003 [11] A. Lepone, R. T. Rahman and J.-Y. Yang, “The Impact of European Union Emissions Trading Scheme (EU ETS) National Allocation Plans (NAP) on Carbon Markets,” Low Carbon Economy, Vol. 2, No. 2, 2011, pp. 71-90. http://dx.doi.org/10.4236/lce.2011.22011 [12] European Commission (EC), “EU Action against Climate Change: The EU Emissions Trading Scheme,” Luxem- bourg, 2008. [13] E. Benz, A. Löschel and B. Sturm, “Auctioning of CO2 Emission Allowances in Phase 3 of the EU Emissions Trading Scheme,” Climate Policy, Vol. 10, No. 6, 2010, pp. 705-718. http://dx.doi.org/10.3763/cpol.2009.0055 [14] European Commission (EC), “European Commission Website,” 2011. http://ec.europa.eu/clima/policies/ets [15] PointCarbon, “Point Carbon’s OTC Price Assessments,” 2011. http://www.pointcarbon.com/ [16] B. Ander son and C. Di Ma ri a, “Abatement and Allocation in the Pilot Phase of the EU ETS,” Environmental and Resource Economics, Vol. 48, No. 1, 2011, pp. 83-103. http://dx.doi.org/10.1007/s10640-010-9399-9 [17] European Commission (EC), “Directive 2009/29/EC of 23 April 2009 the of the European Parliament and of the Council Amending Directive 2003/87/EC so as to Im- prove and Extend the Greenhouse Gas Emission Allow- ance Trading Scheme of the Community,” Brussels, 2009. [18] M. Hiebel and H. Pflaum, “Recycling for Climate Protec- tion—CO2-Emissions with the Utilisation of Secondary Raw Material in Comparison to the Use of Primary Raw Materials,” Müll und Abfall, Vol. 1, 2009, pp. 4-7. [19] Intergovernmental Panel on Climate Change (IPCC), “Climate Change 2007: Synthesis Report. Contribution of Working Groups I, II and III to the Fourth Assessment Report of the Intergovernmental Panel on Climate Change,” Geneva, 2007. [20] J. Bogner, R. Pipatti, S. Hashimoto, C. Diaz, K. Mareck- ova, L. Diaz, P. Kjeldsen, S. Monni, A. Faaij, Q. Gao, T. Zhang, M. Abdelrafie Ahmed, R. T. M. Sutamihardja and R. Gregory, “Mitigation of Global Greenhouse Gas Emissions from Waste: Conclusions and Strategies from the Intergovernmental Panel on Climate Change (IPCC) Fourth Assessment Report. Working Group III (Mitiga- tion),” Waste Management and Research, Vol. 26, No. 1, 2008, pp. 11-32. Open Access LCE  Allocation of Emission Allowances within the European Union Emissions Trading Scheme to the Waste Sector Open Access LCE 145 [21] Environment Agency Austria (EAA), “Austria’s National Inventory Report: Submission under the United Nations Framework Convention on Climate Change and under the Kyoto Protocol,” REP-0308, Vienna, 2011. [22] Environment Agency Austria (EAA), “GHG Projections and Assessment of Policies and Measure s in Austria: Re- porting Under Decision 280/2004/EC,” REP-0331, Vi- enna, 2011. [23] European Parliament (EP), “Position of the European Parliament Adopted at First Reading on 17. December 2008 to Improve and Extend the Greenhouse Gas Emis- sion Allowance Trading System by the Community,” Consolidated Legislative Document, 2008. [24] W. Winiwarter and K. Rypdal, “Assessing the Uncer- tainty Associated with National Greenhouse Gas Emis- sion Inventories: A Case Study for Austria,” Atmospheric Environment, Vol. 35, No. 32, 2001, pp. 5425-5440. http://dx.doi.org/10.1016/S1352-2310(01)00171-6 [25] Environment Agency Austria (EAA), “Austria’s National Inventory Report: Submission under the United Nations Framework Convention on Climate Change and under the Kyoto Protocol,” REP-0265, Vienna, 2010. [26] S. Manfredi, D. Tonini, T. H. Christensen and H. Scharff, “Landfill of Waste Accounting of Greenhouse Gases and Global Warming Contributions,” Waste Management and Research, Vol. 27, No. 8, 2009, pp. 825-836. http://dx.doi.org/10.1177/0734242X09348529 [27] C. Rootes, “Environmental Movements, Waste and Waste Infrastructure: An Introduction,” Environmental Politics, Vol. 18, No. 6, 2009, pp. 817-834. http://dx.doi.org/10.1080/09644010903345587 [28] M. Adam, H. Hentschke and S. Kopp-Assenmacher, “Handbuch des Emissionshandelsrechts” [Handbook of the Emissions Trading Law], Springer-Verlag, Berlin, 2006. [29] D. Demailly and P. Quirion, “CO2 Abatement, Competi- tiveness and Leakage in the European Cement Industry under the EU ETS: Grandfathering versus Output-Based Allocation,” Climate Policy, Vol. 6, No. 1, 2006, pp. 93- 113. http://dx.doi.org/10.1080/14693062.2006.9685590 [30] Federal Ministry for Agriculture, Forestry, Environment and Water Management, “National Allocation Plan for Austria Pursuant to Art.11 of the EZG,” Vienna, 2004. [31] Federal Ministry for Agriculture, Forestry, Environment and Water Management, “Austria’s National Allocation Plan Pursuant to Art.11 of the EZG for the Trading Period 2008-2012,” Vienna, 2007. [32] Legal Information System of the Republic of Austria, Emissionszertifikategesetz (EZG), Bundesgesetzblatt für die Republik Österreich, 46. Bundesgesetz [Austria’s Emissions Allowance Trading Act, BGBl. I Nr. 46/2004, 1-16] Vienna, 2004. [33] Legal Information System of the Republic of Austria, Zuteilungsverordnung 2. Periode, Bundesgesetzblatt für die Republik Österreich, 279. Verordnung [Austria’s Or- dinance on the Distribution of Emission Allowances for the Second Trading Period, BGBl. II Nr. 279/2007, 1-12] Vienna, 2007. [34] European Energy Exchange (EEX), “EU Emission Al- lowances,” 2011. www.eex.com [35] W. Lise, J. Sijm and B. F. Hobbs, “The Impact of the EU ETS on Prices, Profits and Emissions in the Power Sector: Simulation Results with the COMPETES EU20 Model,” Environmental and Resource Economics, Vol. 47, No. 1, 2010, pp. 23-44. http://dx.doi.org/10.1007/s10640-010-9362-9 [36] A. D. Ellerman and B. K. Buchner, “Over-Allocation or Abatement? A Preliminary Analysis of the EU ETS Based on the 2005-06 Emissions Data,” Environmental and Resource Economics, Vol. 41, No. 2, 2008, pp. 267-287. http://dx.doi.org/10.1007/s10640-008-9191-2 [37] S. Monjon and P. Quirion, “A Border Adjustment for the EU ETS: Reconciling WTO Rules and Capacity to Tackle Carbon Leakage,” Climate Policy, Vol. 11, No. 5, 2011, pp. 1212-1225. http://dx.doi.org/10.1080/14693062.2011.601907
|