Engineering, 2013, 5, 472-476
http://dx.doi.org/10.4236/eng.2013.510B097 Published Online October 2013 (http://www.scirp.org/journal/eng)
Copyright © 2013 SciRes. ENG
Identification of Deleterious Single Amino Acid
Polymorphism Using Sequence Information Based on
Feature Selection and Parameter Optimization
Xiao Chen, Qinke Peng, Jia Lv
Systems Engineering Institute of Electronic and Information Engineering School, Xi’an Jiaotong University, Xi’an, China
Email: xchen_xjtu@163.com, qkepeng@xjtu.edu.cn, lvjia2008@yahoo.cn
Received 2013
Abstract
Most of the human genetic variations are single nucleotide polymorphisms (SNPs), and among them, non-synonymous
SNPs, also known as SAPs, attract extensive interest. SAPs can b e neural or disease associated. Many studies have been
done to distinguish deleterious SAPs from neutral ones. Since many previous studies were based on both structural and
sequence features of the SAP, these methods are not applicable when protein structures are not available. In the current
paper, we developed a method based on UMDA and SVM using protein sequence information to predict SAP’s disease
association. We extracted a set of features that are independent of protein structure for each SAP. Then a SVM-based
machine-learning classifier that used grid search to tune parameters was applied to predict the possible disease asso cia-
tion of SAPs. The SVM method reaches good prediction accuracy. Since the input data of SVM contain irrelevant and
noisy features and parameters of SVM also affect the prediction performance, we introduced UMDA-based wrapper
approach to search for the ‘best’ solution. The UMDA-based method greatly improved prediction performance. Com-
pared with current method, our method achieved better performance.
Keywords: Single Amino Acid Polymorphisms; Support Vector Machine; Univariate Marginal Distribution Algorithm
1. Introduction
With the completion of the human genome project, more
and more single nucleotide polymorphisms (SNPs) are
collected. It’s estimated that around 90% of human ge-
netic variations are SNPs [1], among them, the single
amino acid polymorphisms (SAPs), also known as non-
synonymous SNPs or nsSNPs, cause amino acid substi-
tutions in the protein product, and they have the potential
to affect protein structure and function. Some of the
SAPs won’t make any change in phenotype, so we con-
sider them neutral, while others account for many human
genetic diseases, so we consider them deleterious [2]. It’s
important to discriminate deleterious nsSNPs from neu-
tral ones for the study of human disease.
So far, many methods have been developed to predict
possible disease association of SAPs. For example, em-
pirical rules [3,4], probabilistic models [5], and machine
learning techniques [6-12] are used to classify SAPs.
These studies use various features to distinguish delete-
rious nsSNPs from neutral ones. Some of the methods
use features derived from protein sequences [4,6-8] while
others use both sequential and structural features [9-12].
An up-to-date study predicted deleterious SAPs by add-
ing network features based on sequential features and
structural features [13]. However, a limitation of the me-
thods using structural features is that they are applicable
only when protein structures are known, while the major-
ity of proteins don’t have available structur al information.
Therefore, it’s significant to predict deleterious SAPs
with high accuracy only using sequential information.
Some previous methods can predict the disease associa-
tion of SAPs using only sequence information. Maybe
because some sequence information hasn’t been explored
or the features haven’t been optimized by the previous
studies, their prediction accuracy is not high enough to
omit further research.
In this study, we extracted a set of 130 features, and
these features are independent of protein structure. Each
SAP was encoded by 130 features, and then a SVM-
based machine-learning classifier is applied to predict the
possible disease association of SAPs. It’s not clear which
features are relevant with the prediction, so feature selec-
tion is often used to improve the prediction accuracy. On
the other hand, the parameters of the classifier have an
*This work was jointly supp orted by National Natural Science Found a-
tion of China (Grant No. 60774086 and No. 61173111) and Ph.
D.
Programs
Foundation of Ministry of Education of China (Grant No.
20090201110027).
X. CHEN ET AL.
Copyright © 2013 SciRes. ENG
473
important effect on the classification performance. Thus,
we applied a UMDA-based method which can select
features and optimize parameters simultaneously. Using
the selected features and parameters, SVM classifier
achieves better prediction performance.
2. Methods
2.1. Feature Construction
2.1.1. Conservation Attributes
The degree to which a residue is conserved is very im-
portant for the classification of SAPs. We measured the
residue conservation by using PSI-BLAST [14]. PSI-
BLAST can output Position Specific Scoring Matrix
(PSSM), which is an L*20 matrix and L in this study is
the length of input sequence. First, we derived three
attributes from PSSM, that is, the observed frequencies
of original residue and substitution residue in SAP, and
their difference. Then we also obtained conservation
score of the SAP’s neighbors, from the output of PSI-
BLAST directly. Saunders’ study showed that the num-
ber of homologous sequence in alignment can reflect the
reliability of PSSM, so we added this value as an attri-
bute.
2.1.2. Motif Attributes
Motifs are some conservative segments in the protein
sequence, and they contain lots of biological information.
In this study, we used MEME [15] to extract motifs from
database. Finally, we got 27 motifs from deleterious SAP
dataset and 20 motifs from neural SAP dataset by setting
different parameters. Then for each SAP’s neighbor se-
quence, if one motif appeared in it, we set the attribute
to1. Otherwise, set the attribute to 0. In this way, we ob-
tained 47 attributes.
2.1.3. Physicochemical Properties of Amino Acid
If the difference between the physicochemical properties
of the original amino acid and the variation amino acid is
big, the SAP is likely to cause changes of protein’s func-
tion. If the difference is small, the SAP may be compati-
ble by the body and won’t be deleterious. We considered
four kinds of properties of amino acid that were molecu-
lar weight, pI value, hydrophobicity value, and conserva-
tive value. For each SAP, property values of the original
amino acid and the variation amino acid as well as their
differences of corresponding property value between the
two amino acids were calculated.
2.1.4. Amino Acid Submissi on R ates
Matthew’s report pointed that amino acid submission
rates in the deleterious SAP dataset and in the neural
SAP dataset are different. For the deleterious SAP data-
set, submission rates between physicochemically similar
amino acids are lower, and that between highly physico-
chemically different amino acids are higher. However,
amino acid submission rates for the neural SAP dataset
come to the contrary. Thus, for each SAP, the difference
between the logarithms of submission rates in the delete-
rious set and the neural set was calculated as an attribute:
22
=log log
nd
ij ij
SubDif pp
(1)
where
n
ij
p
and
d
ij
p
are the submission rates of amino
acid
i
and
j
in the deleterious SAP dataset and the
neural SAP dataset respectively.
2.1.5. Position Attributes
We supposed that the position where SAP is in the pro-
tein sequence has an effect on the disease association of
the SAP. Based on the above guess, we divided the pro-
tein sequence into five same areas according to the posi-
tion. These fiv e areas were n amed by
( )
1, 2,5
i
Areai =
.
Here a 5-dimension vector,
, was
used as features. If the SAP is located in the
i
Area
,
i
pos
was set to 1. Otherwise, set
i
pos
to -1:
S AP
1,
S AP
1,
i
ii
Area
pos Area
=
(2)
2.1.6. Stability of Protein
The physicochemical properties stability of a protein
sequence may be associated with the function change
[16]. Thus, we calculated the average property values of
SAP’s neighbor sites, including four amino acids in the
downstream and four in the upstream. The difference
between the property value of original amino acid and
the average value, as well as the difference between the
property value of variation amino acid and the average
value were also calculated.
41
14
( )8
prop i i
ii
Avgprop prop
= =−
= +
∑∑
(3 )
prop prop
Odiff AvgO= −
(4)
prop prop
Vdiff AvgV= −
5)
where
{
}
propmolecular weight, pI v alue ,
hydrophobicity value, c onserv ative value
,
prop
O
represents the property value of original amino
acid and
prop
V
is that of variation amino acid.
i
prop
is
the property of the
ith
site around the SAP. prop
Avg
is
the average property value of SAP’s neighbor sites.
2.1.7. Sequence Features Used in Previous Study
Hu et al. [8] calculated 686 features which were derived
from sequence information for each SAP, and selected 10
features at last. Among the 10 selected features, is HLA
X. CHEN ET AL.
Copyright © 2013 SciRes. ENG
474
indicates whether the protein in which the SAP located
belongs to the HLA family, METAL and MOD_RES
shows whether the SAP is close to functional sites,
nor_diff_freq is the normalized frequency difference be-
tween original residue and substitution residue, and the
other features are defined based on entries from AAindex
that is a public database of amino acid properties.
2.2. SVM Classifier and Performance Measure
The classifier we used in our study is Support Vector
Machine (SVM), which separates transformed data with
a hyper plane in a high-dimensional space. SVM has
been widely used in classification in bioinformatics. We
adopted the LIBSVM that used the radial basis function
(RBF) as the kernel function[17].
We used grid-search method to search the best values
of the penalty coefficient C and the kernel parameter
γ
.
C was set to
76 8
2 ,2 ,,2
−−
, and so does
γ
. We tried all
the combinations of C and
γ
, then selected the pair that
got the bes t 5-fold cross-validation accuracy.
Let “Disease” be the positive class and “Polymor-
phism” be the negative class. The overall accuracy is de-
fined as below.
TP TN
ACC TP TNFPFN
+
=+++
(6)
where TP is the number of true positive; TN is the num-
ber of true negative; FP is the number of false positive
and FN is the number of false negative. We also calcu-
lated the Matthew’s correlation coefficient (MCC),
which is more realistic than ACC on an unbalanced da-
taset [18].
( )()()( )
MCC
TP TNFPFN
TP FN TP FPTNFN TNFP
×−×
=
+++ +
(7)
The higher the ACC and MCC are, the better the clas-
sifier’s performance is.
2.3. UMDA Method
Estimation Distribution Algorithms (EDAs) [19] are ev o-
lutionary searching strateg ies without crossing and muta-
tion operators. In EDAs, the new population is sampled
from a probability distribution which is estimated from
the fittest individuals. Univariate marginal distribution
algorithm (UMDA) is a type of EDAs, and UMDA as-
sumes that the variables in the problem were independent.
In our study, UMDA was used to search for the “best”
solution, including a feature subset and a set of SVM
parameters. In the UMDA-based method, the binary
coding chromosome representation is shown as F igure
1. In Figure 1, 1
f
v~
f
n
f
v
denotes the feature mask, the
1
f
v
i
f
v
f
n
f
v
1
C
v
j
C
v
C
n
C
v
1
v
σ
k
v
σ

n
v
γ
σ
Figure 1. The binary coding chromosome.
bit with value “1” indicates the feature is selected and “0”
indicates not.
1
c
v
~
c
n
c
v
,
1
v
γ
~
n
v
γ
γ
denote the value of pa-
rameter C and
γ
, respectively.
f
n
, c
n and
n
γ
are
the number of bits indicating the features, parameters C
and
γ
. c
n and
n
γ
are chosen according to the calcu-
lation precision required. In our study,
130
f
n=
,
15
c
n=
and
15n
γ
=
.
The procedure of UMDA-based method is given as
follows:
S1: Generate M individuals randomly.
S2: Evaluate the fitn ess value (ACC) of each ind ividu-
al.
S3: Sort the individuals according to their fitness val-
ues from high to low.
S4: Select
N
(
NM
) individuals with higher fit-
ness value from population.
S5: Estimate the probability distribution of the
tth
ite-
ration
()
t
px
by the selected individuals.
( )
( )
1
1
1
1
1
|
( |)
=
nSel
it
i
NSel
nji it
i
t
j
pxp xpop
Xx pop
N
δ
=
=
=
=
=
(8)
where
n
is the number of variables, and
( )
1
1
|0
ii
Sel
ji il
Xx
Xx popothers
δ
=
==
(9)
S6: Retain
N
fittest individuals and sample
MN
in-
dividual s f r om
()
t
px
to form t he next generati on.
S7: If the termination criterion is satisfied, stop. Oth-
erwise, go to S2. The maximum number of iterations is
the termination criterion.
3. Experiment and Result
In this study, we acquired SAP data from Swiss-Prot
knowledgebase for the prediction of SAPs [20]. SAPs in
the Swiss-Prot are classified into three categories, “Dis-
ease”, “Polymorphism”, and “Unclassified”. SAP with
disease association is annotated with “Disease” (same as
“deleterious”); SAP with no reported disease association
is annotated with “Polymorphism” (same as “neutral”);
and SAP whose disease association is unclear is anno-
tated with “Unclassified”. We deleted “Unclassified”
SAPs and focused on “Disease” and “Polymorphism”
ones. After that, the dataset consisted of 19510 disease
SAPs and 33701 polymorphism SAPs. We extracted
5000 SAPs randomly according to the proportion of dis-
ease and polymorphism ones for the prediction of SAPs.
In other words, the final dataset contained 1833 disease
X. CHEN ET AL.
Copyright © 2013 SciRes. ENG
475
SAPs and 3167 neutral SAPs. Hu’s study [8] and Ye’s
study [11] used the data selected from Swiss-Prot, the
structural information of which was available. By con-
trast, we use the data selected randomly from the data-
base were more objective and more reliable.
We compared our method with Hu’s method that pre-
dicted SAP’s disease association using sequence-derived
information. Hu et al. used a greedy approach to select
features useful for the classification of SAPs and 10 fea-
tures were selected. Using the 10 features, a decision tree
method can achieve a high accuracy.
First, we applied Hu’s method on our dataset using the
10 features and decision tree method. In the recent study,
we added 120 features to the previous 10 features, so the
new feature set was obtained. Next, we used a decision
tree which was used in Hu’s method to identify delete-
rious SAPs with the new feature set, and this method was
called NF_DecisionTree. Then the decision tree was re-
placed with SVM that used grid search to tune parame-
ters, and this method was called NF_GridSVM. At last,
we applied the UMDA based method to optimize the
prediction performance, and this method was called
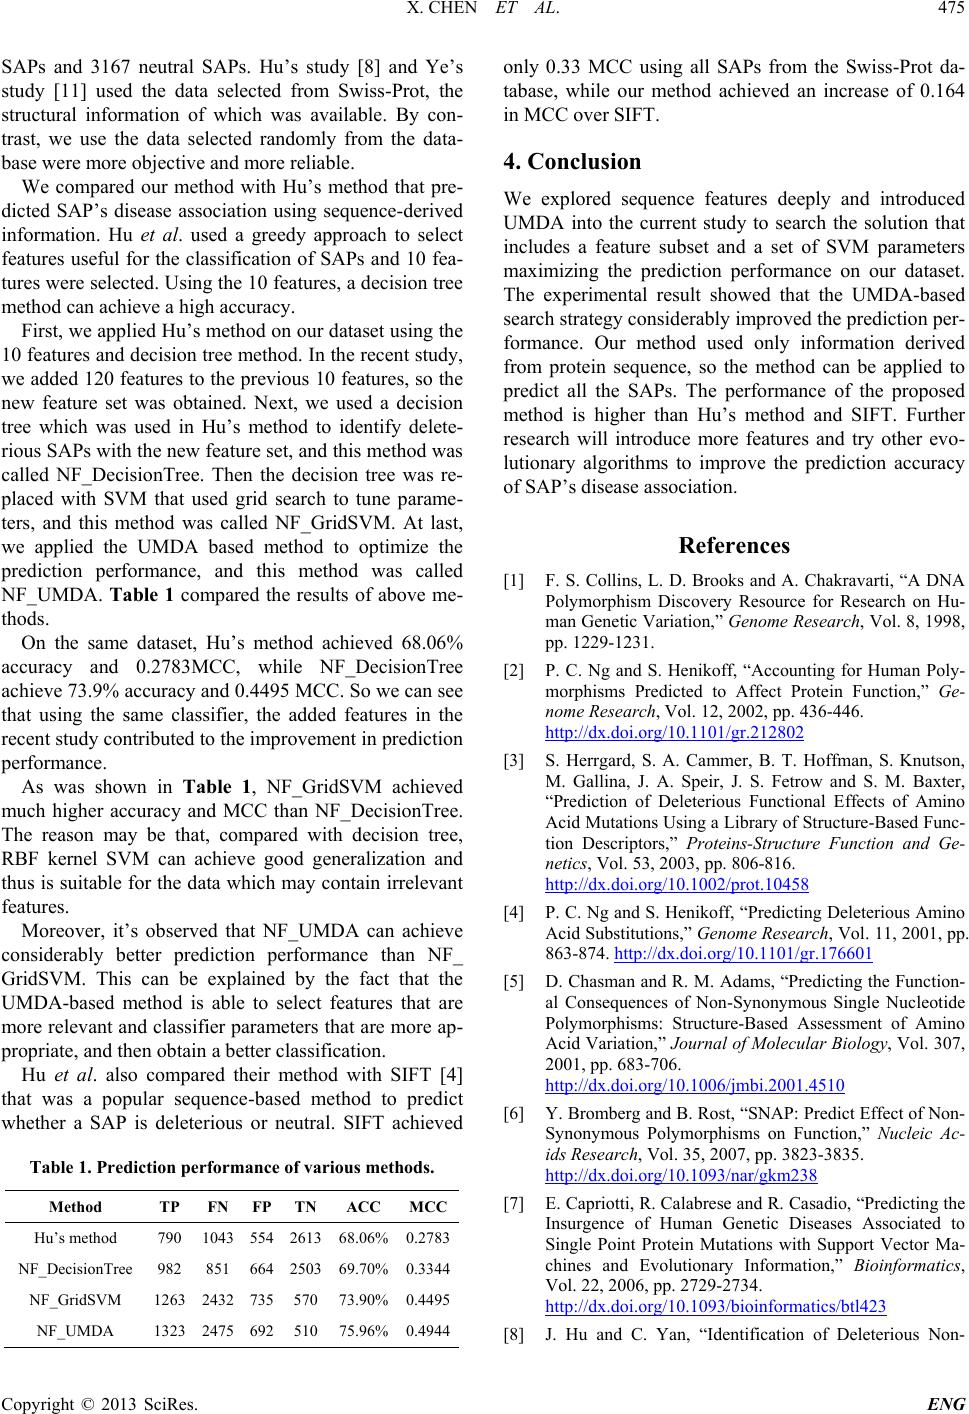
NF_UMDA. Table 1 compared the results of above me-
thods.
On the same dataset, Hu’s method achieved 68.06%
accuracy and 0.2783MCC, while NF_DecisionTree
achieve 73.9% accuracy and 0.4495 MCC. So we can see
that using the same classifier, the added features in the
recent study contributed to the improvement in prediction
performance.
As was shown in Table 1, NF_GridSVM achieved
much higher accuracy and MCC than NF_DecisionTree.
The reason may be that, compared with decision tree,
RBF kernel SVM can achieve good generalization and
thus is suitable for the data which may contain irrelevant
features.
Moreover, it’s observed that NF_UMDA can achieve
considerably better prediction performance than NF_
GridSVM. This can be explained by the fact that the
UMDA-based method is able to select features that are
more relevant and classifier parameters that are more ap-
propriate, and then obtain a better classification.
Hu et al. also compared their method with SIFT [4]
that was a popular sequence-based method to predict
whether a SAP is deleterious or neutral. SIFT achieved
Table 1. Predic ti on performance of various methods.
Method TP FN FP TN ACC MCC
Hu’s method 790 1043 554 2613 68.06% 0.2783
NF_DecisionTree 982 851 664 2503 69.70% 0.3344
NF_GridSVM 1263 2432 735 570 73.90% 0.4495
NF_UMDA 1323 2475 692 510 75.96% 0.4944
only 0.33 MCC using all SAPs from the Swiss-Prot da-
tabase, while our method achieved an increase of 0.164
in MCC over SIFT.
4. Conclusion
We explored sequence features deeply and introduced
UMDA into the current study to search the solution that
includes a feature subset and a set of SVM parameters
maximizing the prediction performance on our dataset.
The experimental result showed that the UMDA-based
search strategy considerably improved the prediction per-
formance. Our method used only information derived
from protein sequence, so the method can be applied to
predict all the SAPs. The performance of the proposed
method is higher than Hu’s method and SIFT. Further
research will introduce more features and try other evo-
lutionary algorithms to improve the prediction accuracy
of SAP’s disease association.
References
[1] F. S. Collins, L. D. Brooks and A. Chakravarti, “A DNA
Polymorphism Discovery Resource for Research on Hu-
man Gene tic Variati on,Genome Research, Vol. 8, 1998,
pp. 1229-1231.
[2] P. C. Ng and S. Henikoff, “Accounting for Human Poly-
morphisms Predicted to Affect Protein Function,” Ge-
nome Research, Vol. 12, 2002, pp. 436-446.
http://dx.doi.org/10.1101/gr.212802
[3] S. Herrgard, S. A. Cammer, B. T. Hoffman, S. Knutson,
M. Gallina, J. A. Speir, J. S. Fetrow and S. M. Baxter,
“Prediction of Deleterious Functional Effects of Amino
Acid Mutations Using a Library of Structure-Based Func-
tion Descriptors,” Proteins-Structure Function and Ge-
netics, Vol. 53, 2003, pp. 806-816.
http://dx.doi.org/10.1002/prot.10458
[4] P. C. Ng and S. Henikoff, “Predicting Deleterious Amino
Acid Substitutions,” Genome Research, Vol. 11, 2001, pp.
863-874. http://dx.doi.org/10.1101/gr.176601
[5] D. Chasman and R. M. Adams, “Predicting the Function-
al Consequences of Non-Synonymous Single Nucleotide
Polymorphisms: Structure-Based Assessment of Amino
Acid Variation,” Journal of Molecular Biology, Vol. 307,
2001, pp. 683-706.
http://dx.doi.org/10.1006/jmbi.2001.4510
[6] Y. Bromberg and B. Rost, “SNAP: Predict Effect of Non-
Synonymous Polymorphisms on Function,” Nucleic Ac-
ids Research, Vol. 35, 2007, pp. 3823-3835.
http://dx.doi.org/10.1093/nar/gkm238
[7] E. Capriotti, R. Calabrese and R. Casadio, “Predicting the
Insurgence of Human Genetic Diseases Associated to
Single Point Protein Mutations with Support Vector Ma-
chines and Evolutionary Information,” Bioinformatics,
Vol. 22, 2006, pp. 2729-2734.
http://dx.doi.org/10.1093/bioinformatics/btl423
[8] J. Hu and C. Yan, “Identification of Deleterious Non-
X. CHEN ET AL.
Copyright © 2013 SciRes. ENG
476
Synonymous Single Nucleotide Polymorphisms Using
Sequence-Derived Information,BMC Bioinformatics,
Vol. 9, 2008. http://dx.doi.org/10.1186/1471-2105-9-297
[9] L. Bao and Y. Cui, “Prediction of the Phenotypic Effects
of Non-Synonymous Single Nucleotide Polymorphisms
Using Structural and Evolutionary Information,Bioin-
formatics, Vol. 21, 2005, pp. 2185-2190.
http://dx.doi.org/10.1093/bioinformatics/bti365
[10] V. G. Krishnan and D. R. Westhead, “A Comparative
Study of Machine-Learning Methods to Predict the Ef-
fects of Single Nucleotide Polymorphisms on Protein
Function,” Bioinformatics, Vol. 19, 2003, pp. 2199-2209.
http://dx.doi.org/10.1093/bioinformatics/btg297
[11] Z.-Q. Ye, S.-Q. Zhao, G. Gao, X.-Q. Liu, R. E. Langlois,
H. Lu and L. Wei, “Finding New Structural and Sequence
Attributes to Predict Possi ble Disease Association of Sin-
gle Amino Acid Lpolymorphism (SAP),” Bioinformatics,
Vol. 23, 2007, pp. 1444-1450.
http://dx.doi.org/10.1093/bioinformatics/btm119
[12] P. Yue, Z. L. Li and J. Moult, “Loss of Protein Structure
Stability as a Major Causative Factor in Monogenic Dis-
ease,” Journal of Molecular Biology, Vol. 353, 2005, pp.
459-473.
http://dx.doi.org/10.1016/j.jmb.2005.08.020
[13] T. Huang, P. Wang, Z.-Q. Ye, H. Xu, Z. He, K.-Y. Feng,
L. Hu, W. Cui, K. Wang, X. Dong, L. Xie, X. Kong, Y.-D.
Cai and Y. Li, “Prediction of Deleterious Non-Syno-
nymous SNPs Based on Protein Interaction Network and
Hybrid Properties,” PloS One, Vol. 5, 2010.
[14] S. F. Altschul, T. L. Madden, A. A. Schäffer, J. Zhang, Z.
Zhang, W. Miller and D. J. Lipman, “Gapped BLAST
and PSI-BLAST: A New Generation of Protein Database
Search Programs,” Nucleic Acids Research, Vol. 25, 1997,
pp. 3389-3402.
[15] T. L. Bailey, C. Elkan, S. D. D. o. C. S. University of
California, and Engineering, Fitting a Mixture Model by
Expectation Maximization to Discover Motifs in Bipoly-
mers, Citeseer, 1994.
[16] J. Cheng, A. Randall and P. Baldi, “Prediction of Protein
Stability Changes for Single-Site Mutations Using Sup-
port Vector Machines,” Proteins: Structure, Func t ion,
and Bioinformatics, Vol. 62, 2006, pp. 1125-1132.
http://dx.doi.org/10.1002/prot.20810
[17] C.-C. Chang and C.-J. Lin, “LIBSVM: A Library for Sup-
port Vector Machines,” ACM Transactions on Intelligent
Systems and Technology, Vol. 2, 2011, pp. 1-27.
http://dx.doi.org/10.1145/1961189.1961199
[18] P. Baldi, S. Brunak, Y. Chauvin, C. A. F. Andersen and H.
Nielsen, “Assessing the Accuracy of Prediction Algo-
rithms for Classification: An Overview,” Bioinformatics,
Vol. 16, 2000, pp. 412-424.
[19] P. Larranaga and J. A. Lozano, Estimation of Distribu-
tion Algorithms: A New Tool for Evolutionary Computa-
tion,” Vol. 2, Springer, The Netherlands, 2002.
[20] Y. L. Yip, H. Scheib, A. V. Diemand, A. Gattiker, L. M.
Famiglietti, E. Gasteiger and A. Bairoch, “The Swiss-Prot
Variant Page and the ModSNP Database: A Resource for
Sequence and Structure Information on Human Protein
Variants,” Human Mutation, Vol. 23, 2004, pp. 464-470.