 Journal of Environmental Protection, 2013, 4, 18-32 Published Online December 2013 (http://www.scirp.org/journal/jep) http://dx.doi.org/10.4236/jep.2013.412A1003 Open Access JEP Short-Term Effects of Ozone and PM2.5 on Mortality in 12 Canadian Cities* Nawal Farhat1#, Tim Ramsay1, Michael Jerrett2, Daniel Krewski1,3 1Department of Epidemiology and Community Medicine, University of Ottawa, Ottawa, Canada; 2School of Public Health, Univer- sity of California at Berkeley, Berkeley, USA; 3McLaughlin Center for Population Health Risk Assessment, University of Ottawa, Ottawa, Canada. Email: #nfarh033@uottawa.ca Received September 19th, 2013; revised October 18th, 2013; accepted November 15th, 2013 Copyright © 2013 Nawal Farhat et al. This is an open access article distributed under the Creative Commons Attribution License, which permits unrestricted use, distribution, and reproduction in any medium, provided the original work is properly cited. In accor- dance of the Creative Commons Attribution License all Copyrights © 2013 are reserved for SCIRP and the owner of the intellectual property Nawal Farhat et al. All Copyright © 2013 are guarded by law and by SCIRP as a guardian. ABSTRACT Numerous recent epidemiological studies have linked health effects with short-term exposure to air pollution levels commonly found in North America. The association between two key pollutants—ozone and fine particulate matter— and mortality in 12 Canadian cities was explored in a time-series study. City-specific estimates were obtained using Poisson regression models, adjusting for the effects of seasonality and temperature. Estimates were then pooled across cities using the inverse variance method. For a 10 ppb increase in 1-hr daily maximum ozone levels, significant associa- tions were in the range of 0.56% - 2.47% increase in mortality. For a 10 μg/m3 increase in the 24-hr average PM2.5 con- centration of, significant associations varied between 0.91% and 3.17% increase in mortality. Generally, stronger asso- ciations were found among the elderly. Effects estimates were robust to adjustment for seasonality, but were sensitive to lag structures. There was no evidence for effect modification of the mortality-exposure association by city-level ecolo- gic covariates. Keywords: Air Pollution; Ozone; Particulate Matter; Mortality; Canada 1. Introduction Health effects of air pollution have become a major pub- lic health concern in North America, Europe and other developed regions in the past several years. The World Health Organization estimated 1.34 million premature deaths (2.4% of total deaths) were attributable to outdoor air pollution in 2008 [1]. Further, using satellite imaging data to predict tropospheric PM2.5 concentrations glob- ally, Evans et al. [2] recently estimated that 7% of global mortality may be attributable to particulate air pollution. In Canada, the Canadian Medical Association’s (CMA) report No Breathing Room—National Illness Costs of Air Pollution published in 2008, stated that air pollution results in considerable health and economic damages that will only increase over time. It was estimated that 21,000 deaths and 92,000 emergency department visits in Can- ada could be attributed to short- and long-term exposure to air pollution in year 2008. Associated economic costs for the year, including worker absenteeism, higher health care costs, loss of life, and other factors were expected to exceed $10 billion [3]. Numerous studies have shown positive and significant associations between adverse health effects and short- term exposure to ozone (O3) and particulate matter (PM), both of which are major components of smog in Canada [4-16]. Both pollutants have been linked to various health effects including premature mortality, deaths, and hospi- tal admissions due to respiratory or cardiovascular dis- eases. Other effects reported include decreases in lung *Declaration of interest: Funding was provided through the McLaughlin Center for Population Health Risk Assessment. D. Krewski holds a atural Sciences and Engineering Research Council Industrial Re- search Chair in Risk Science at the University of Ottawa, a peer-re- viewed Canadian university-industry partnership program. He also serves as Chief Risk Scientist for Risk Sciences International, a Cana- dian company established in partnership with the University of Ottawa (www.risksciences.com) which has conducted air pollution risk as- sessments for public and private sector clients. #Corresponding author. 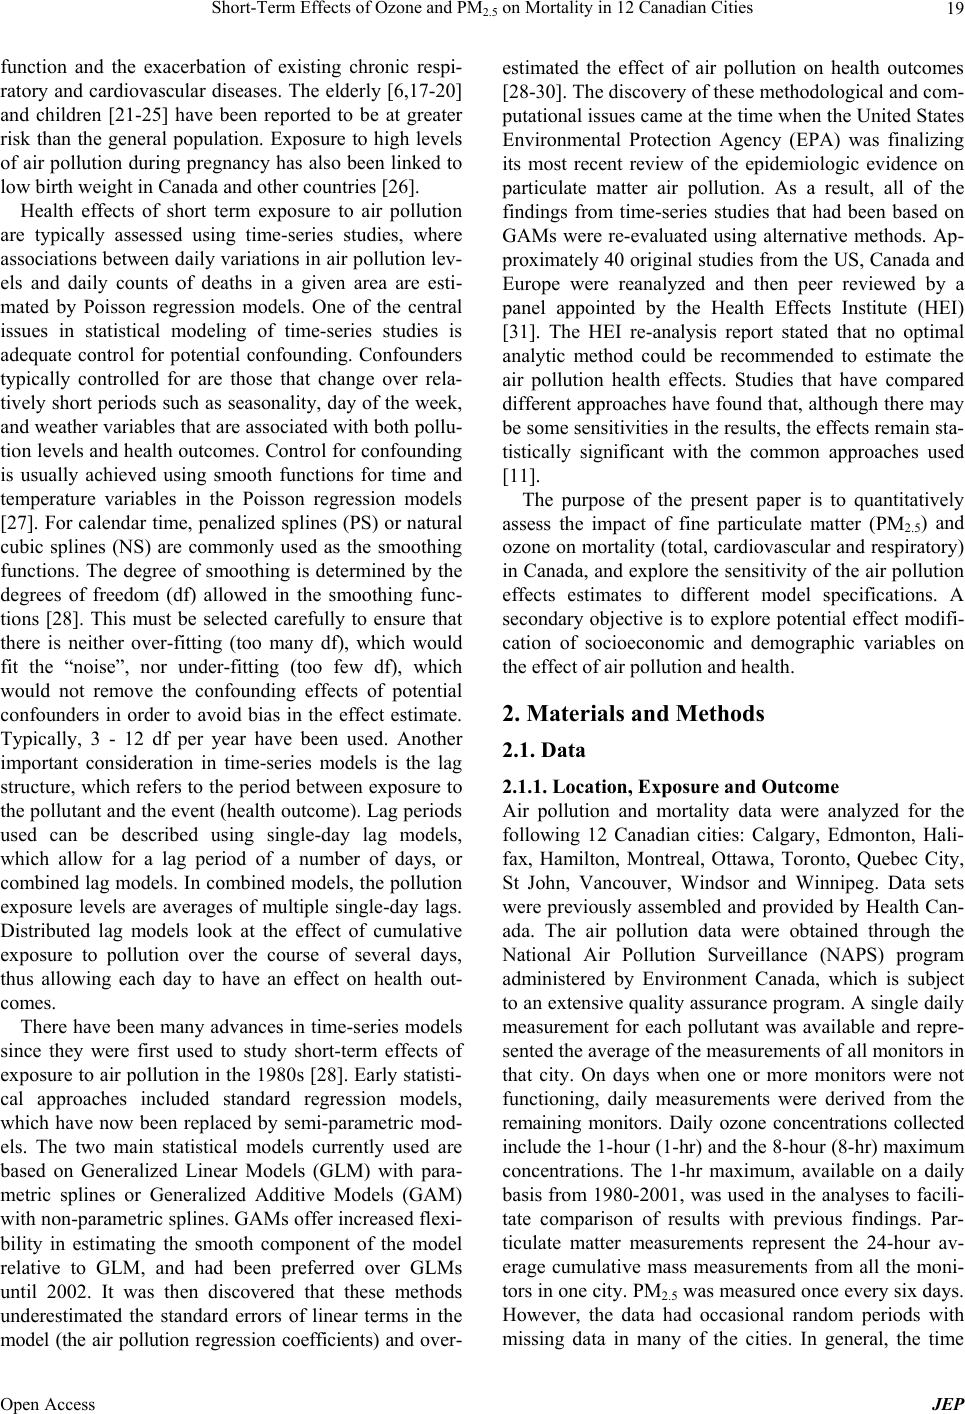 Short-Term Effects of Ozone and PM2.5 on Mortality in 12 Canadian Cities 19 function and the exacerbation of existing chronic respi- ratory and cardiovascular diseases. The elderly [6,17-20] and children [21-25] have been reported to be at greater risk than the general population. Exposure to high levels of air pollution during pregnancy has also been linked to low birth weight in Canada and other countries [26]. Health effects of short term exposure to air pollution are typically assessed using time-series studies, where associations between daily variations in air pollution lev- els and daily counts of deaths in a given area are esti- mated by Poisson regression models. One of the central issues in statistical modeling of time-series studies is adequate control for potential confounding. Confounders typically controlled for are those that change over rela- tively short periods such as seasonality, day of the week, and weather variables that are associated with both pollu- tion levels and health outcomes. Control for confounding is usually achieved using smooth functions for time and temperature variables in the Poisson regression models [27]. For calendar time, penalized splines (PS) or natural cubic splines (NS) are commonly used as the smoothing functions. The degree of smoothing is determined by the degrees of freedom (df) allowed in the smoothing func- tions [28]. This must be selected carefully to ensure that there is neither over-fitting (too many df), which would fit the “noise”, nor under-fitting (too few df), which would not remove the confounding effects of potential confounders in order to avoid bias in the effect estimate. Typically, 3 - 12 df per year have been used. Another important consideration in time-series models is the lag structure, which refers to the period between exposure to the pollutant and the event (health outcome). Lag periods used can be described using single-day lag models, which allow for a lag period of a number of days, or combined lag models. In combined models, the pollution exposure levels are averages of multiple single-day lags. Distributed lag models look at the effect of cumulative exposure to pollution over the course of several days, thus allowing each day to have an effect on health out- comes. There have been many advances in time-series models since they were first used to study short-term effects of exposure to air pollution in the 1980s [28]. Early statisti- cal approaches included standard regression models, which have now been replaced by semi-parametric mod- els. The two main statistical models currently used are based on Generalized Linear Models (GLM) with para- metric splines or Generalized Additive Models (GAM) with non-parametric splines. GAMs offer increased flexi- bility in estimating the smooth component of the model relative to GLM, and had been preferred over GLMs until 2002. It was then discovered that these methods underestimated the standard errors of linear terms in the model (the air pollution regression coefficients) and over- estimated the effect of air pollution on health outcomes [28-30]. The discovery of these methodological and com- putational issues came at the time when the United States Environmental Protection Agency (EPA) was finalizing its most recent review of the epidemiologic evidence on particulate matter air pollution. As a result, all of the findings from time-series studies that had been based on GAMs were re-evaluated using alternative methods. Ap- proximately 40 original studies from the US, Canada and Europe were reanalyzed and then peer reviewed by a panel appointed by the Health Effects Institute (HEI) [31]. The HEI re-analysis report stated that no optimal analytic method could be recommended to estimate the air pollution health effects. Studies that have compared different approaches have found that, although there may be some sensitivities in the results, the effects remain sta- tistically significant with the common approaches used [11]. The purpose of the present paper is to quantitatively assess the impact of fine particulate matter (PM2.5) and ozone on mortality (total, cardiovascular and respiratory) in Canada, and explore the sensitivity of the air pollution effects estimates to different model specifications. A secondary objective is to explore potential effect modifi- cation of socioeconomic and demographic variables on the effect of air pollution and health. 2. Materials and Methods 2.1. Data 2.1.1. Location, Exposure and Outcome Air pollution and mortality data were analyzed for the following 12 Canadian cities: Calgary, Edmonton, Hali- fax, Hamilton, Montreal, Ottawa, Toronto, Quebec City, St John, Vancouver, Windsor and Winnipeg. Data sets were previously assembled and provided by Health Can- ada. The air pollution data were obtained through the National Air Pollution Surveillance (NAPS) program administered by Environment Canada, which is subject to an extensive quality assurance program. A single daily measurement for each pollutant was available and repre- sented the average of the measurements of all monitors in that city. On days when one or more monitors were not functioning, daily measurements were derived from the remaining monitors. Daily ozone concentrations collected include the 1-hour (1-hr) and the 8-hour (8-hr) maximum concentrations. The 1-hr maximum, available on a daily basis from 1980-2001, was used in the analyses to facili- tate comparison of results with previous findings. Par- ticulate matter measurements represent the 24-hour av- erage cumulative mass measurements from all the moni- tors in one city. PM2.5 was measured once every six days. However, the data had occasional random periods with missing data in many of the cities. In general, the time Open Access JEP  Short-Term Effects of Ozone and PM2.5 on Mortality in 12 Canadian Cities 20 period with data available for each city varied between 6 - 16 years since 1984. Records of the daily mean tem- perature for the time-series were also available. Health outcome data for this study were obtained from the Canadian Institute for Health Information (CIHI). To ensure the quality of data collected, CIHI regularly per- forms quality checks of its databases. Deaths were classi- fied using the ICD-9 (International Statistical Classifica- tion of Diseases) codes. Records that had been classified using the ICD-10-CA scheme were converted to the ICD-9 classification scheme by CIHI and were then subject to a quality assurance program. Mortality data for the 12 Ca- nadian cities were available for the 20-year period 1981- 2001. The databases included information on residence (city), age, date of death, and single underlying cause of death. 2.1.2. Potential Effect Modifiers Data on 29 ecologic covariates representing city-level demographic, socioeconomic, health care, and lifestyle determinants were used to explore effect modification. The data were initially compiled for use in the interna- tional study, Air Pollution and Health: A combined European and North American Approach (APHENA) [32], but was of limited use due to the lack of uniform data of variables in the US and Europe. To explore effect modification, city-specific risk coefficients, βs, were re- gressed on the city-level covariates, by weighted linear regression with weights inversely proportional to the variance of each city’s β. Twenty-nine variables that might modify the exposure-mortality association were considered by including them in the time series models individually. 2.1.3. Analyses 1) First stage (city-specific estimates) Poisson regression models allowing for over disper- sion were used to estimate the associations of ozone and PM2.5 with mortality. The city-specific model is pre- sented in Equation (1): 12 log, ,3 t t Estime dfstempdf P DOWholiday t (1) where E(μt) is the expected value of the Poisson distrib- uted variable μt, which represents the daily counts of events (deaths) on day t. The term s1(time, df) controls for seasonality, where s1 is a smooth function with natu- ral cubic splines as basis functions for the time variable and df is the degrees of freedom that allows s1 to take various functional forms. The function s1 models the non-linear association between time-varying covariates, calendar time, and daily mortality. To control for weather, the term s2(temp, 3) was included, where s2 is a smooth- ing function of temperature on day t with 3 df. P is the pollutant concentration (ozone in ppb or PM2.5 in μg/m3) on day t; DOW and holiday are dummy variables in- cluded in the model representing the day of week and holidays. The regression coefficient β represents the log relative increase (if β is positive) in the number of events in the target population per unit increase in pollutant concentration. Time-series studies generally report re- sults as percent change in mortality per 10 units change in pollutant concentration (This value is simply obtained by multiplying the regression coefficient β by a factor of 1000). Three mortality outcomes for each age group were considered based on the ICD-9 codes: <800 for total mortality corresponding to all non-accidental causes of death, 390 - 459 for cardiovascular causes of death, and 460 - 519 for respiratory causes of death. Sensitivity analyses exploring the effect of degrees of freedom allowed for seasonality control in the smooth function of calendar time and the effect of varying the lag period were conducted. These analyses were limited to ozone, which had daily data. Effects estimates for ozone on all outcomes across all ages were determined with models allowing for 1 - 20 df for the time variable per year of data available. For temperature, three df were allowed in all analyses, based on previous findings that indicate that results are robust to varying degrees df used for temperature. Models included the same lagged term for temperature variable as was used for the pollutant under consideration. To compare the effect of natural splines and penalized splines, a sensitivity analyses on the risk estimates was carried out on the Toronto data set. After the results of the df and lag period analyses were examined, three val- ues of the df (4, 8 and 12 per year) and three lag periods (for ozone: lag1, lag02 and dist02) were selected for analyses of the data for the remaining cities. Combined lag structures could not be applied to PM2.5 since data were available for every sixth day; thus, three single-day lag periods were selected for this pollutant (lag0, lag1, lag2). 2) Second stage (pooled estimates) City-specific estimates were combined to arrive at pooled estimates by applying fixed effects (FEM) and random effects (REM) regression models. In the fixed effects approach, effects estimates (β’s) were assumed to be normally distributed around an overall estimate and were pooled using inverse variance weighting, with weights proportional to the inverse variance of each city’s β. In the random effects regression approach, the city-specific βs were assumed to form a sample of inde- pendent observations from a normal distribution with the same mean and with variance equal to the sum of the between-city variance and the variance of β. The be- tween-city variance is added to the city-specific variance Open Access JEP  Short-Term Effects of Ozone and PM2.5 on Mortality in 12 Canadian Cities Open Access JEP 21 and is estimated using the maximum likelihood estima- tion (MLE) method [33]. 2.2. Effect Modification Heterogeneity between city specific estimates was as- sessed by the I2 index, which is a measure of the total variability among effect sizes that can be attributed to true heterogeneity (between-city variability) [34]. In gen- eral, an I2 less than 25% suggests low heterogeneity be- tween cities. To explore potential effect modification, weighted linear regression of the city-specific estimates was performed onto each ecologic covariate. Weights were inversely proportional to the variance of each city specific risk estimate (β). Models where the data showed a significant linear association at the 95% confidence level between the potential effect modifier and the risk estimates were assumed to potentially modify the pollut- ant-health outcome relationship. All analyses were completed using R statistical soft- ware for Windows version 2.6.1 [35]. 3. Results Descriptive statistics for the mortality data are provided Tables 1 and 2. There were a total of approximately 1.6 million deaths among all age groups between 1981 and 2000 across the 12 Canadian cities considered. The total exposed population was approximately 9.1 million. Indi- vidual city population ranged from 100,000 in St John to 2.3 million in Toronto, based on the 1991 Census. Mean daily death counts varied between 0 (respiratory mortal- ity) and 48 deaths (total mortality), depending on the size of the city. Descriptive statistics of the exposure database are pre- sented in Table 3. Mean annual temperatures for the 12 cities ranged from 2.4˚C (Edmonton) to 10.6˚C (Van- couver). Ozone measurements were available on a daily basis during the period 1981-2000, with few missing data (except for Halifax). The mean measurements of the 1-hr maximum ozone levels were in the range 27 - 37 ppb. For PM2.5, the mean 24-hour levels varied between 9 μg/m3 and 16 μg/m3. The time periods during which PM2.5 data was available were not uniform across cites. PM2.5 was generally measured every sixth day for most cities, with occasional intermittent missing data across longer periods. Ozone and PM2.5 levels were not strongly correlated, with the highest correlation coefficients being 0.46 and 0.41 for Windsor and St John, respectively. The city level socio-demographic, health services, and lifestyle ecological variables were assessed for potential effect modification of the association between air pollu- tion and mortality. Several of the variables listed were highly correlated. Table 1. Total number of death counts in the 12 Canadian cities in the 1981-2000 period. Outcome/Age group Total counts All-cause mortality all ages 1,564,583 75 and over 748,498 under 75 815,978 Cardiovascular mortality all ages 641,072 75 and over 369,177 under 75 271,855 Respiratory mortality all ages 134,663 75 and over 85,971 under 75 48,683 Table 2. Summary of the population size and mean number of daily mortality counts by cause and age group in the 12 Cana- dian cities. All-cause mortality Cardiovascular mortality Respiratory mortality City Population (×1000)All ages 75 and overUnder 75 All ages75 and overUnder 75 All ages 75 and overUnder 75 Calgary 711 10 5 5 4 2 2 1 1 0 Edmonton 617 11 5 6 5 3 2 1 1 0 Halifax 231 6 3 3 2 1 1 1 0 0 Hamilton 319 10 4 5 4 2 2 1 0 0 Montreal 1776 48 22 26 19 10 9 4 2 2 Ottawa 880 15 7 8 6 4 3 1 1 0 Quebec City 540 17 8 9 7 4 3 1 1 1 St John 103 3 1 1 1 1 1 0 0 0 Toronto 2276 47 22 24 18 11 8 4 3 1 Vancouver 1832 29 15 14 12 8 4 3 2 1 Windsor 191 6 3 3 3 2 1 0 0 0 Winnipeg 615 14 7 7 6 4 2 1 1 0  Short-Term Effects of Ozone and PM2.5 on Mortality in 12 Canadian Cities 22 Table 3. Descriptive statistics for the study period, air pollutants and temperature data used in the analyses of mortality out- comes. City Calgary Edmonton Halifax Hamilton. Montreal OttawaQuebec CitySt JohnToronto Vancouver Windsor Winnipeg Temp (˚C) Mean 4.5 3.0 6.5 8.0 6.6 6.4 4.4 5.2 8.1 10.5 9.8 3.1 25th centile −1.9 −5 -0.8 0.1 −2.1 −2.7 −4.6 −1.70.2 6.3 1.5 −7.4 Median 5.6 4.7 6.9 8.2 7.6 7.455.4 6.1 8.3 10.3 10.2 4.7 75th centile 13 13 14.6 17 16.7 17 14.8 13.717.2 15.3 19.1 15.4 Ozone (ppb) Time period (month/year) 01/81- 12/00 01/81- 12/00 01/81- 12/00 01/81- 12/00 01/81- 12/00 01/81- 12/00 01/81- 12/00 01/81- 12/00 01/81- 12/00 01/81- 12/00 01/81- 12/00 01/81- 12/00 No. obs.1 7305 7302 5945 7290 7304 73037208 714473057292 7225 7159 No. missing2 0 3 1360 15 1 2 97 161 2 13 80 146 Mean (1 hr max) 33.1 31.2 29.0 34.8 28.7 28.828.8 34.534.2 27.0 36.9 30.0 Maximum (1 hr max) 94 110 100 129 115.7 105135 160 144.1104.6 159 99 25th centile 25 22 21 22.3 18.8 20 20 26 22.3 19.1 21 21.5 Median 33 30.5 28 31 26.2 27 28.5 32.330.5 26.6 31.5 29 75th centile 41 40 35 44 35.9 35.735.0 40.042.3 34 49 37.5 PM2.5 (μg/m3) Time period (month/year) 12/84- 12/00 12/84- 12/00 12/84- 12/96 01/95- 12/00 12/84- 12/00 12/84- 12/00 12/85- 12/00 09/92- 09/99 12/84- 12/00 12/84- 12/00 12/87- 12/00 09/84- 09/00 No. obs. 891 791 657 418 1180 807524 112515371082 1031 816 No. missing 6414 6514 6648 6887 6125 64986781 618057706223 6274 6489 Mean 10.2 10.1 11.0 15.3 14.7 10.711.3 7.7 14.7 11.8 16.3 9.0 Maximum 66.1 64.0 45.5 74.1 72.0 53.850.4 53.271.0 67.0 85.6 71.3 25th centile 5.7 5.3 6.1 7.7 7.8 5.1 6.0 3.8 7.3 6.7 8.7 5.2 Median 8.3 8 9.15 12.5 12 8.329 6.3 12.349.8 13.7 7.3 75th centile 12.1 12 13.5 20.3 18.8 13.814.0 9.9 19.5 14.1 20.7 11.0 1Total number of observations; 2Number of missing observations. Figure 1 presents the pooled percent increase (random effects) in mortality outcomes across all ages associated with an increase of 10 ppb in the previous day’s ozone concentrations (lag1). The number degrees of freedom allowed per year of data available was varied between 1 and 20 in the smooth function of time (natural splines) in the city-specific models. Estimates stabilized after al- lowing 4 - 5 df per year, displaying slight decreases as the degrees of freedom increased. In the absence of sub- stantial heterogeneity among city specific estimates, fixed effects and random effects models gave comparable results across cities. Estimates were positive and statistic- cally significant across all outcomes. Results showing the effect of varying the lag period between exposure to ozone and day of death are pre- sented in Figure 2. The figure represents the pooled re- sults (random effects) for all ages at 4, 8 and 12 df per year of data. Higher estimates were observed for com- bined lag models relative to single day lags. Wider con- fidence intervals for respiratory mortality compared to other mortality outcomes were observed, a result of the low daily counts for this outcome. For total and cardio- vascular mortality, effects estimates were significant at all lag structures and df examined. The mortality effects estimates for ozone and PM2.5 across all age groups with eight degrees of freedom for seasonality control and three lag structures are summa- rized in Tables 4 and 5, respectively. For ozone, results were statistically significant across all age groups, with higher estimates observed with the combined lags rela- Open Access JEP 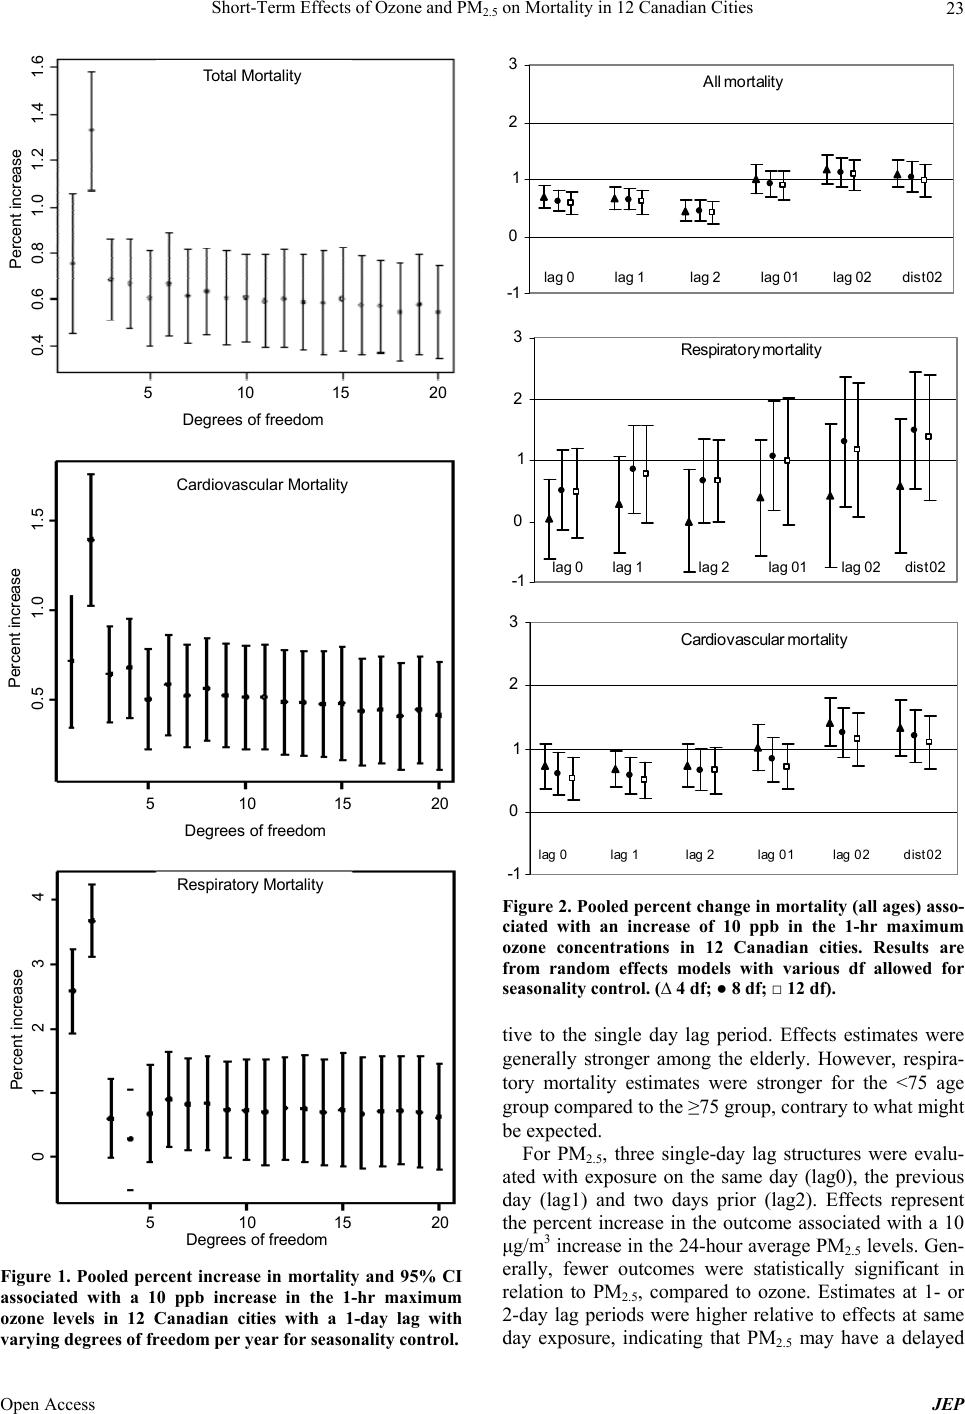 Short-Term Effects of Ozone and PM2.5 on Mortality in 12 Canadian Cities 23 Total Mortality Degrees of freedom 5 1015 20 0.4 0.6 0.8 1.0 1.2 1.4 1.6 Percent increase Cardiovascular Mortality Degrees of freedom 5 10 15 20 0.5 Percent increase 1.0 1.5 Respirat ory Mortali ty Degrees of freedom 5 10 15 20 0 Percent increase 1 2 3 4 Figure 1. Pooled percent increase in mortality and 95% CI associated with a 10 ppb increase in the 1-hr maximum ozone levels in 12 Canadian cities with a 1-day lag with varying degrees of freedom per year for seasonality control. All mortality -1 0 1 2 3 lag 0lag 1lag 2l ag 01lag 02dist02 Respira tory mortality -1 0 1 2 3 lag 0l ag 1l ag 2l ag 01lag 02dist02 Cardiovascular mortality -1 0 1 2 3 l ag 0lag 1l ag 2lag 01lag 02dist02 Figure 2. Pooled percent change in mortality (all ages) asso- ciated with an increase of 10 ppb in the 1-hr maximum ozone concentrations in 12 Canadian cities. Results are from random effects models with various df allowed for seasonality control. (∆ 4 df; ● 8 df; □ 12 df). tive to the single day lag period. Effects estimates were generally stronger among the elderly. However, respira- tory mortality estimates were stronger for the <75 age group compared to the ≥75 group, contrary to what might be expected. For PM2.5, three single-day lag structures were evalu- ated with exposure on the same day (lag0), the previous day (lag1) and two days prior (lag2). Effects represent the percent increase in the outcome associated with a 10 μg/m3 increase in the 24-hour average PM2.5 levels. Gen- erally, fewer outcomes were statistically significant in relation to PM2.5, compared to ozone. Estimates at 1- or 2-day lag periods were higher relative to effects at same ay exposure, indicating that PM2.5 may have a delayed d Open Access JEP 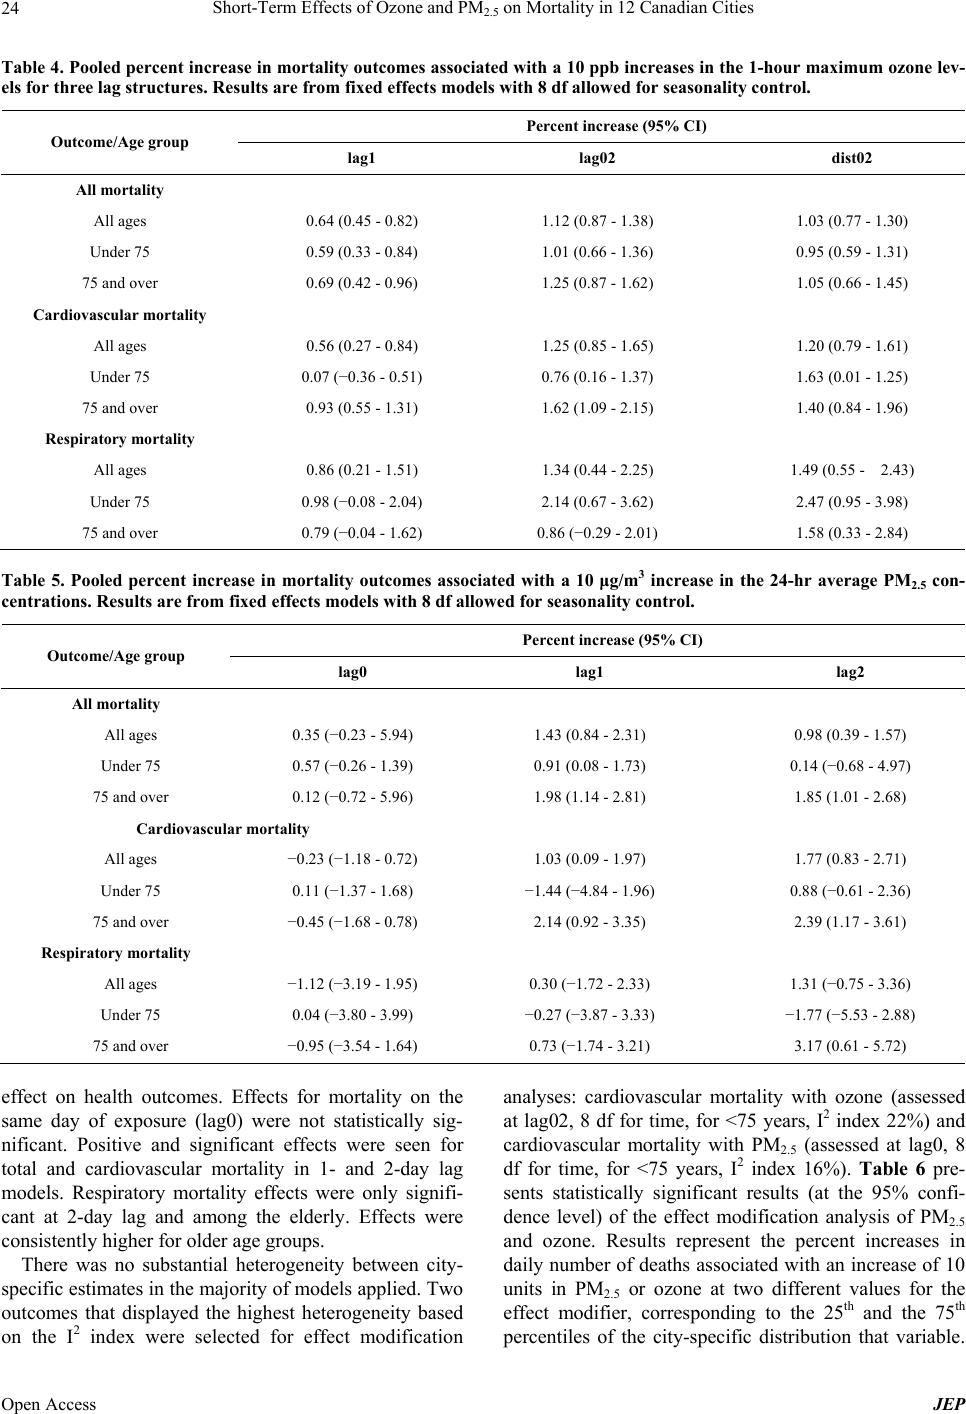 Short-Term Effects of Ozone and PM2.5 on Mortality in 12 Canadian Cities Open Access JEP 24 Table 4. Pooled percent increase in mortality outcomes associated with a 10 ppb increases in the 1-hour maximum ozone lev- els for three lag structures. Results are from fixed effects models with 8 df allowed for seasonality control. Percent increase (95% CI) Outcome/Age group lag1 lag02 dist02 All mortality All ages 0.64 (0.45 - 0.82) 1.12 (0.87 - 1.38) 1.03 (0.77 - 1.30) Under 75 0.59 (0.33 - 0.84) 1.01 (0.66 - 1.36) 0.95 (0.59 - 1.31) 75 and over 0.69 (0.42 - 0.96) 1.25 (0.87 - 1.62) 1.05 (0.66 - 1.45) Cardiovascular mortality All ages 0.56 (0.27 - 0.84) 1.25 (0.85 - 1.65) 1.20 (0.79 - 1.61) Under 75 0.07 (−0.36 - 0.51) 0.76 (0.16 - 1.37) 1.63 (0.01 - 1.25) 75 and over 0.93 (0.55 - 1.31) 1.62 (1.09 - 2.15) 1.40 (0.84 - 1.96) Respiratory mortality All ages 0.86 (0.21 - 1.51) 1.34 (0.44 - 2.25) 1.49 (0.55 - 2.43) Under 75 0.98 (−0.08 - 2.04) 2.14 (0.67 - 3.62) 2.47 (0.95 - 3.98) 75 and over 0.79 (−0.04 - 1.62) 0.86 (−0.29 - 2.01) 1.58 (0.33 - 2.84) Table 5. Pooled percent increase in mortality outcomes associated with a 10 μg/m3 increase in the 24-hr average PM2.5 con- centrations. Results are from fixed effects models with 8 df allowed for seasonality control. Percent increase (95% CI) Outcome/Age group lag0 lag1 lag2 All mortality All ages 0.35 (−0.23 - 5.94) 1.43 (0.84 - 2.31) 0.98 (0.39 - 1.57) Under 75 0.57 (−0.26 - 1.39) 0.91 (0.08 - 1.73) 0.14 (−0.68 - 4.97) 75 and over 0.12 (−0.72 - 5.96) 1.98 (1.14 - 2.81) 1.85 (1.01 - 2.68) Cardiovascular mortality All ages −0.23 (−1.18 - 0.72) 1.03 (0.09 - 1.97) 1.77 (0.83 - 2.71) Under 75 0.11 (−1.37 - 1.68) −1.44 (−4.84 - 1.96) 0.88 (−0.61 - 2.36) 75 and over −0.45 (−1.68 - 0.78) 2.14 (0.92 - 3.35) 2.39 (1.17 - 3.61) Respiratory mortality All ages −1.12 (−3.19 - 1.95) 0.30 (−1.72 - 2.33) 1.31 (−0.75 - 3.36) Under 75 0.04 (−3.80 - 3.99) −0.27 (−3.87 - 3.33) −1.77 (−5.53 - 2.88) 75 and over −0.95 (−3.54 - 1.64) 0.73 (−1.74 - 3.21) 3.17 (0.61 - 5.72) effect on health outcomes. Effects for mortality on the same day of exposure (lag0) were not statistically sig- nificant. Positive and significant effects were seen for total and cardiovascular mortality in 1- and 2-day lag models. Respiratory mortality effects were only signifi- cant at 2-day lag and among the elderly. Effects were consistently higher for older age groups. There was no substantial heterogeneity between city- specific estimates in the majority of models applied. Two outcomes that displayed the highest heterogeneity based on the I2 index were selected for effect modification analyses: cardiovascular mortality with ozone (assessed at lag02, 8 df for time, for <75 years, I2 index 22%) and cardiovascular mortality with PM2.5 (assessed at lag0, 8 df for time, for <75 years, I2 index 16%). Table 6 pre- sents statistically significant results (at the 95% confi- dence level) of the effect modification analysis of PM2.5 and ozone. Results represent the percent increases in daily number of deaths associated with an increase of 10 units in PM2.5 or ozone at two different values for the effect modifier, corresponding to the 25th and the 75th ercentiles of the city-specific distribution that variable. p  Short-Term Effects of Ozone and PM2.5 on Mortality in 12 Canadian Cities 25 Table 6. Percent change in mortality associated with a 10 μg/m3 increase in PM2.5 concentrations at the 25th and 75th percen- tile of the city-specific distributions of covariates that displayed significant effect modification. Percent change (95% CI) Outcome/ Effect modifier 25th centile 75th centile p-value Cardiovascular mortality and PM2.5 Area −0.72 (−3.45, 2.02) −0.17 (−2.79, 2.46) 0.05 Unemployment, males 1.72 (−1.32, 4.77) 0.16 (−2.44, 2.76) 0.05 Manufacturing 2.75 (−0.88, 6.38) −0.24 (−2.85, 2.37) 0.04 Stress 1.6 (−0.89, 4.09) 0.47 (−1.8, 2.75) 0.01 Results can be seen as showing pollutant effects in a city characterized by a level of the effect modifier corre- sponding to the 25th or 75th percentile. 4. Discussion This study presents results of the short-term effects of ozone and PM2.5 exposure on mortality across 12 Cana- dian cities. Statistically significant associations were ob- served across the three mortality outcomes, with esti- mates being generally higher among the elderly. Risk estimates were robust to seasonality control when more than five degrees of freedom per year of data available were allowed. Sensitivity of risk estimates was observed to varying lag structures with higher estimates when us- ing combined lag structures for ozone, and with 1 or 2 day lags for PM2.5. Analyses of socio-demographic, health services and lifestyle covariates did not identify any potential effect modifiers that warrant further investiga- tion. 4.1. Degrees of Freedom for Seasonality Across the three mortality outcomes, effects estimates were found to stabilize beyond five degrees of freedom per year in the smoothing function of calendar time. Re- sults obtained are in agreement with other studies that have explored the sensitivity of degrees of freedom for seasonality control. Peng et al. [20] conducted a simula- tion study that compared various methods commonly used to adjust for seasonal and long-term trends. By ex- amining the variability of the regression coefficient, β, using 1 - 20 df per year, results indicated that the bias in β was only serious for df between 1 and 4 with natural splines (and between 1 and 6 df with penalized splines) and was stable afterwards. Another study in California found that effects estimates decreased with increasing df when evaluated at 4, 8 and 12 df per year with a greater reduction observed going from 4 to 8 df [13]. Although there is no preferred method to choose the optimal degrees of freedom, Touloumi et al. [36] suggest that the approach followed in NMMAPS (7 df per year) yields conservative air pollution effects estimates, since this value of df is large enough to ensure adequate con- trol for seasonal and long-term trends. Many previous studies have selected a fixed value for df (generally be- tween 4 - 12 df per year) to be used in analyses, based on sensitivity analyses or previous results [13,14,37,38]. The analyses in this study evaluated all the outcomes for different age groups at 4, 8 and 12 df per year to compare the effects across this range. Natural cubic splines were used in all analyses pre- sented. Penalized splines have also been used in time- series studies and both methods are believed to yield comparable results. Mortality risk estimates associated with ozone obtained from both approaches were com- pared in this study using the data set for one of the 12 cities (Toronto). Risk estimates varied between −4% and 6% when comparing both approaches at values of 6 - 14 df per year for time, confirming the comparability of risk estimates based on natural splines and penalized splines. The effect of varying the df for the temperature vari- able was not explored in this study. It is generally ac- cepted that the effects estimates are not as sensitive to the method used to control for temperature as they are to controlling for calendar time [39]. The approach fol- lowed in APHENA for controlling for temperature was adopted in this study, where three degrees of freedom were allowed in the smooth function of temperature in all models. 4.2. Effects Estimates The use of the 1-hr maximum daily average for ozone facilitated the comparison of results with previous find- ings, as many of previous studies used this measure. The World Health Organization suggests that the 8-hour av- erage may be a better indicator for respiratory function and lung inflammation [40]. However, correlation coef- ficients between the 1-hr and 8-hr maximum ozone levels were in the 0.94 - 0.97 range across the 12 Canadian cit- ies. Thus, similar results are to be expected using either measurement. Results of both measures were compared Open Access JEP 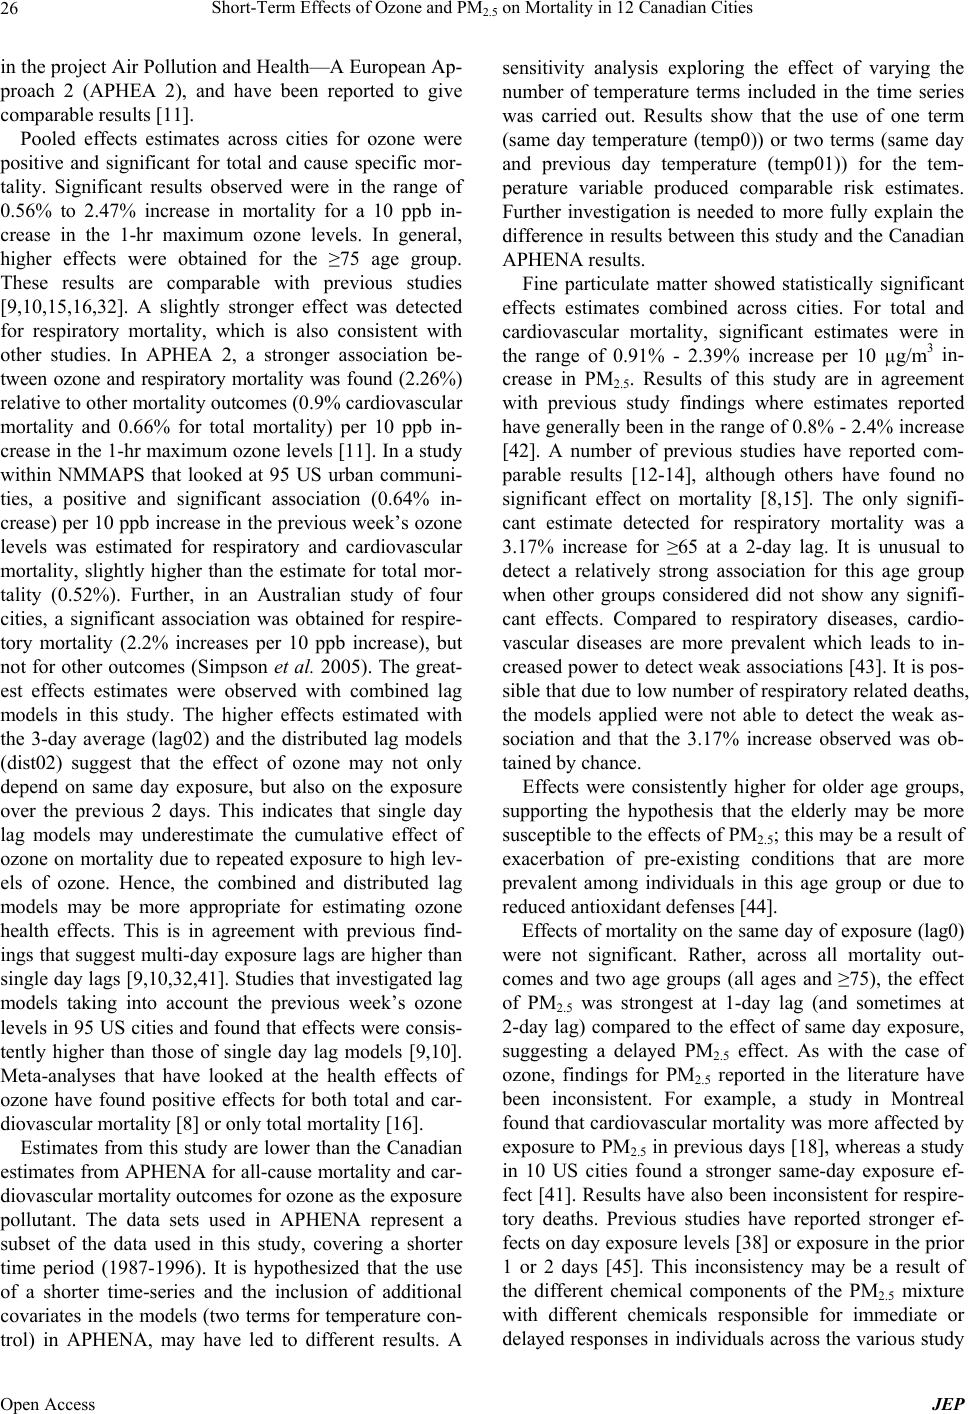 Short-Term Effects of Ozone and PM2.5 on Mortality in 12 Canadian Cities 26 in the project Air Pollution and Health—A European Ap- proach 2 (APHEA 2), and have been reported to give comparable results [11]. Pooled effects estimates across cities for ozone were positive and significant for total and cause specific mor- tality. Significant results observed were in the range of 0.56% to 2.47% increase in mortality for a 10 ppb in- crease in the 1-hr maximum ozone levels. In general, higher effects were obtained for the ≥75 age group. These results are comparable with previous studies [9,10,15,16,32]. A slightly stronger effect was detected for respiratory mortality, which is also consistent with other studies. In APHEA 2, a stronger association be- tween ozone and respiratory mortality was found (2.26%) relative to other mortality outcomes (0.9% cardiovascular mortality and 0.66% for total mortality) per 10 ppb in- crease in the 1-hr maximum ozone levels [11]. In a study within NMMAPS that looked at 95 US urban communi- ties, a positive and significant association (0.64% in- crease) per 10 ppb increase in the previous week’s ozone levels was estimated for respiratory and cardiovascular mortality, slightly higher than the estimate for total mor- tality (0.52%). Further, in an Australian study of four cities, a significant association was obtained for respire- tory mortality (2.2% increases per 10 ppb increase), but not for other outcomes (Simpson et al. 2005). The great- est effects estimates were observed with combined lag models in this study. The higher effects estimated with the 3-day average (lag02) and the distributed lag models (dist02) suggest that the effect of ozone may not only depend on same day exposure, but also on the exposure over the previous 2 days. This indicates that single day lag models may underestimate the cumulative effect of ozone on mortality due to repeated exposure to high lev- els of ozone. Hence, the combined and distributed lag models may be more appropriate for estimating ozone health effects. This is in agreement with previous find- ings that suggest multi-day exposure lags are higher than single day lags [9,10,32,41]. Studies that investigated lag models taking into account the previous week’s ozone levels in 95 US cities and found that effects were consis- tently higher than those of single day lag models [9,10]. Meta-analyses that have looked at the health effects of ozone have found positive effects for both total and car- diovascular mortality [8] or only total mortality [16]. Estimates from this study are lower than the Canadian estimates from APHENA for all-cause mortality and car- diovascular mortality outcomes for ozone as the exposure pollutant. The data sets used in APHENA represent a subset of the data used in this study, covering a shorter time period (1987-1996). It is hypothesized that the use of a shorter time-series and the inclusion of additional covariates in the models (two terms for temperature con- trol) in APHENA, may have led to different results. A sensitivity analysis exploring the effect of varying the number of temperature terms included in the time series was carried out. Results show that the use of one term (same day temperature (temp0)) or two terms (same day and previous day temperature (temp01)) for the tem- perature variable produced comparable risk estimates. Further investigation is needed to more fully explain the difference in results between this study and the Canadian APHENA results. Fine particulate matter showed statistically significant effects estimates combined across cities. For total and cardiovascular mortality, significant estimates were in the range of 0.91% - 2.39% increase per 10 µg/m3 in- crease in PM2.5. Results of this study are in agreement with previous study findings where estimates reported have generally been in the range of 0.8% - 2.4% increase [42]. A number of previous studies have reported com- parable results [12-14], although others have found no significant effect on mortality [8,15]. The only signifi- cant estimate detected for respiratory mortality was a 3.17% increase for ≥65 at a 2-day lag. It is unusual to detect a relatively strong association for this age group when other groups considered did not show any signifi- cant effects. Compared to respiratory diseases, cardio- vascular diseases are more prevalent which leads to in- creased power to detect weak associations [43]. It is pos- sible that due to low number of respiratory related deaths, the models applied were not able to detect the weak as- sociation and that the 3.17% increase observed was ob- tained by chance. Effects were consistently higher for older age groups, supporting the hypothesis that the elderly may be more susceptible to the effects of PM2.5; this may be a result of exacerbation of pre-existing conditions that are more prevalent among individuals in this age group or due to reduced antioxidant defenses [44]. Effects of mortality on the same day of exposure (lag0) were not significant. Rather, across all mortality out- comes and two age groups (all ages and ≥75), the effect of PM2.5 was strongest at 1-day lag (and sometimes at 2-day lag) compared to the effect of same day exposure, suggesting a delayed PM2.5 effect. As with the case of ozone, findings for PM2.5 reported in the literature have been inconsistent. For example, a study in Montreal found that cardiovascular mortality was more affected by exposure to PM2.5 in previous days [18], whereas a study in 10 US cities found a stronger same-day exposure ef- fect [41]. Results have also been inconsistent for respire- tory deaths. Previous studies have reported stronger ef- fects on day exposure levels [38] or exposure in the prior 1 or 2 days [45]. This inconsistency may be a result of the different chemical components of the PM2.5 mixture with different chemicals responsible for immediate or delayed responses in individuals across the various study Open Access JEP 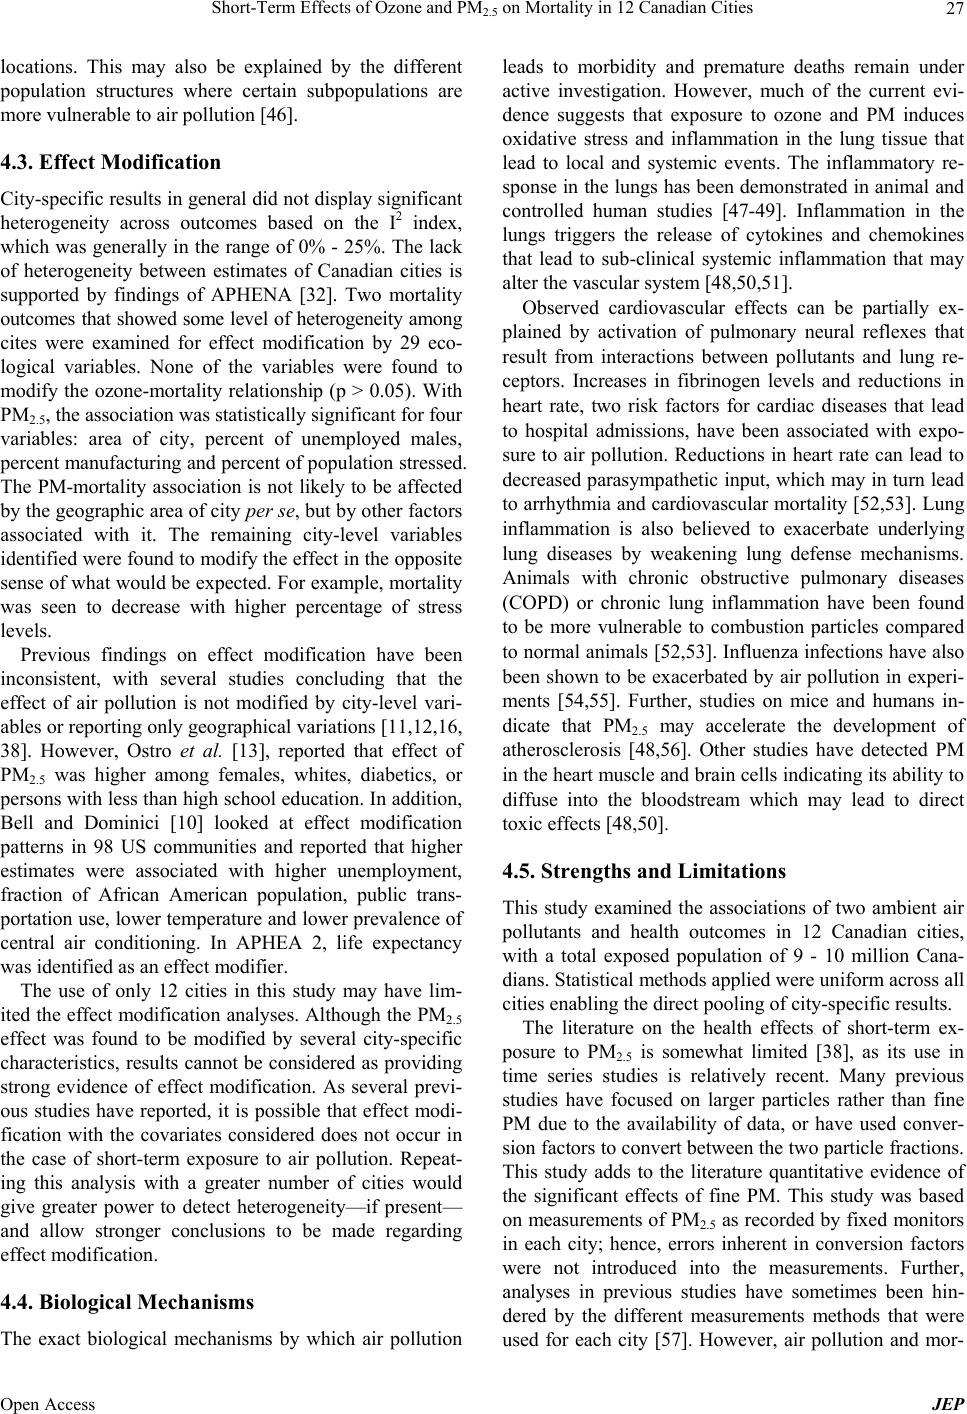 Short-Term Effects of Ozone and PM2.5 on Mortality in 12 Canadian Cities 27 locations. This may also be explained by the different population structures where certain subpopulations are more vulnerable to air pollution [46]. 4.3. Effect Modification City-specific results in general did not display significant heterogeneity across outcomes based on the I2 index, which was generally in the range of 0% - 25%. The lack of heterogeneity between estimates of Canadian cities is supported by findings of APHENA [32]. Two mortality outcomes that showed some level of heterogeneity among cites were examined for effect modification by 29 eco- logical variables. None of the variables were found to modify the ozone-mortality relationship (p > 0.05). With PM2.5, the association was statistically significant for four variables: area of city, percent of unemployed males, percent manufacturing and percent of population stressed. The PM-mortality association is not likely to be affected by the geographic area of city per se, but by other factors associated with it. The remaining city-level variables identified were found to modify the effect in the opposite sense of what would be expected. For example, mortality was seen to decrease with higher percentage of stress levels. Previous findings on effect modification have been inconsistent, with several studies concluding that the effect of air pollution is not modified by city-level vari- ables or reporting only geographical variations [11,12,16, 38]. However, Ostro et al. [13], reported that effect of PM2.5 was higher among females, whites, diabetics, or persons with less than high school education. In addition, Bell and Dominici [10] looked at effect modification patterns in 98 US communities and reported that higher estimates were associated with higher unemployment, fraction of African American population, public trans- portation use, lower temperature and lower prevalence of central air conditioning. In APHEA 2, life expectancy was identified as an effect modifier. The use of only 12 cities in this study may have lim- ited the effect modification analyses. Although the PM2.5 effect was found to be modified by several city-specific characteristics, results cannot be considered as providing strong evidence of effect modification. As several previ- ous studies have reported, it is possible that effect modi- fication with the covariates considered does not occur in the case of short-term exposure to air pollution. Repeat- ing this analysis with a greater number of cities would give greater power to detect heterogeneity—if present— and allow stronger conclusions to be made regarding effect modification. 4.4. Biological Mechanisms The exact biological mechanisms by which air pollution leads to morbidity and premature deaths remain under active investigation. However, much of the current evi- dence suggests that exposure to ozone and PM induces oxidative stress and inflammation in the lung tissue that lead to local and systemic events. The inflammatory re- sponse in the lungs has been demonstrated in animal and controlled human studies [47-49]. Inflammation in the lungs triggers the release of cytokines and chemokines that lead to sub-clinical systemic inflammation that may alter the vascular system [48,50,51]. Observed cardiovascular effects can be partially ex- plained by activation of pulmonary neural reflexes that result from interactions between pollutants and lung re- ceptors. Increases in fibrinogen levels and reductions in heart rate, two risk factors for cardiac diseases that lead to hospital admissions, have been associated with expo- sure to air pollution. Reductions in heart rate can lead to decreased parasympathetic input, which may in turn lead to arrhythmia and cardiovascular mortality [52,53]. Lung inflammation is also believed to exacerbate underlying lung diseases by weakening lung defense mechanisms. Animals with chronic obstructive pulmonary diseases (COPD) or chronic lung inflammation have been found to be more vulnerable to combustion particles compared to normal animals [52,53]. Influenza infections have also been shown to be exacerbated by air pollution in experi- ments [54,55]. Further, studies on mice and humans in- dicate that PM2.5 may accelerate the development of atherosclerosis [48,56]. Other studies have detected PM in the heart muscle and brain cells indicating its ability to diffuse into the bloodstream which may lead to direct toxic effects [48,50]. 4.5. Strengths and Limitations This study examined the associations of two ambient air pollutants and health outcomes in 12 Canadian cities, with a total exposed population of 9 - 10 million Cana- dians. Statistical methods applied were uniform across all cities enabling the direct pooling of city-specific results. The literature on the health effects of short-term ex- posure to PM2.5 is somewhat limited [38], as its use in time series studies is relatively recent. Many previous studies have focused on larger particles rather than fine PM due to the availability of data, or have used conver- sion factors to convert between the two particle fractions. This study adds to the literature quantitative evidence of the significant effects of fine PM. This study was based on measurements of PM2.5 as recorded by fixed monitors in each city; hence, errors inherent in conversion factors were not introduced into the measurements. Further, analyses in previous studies have sometimes been hin- dered by the different measurements methods that were used for each city [57]. However, air pollution and mor- Open Access JEP  Short-Term Effects of Ozone and PM2.5 on Mortality in 12 Canadian Cities 28 tality data were collected under a common framework and subject to the same quality assurance programs across the 12 Canadian cities included in this study. Concentrations of ambient air pollution obtained from fixed outdoor monitors throughout each city were used as a surrogate measure for the population average personal exposure. This method assumes that exposure among all individuals in a given area is identical and does not take into account the differences in activity patterns (such as time spent outdoors) [58]. The feasibility of obtaining such data, usually collected for regulatory purposes, at low cost and no burden to study subjects, has made it convenient to use in time-series studies. As a result, time- series studies are believed to be subject to exposure mis- classification, especially among subpopulations that are at a higher risk since their activity patterns may differ from that of the general population [58,59]. However, the use of fixed monitor measurements is supported by pre- vious studies that have shown a strong correlation be- tween outdoor, indoor and personal exposure to particu- late matter [60,61]. It has also been reported that the presence of error in measurement of the exposure would lead to non-differential misclassification of exposure and hence underestimation of health effects [62-64]. Jerret et al. [63], showed that the health effects were three times higher when analyses were based on individual’s prox- imity to high traffic regions compared to using commu- nity average concentrations. Models that correct for measurement error have also been developed [64]. Another limitation in this study was the systematically missing exposure data for PM2.5. The incomplete expo- sure data may have resulted in an underestimation of the true effect estimates, based on the findings of a recent study by Samoli et al. [65] that showed systematically missing daily PM10 and ozone data gave considerably lower effect estimates. Having PM2.5 measurements for every sixth day may have also led to effect estimates with greater uncertainty than those calculated for ozone (which had daily data). In Canada, PM2.5 data have been collected on a daily basis since the late 1990s. The un- availability of daily PM data may have also contributed to greater heterogeneity between city estimates, thereby increasing the possibility of observing spurious associa- tions as effect modifiers. Confounding of co-pollutants in the PM2.5 effect has been looked at in other studies. PM2.5 is highly correlated with other co-pollutants, and it is often difficult to disen- tangle which component of the air pollution mixture is the one responsible for the observed health effects [66,67]. This study did not look at potential confounding by co-pollutants beyond ozone. Some previous studies have looked at the effect of seasonal variation in the levels of ozone, where higher effects were detected in the summer when ozone levels are typically higher [11,66,68]. This was not explored in this study. Further, the power to detect heterogeneity between city estimates and consequently potential effect modifiers was limited by the low number of cities. It is recom- mended to repeat effect modification analyses with a larger number of cities to arrive at more conclusive re- sults regarding potential effect modifiers. Finally, the potential biases associated with the use of mortality data obtained from death certificates needs to be considered. A Canadian study by Stieb et al. [69], looked at the classification of cardio-respiratory diseases in emergency department visits. Findings found a fair degree of agreement in the diagnosis of seven independ- ent assessments, with no evidence of diagnostic bias in relation to daily air pollution. The databases in this study have been subject to quality control by CIHI. Neverthe- less, if errors were present in the management of data, this would result in non-differential misclassification bias, as such errors would not likely be related to variation in air pollution levels. 4.6. Public Health Implications Results of this study indicate a substantial public health burden from ozone and PM2.5 pollution. Further reduc- tions in the levels of these two pollutants would bring considerable health and economic benefits to Canadians. For example, based on the calculated effects in this study, a 10 ppb increase in 1-hr maximum ozone levels would correspond to an additional 1,368 (95% CI, 985-759) premature deaths each year in the 12 cities considered in this study (based on lag02 model with 8 df and average annual mortality between 1980 and 2000). Similarly, a 10 µg/m3 increase in daily average of PM2.5 would cor- respond to 1148 (95% CI, 521-2319) premature deaths annually in these cities (based on lag2 model with 8 df and the average annual mortality between 1980 and 2000). These figures will be higher when considering the total Canadian population and the inclusion deaths asso- ciated with long-term exposure to these pollutants. Long- term effects related to ozone and PM2.5 exposure have been reported to be much greater than short-term effects [3]. Previous studies have looked at the exposure-response relationship between air pollutants and mortality in an attempt to identify a threshold concentration, below which air pollution would not lead to increases in deaths [32,70,71]. However, recent epidemiologic findings have consistently detected associations at low ambient pollu- tion levels, without clear evidence supporting the exis- tence of a threshold concentration [32,66,71]. 5. Conclusion This study supports previous findings that have linked Open Access JEP  Short-Term Effects of Ozone and PM2.5 on Mortality in 12 Canadian Cities 29 short-term exposure to ozone and PM2.5 with mortality. Effects estimates were robust to confounding adjustment of seasonality but sensitive to lag structures. Statistically significant central estimates of the increase in mortality associated with a 10 ppb increase the 1-hr maximum ozone ranged from 0.56% (95% CI 0.27-0.84) to 2.14% (95% CI 0.95-3.98). For PM2.5, significant central esti- mates of the increases in mortality ranged from 0.91% (95% CI 0.08-1.73) to 3.17% (95% CI 0.61-5.72). Al- though estimated effects are relatively weak, they repre- sent a substantial health burden given the size of the ex- posed population. Based on these results, it is reasonable to assume that reductions in air pollution would likely lead to health benefits by reducing premature mortality. REFERENCES [1] World Health Organization, “Tackling the Global Clean Air Challenge,” 2011. http://www.who.int/mediacentre/news/releases/2011/air_ pollution_20110926/ [2] J. Evans, A. van Donkelaar, R. Martin, R. T. Burnett, D. Rainham, N. Birkett and D. Krewski, “Estimates of Glo- bal Mortality Due to Particulate Air Pollution Using Sat- ellite Imagery,” Environmental Research, Vol. 120, 2013, pp. 33-42. http://dx.doi.org/10.1016/j.envres.2012.08.005 [3] Canadian Medical Association, “No Breathing Room— National Cost of Illness Study,” Summary Report, 2008. http://www.cma.ca/multimedia/CMA/Content_Images/In side_cma/Office_Public_Health/ICAP/CMA_ICAP_sum _e.pdf [4] S. Shang, Z. Sun, J. Cao, X. Wang, L. Zhong, X. Bi, H. Li, W. Liu, T. Zhu and W. Huang, “Systematic Review of Chinese Studies of Short-Term Exposure to Air Pollution and Daily Mortality,” Environment International, Vol. 54, 2013, pp. 100-111. http://dx.doi.org/10.1016/j.envint.2013.01.010 [5] A. Zanobetti, M. Franklin, P. Koutrakis and J. Schwartz, “Fine Particulate Air Pollution and Its Components in Association with Cause-Specific Emergency Admissions,” Environmental Health, Vol. 8, 2009. [6] E. Samoli, M. Stafoggia, S. Rodopoulou, B. Ostro, C. Declercq, E. Alessandrini, J. Díaz, A. Karanasiou, A. G. Kelessis, A. Le Tertre, G. Randi, C. Scarinzi, S. F. Zau- li-Sajani and F. Forastiere, “Associations between Fine and Coarse Particles and Mortality in Mediterranean Cit- ies: Results from the MED-PARTICLES Project,” Envi- ronmental Health Perspectives, Vol. 121, 2013, pp. 932- 938. [7] R. D. Peng, E. Samoli, L. Pham, F. Dominici, G. Tou- loumi, T. Ramsay, R. T. Burnett, D. Krewski, A. Le Ter- tre, A. Cohen, R. W. Atkinson, H. R. Anderson, K. Kat- souyani and J. M. Samet, “Acute Effects of Ambient Ozone on Mortality in Europe and North America: Re- sults from the APHENA Study,” Air Quality, Atmosphere & Health, Vol. 6, No. 2, 2013, pp. 445-453. http://dx.doi.org/10.1007/s11869-012-0180-9 [8] H. R. Anderson, R. Atkinson, J. L. Peacock, L. Martson and K. Konstantinou, “Meta-Analysis of Times Series Studies and Panel Studies of Particulate Matter and Ozone,” Report of a WHO Task Group, World Health Organiza- tion, Copenhagen, 2004. [9] M. L. Bell, A. McDermott, S. L. Zeger, J. M. Samet and F. Dominici, “Ozone and Short-Term Mortality in 95 US Urban Communities, 1987-2000,” Jama-Journal of the American Medical Association, Vol. 292, No. 19, 2004, pp. 2372-2378. http://dx.doi.org/10.1001/jama.292.19.2372 [10] M. L. Bell and F. Dominici, “Effect Modification by Community Characteristics on the Short-Term Effects of Ozone Exposure and Mortality in 98 US Communities,” American Journal of Epidemiology, Vol. 167, 2008, pp. 986-997. http://dx.doi.org/10.1093/aje/kwm396 [11] A. Gryparis, B. Forsberg, K. Katsouyanni, A. Analitis, G. Touloumi, J. Schwartz, E. Samoli, S. Medina, H. R. An- derson, E. M. Niciu, H. E. Wichmann, B. Kriz, M. Kos- nik, J. Skorkovsky, J. M. Vonk and Z. Dortbudak, “Acute Effects of Ozone on Mortality from the ‘Air Pollution and Health: A European Approach’ Project,” American Jour- nal of Respiratory and Critical Care Medicine, Vol. 170, 2004, pp. 1080-1087. http://dx.doi.org/10.1164/rccm.200403-333OC [12] R. Klemm and R. Mason, “Replication of Reanalysis of Harvard Six-City Mortality Study,” In: Revised Analyses of Time Series Studies of Air Pollution and Health, Spe- cial Report, Health Effects Institute, Boston, 2003, pp. 165-172. [13] B. Ostro, R. Broadwin, S. Green, W. Y. Feng and M. Lipsett, “Fine Particulate Air Pollution and Mortality in Nine California Counties: Results from CALFINE,” En- vironmental Health Perspectives, Vol. 114, 2006, pp. 29- 33. http://dx.doi.org/10.1289/ehp.8335 [14] S. Schwartz, “Daily Deaths Associated with Air Pollution in Six US Cities and Short-Term Mortality Displacement in Boston,” Revised Analyses of Time Series Studies of Air Pollution and Health, Special Report, Health Effects Institute, Boston, 2003, pp. 219-226. [15] R. Simpson, G. Williams, A. Petroeschevsky, T. Best, G. Morgan, L. Denison, A. Hinwood, G. Neville and A. Neller, “The Short-Term Effects of Air Pollution on Daily Mortality in Four Australian Cities”, Australian and New Zealand Journal of Public Health, Vol. 29, 2005, pp. 205-212. http://dx.doi.org/10.1111/j.1467-842X.2005.tb00758.x [16] D. M. Stieb, S. Judek and R. T. Burnett, “Meta-Analysis of Time-Series Studies of Air Pollution and Mortality: Effects of Gases and Particles and the Influence of Cause of Death, Age, and Season,” Journal of the Air & Waste Management Association, Vol. 52, No. 4, 2002, pp. 470- 484. http://dx.doi.org/10.1080/10473289.2002.10470794 [17] Y. Chen, Q. Y. Yang, D. Krewski, Y. Shi, R. T. Burnett and K. McGrail, “Influence of Relatively Low Level of Particulate Air Pollution on Hospitalization for COPD in Elderly People,” Inhalation Toxicology, Vol. 16, 2004, pp. 21-25. http://dx.doi.org/10.1080/08958370490258129 [18] M. S. Goldberg, R. T. Burnett, J. C. Bailar, J. Brook, Y. Bonvalot, R. Tamblyn, R. Singh, M. F. Valois and R. Vin- Open Access JEP  Short-Term Effects of Ozone and PM2.5 on Mortality in 12 Canadian Cities 30 cent, “The Association between Daily Mortality and Am- bient Air Particle Pollution in Montreal, Quebec 2. Cause-Specific Mortality,” Environmental Research, Vol. 86, No. 1, 2001, pp. 26-36. http://dx.doi.org/10.1006/enrs.2001.4243 [19] S. Parodi, M. Vercelli, E. Garrone, V. Fontana and A. Izzotti, “Ozone Air Pollution and Daily Mortality in Genoa, Italy between 1993 and 1996,” Public Health, Vol. 119, No. 9, 2005, pp. 844-850. http://dx.doi.org/10.1016/j.puhe.2004.10.007 [20] R. D. Peng, F. Dominici and T. A. Louis, “Model Choice in Time Series Studies of Air Pollution and Mortality,” Journal of the Royal Statistical Society Series A—Statis- tics in Society, Vol. 169, No. 2, 2006, pp. 179-198. http://dx.doi.org/10.1111/j.1467-985X.2006.00410.x [21] R. T. Burnett, M. Smith-Doiron, D. Stieb, M. E. Raizenne, J. R. Brook, R. E. Dales, J. A. Leech, S. Cakmak and D. Krewski, “Association between Ozone and Hospitaliza- tion for Acute Respiratory Diseases in Children Less than 2 Years of Age,” American Journal of Epidemiology, Vol. 153, No. 5, 2001, pp. 444-452. http://dx.doi.org/10.1093/aje/153.5.444 [22] B. B. Jalaludin, T. Chey, B. I. O’Toole, W. T. Smith, A. G. Capon and S. R. Leeder, “Acute Effects of Low Levels of Ambient Ozone on Peak Expiratory Flow Rate in a Cohort of Australian Children,” International Journal of Epidemiology, Vol. 29, No. 3, 2000, pp. 549-557. http://dx.doi.org/10.1093/ije/29.3.549 [23] C. A. Lin, M. A. Martins, S. C. L. Farhat, C. A. Pope, G. M. S. Conceicao, V. M. Anastacio, M. Hatanaka, W. C. Andrade, W. R. Hamaue, G. M. Bohm and P. H. N. Sal- diva, “Air Pollution and Respiratory Illness of Children in Sao Paulo, Brazil,” Paediatric and Perinatal Epidemiol- ogy, Vol. 13, No. 4, 1999, pp. 475-488. http://dx.doi.org/10.1046/j.1365-3016.1999.00210.x [24] A. Peters, D. W. Dockery, J. Heinrich and H. E. Wich- mann, “Short-Term Effects of Particulate Air Pollution on Respiratory Morbidity in Asthmatic Children,” European Respiratory Journal, Vol. 10, 1997, pp. 872-879. [25] Q. Y. Yang, Y. Chen, Y. Shi, R. T. Burnett, K. McGrail and D. Krewski, “Association between Ozone and Respi- ratory Admissions among Children and the Elderly in Vancouver, Canada,” Inhalation Toxicology, Vol. 15, No. 13, 2003, pp. 1297-1308. http://dx.doi.org/10.1080/08958370390241768 [26] Health Canada, “Canada-United States Border Air Qual- ity Strategy: Great Lakes Basin Airshed Management Framework,” 2006. http://www.hc-sc.gc.ca/ewh-semt/air/out-ext/great_lakes- grands_lacs-eng.php#exposure [27] T. F. Bateson, B. A. Coull, B. Hubbell, K. Ito, M. Jerrett, T. Lumley, D. Thomas, S. Vedal and M. Ross, “Panel Discussion Review: Session Three—Issues Involved in Interpretation of Epidemiologic Analyses—Statistical Mo- deling,” Journal of Exposure Science and Environmental Epidemiology, Vol. 17, 2007, pp. S90-S96. http://dx.doi.org/10.1038/sj.jes.7500631 [28] F. Dominici, A. McDermott and T. J. Hastie, “Improved Semiparametric Time Series Models of Air Pollution and Mortality,” Journal of the American Statistical Associa- tion, Vol. 99, 2004, pp. 938-948. http://dx.doi.org/10.1198/016214504000000656 [29] T. O. Ramsay, R. T. Burnett and D. Krewski, “The Effect of Concurvity in Generalized Additive Models Linking Mortality to Ambient Particulate Matter,” Epidemiology, Vol. 14, 2003, Vol. 18-23. [30] J. M. Samet, F. Dominici, A. McDermott and S. L. Zeger, “New Problems for an Old Design: Time Series Analyses of Air Pollution and Health,” Epidemiology, Vol. 14, 2003, pp. 11-12. http://dx.doi.org/10.1097/00001648-200301000-00006 [31] Health Effects Institute, “Revised Analyses of Time- Series Studies of Air Pollution and Health—Special Re- port,” Health Effects Institute, Boston, 2003. [32] K. Katsouyani, J. M. Samet, H. R. Anderson, R. W. At- kinson, A. Le Tertre, S. Medina, E. Samoli, G. Touloumi, R. T. Burnett, D. Krewski, T. Ramsay, F. Dominici, R. D. Peng, J. Schwartz and A. Zanobetti, “Air Pollution and Health: A European and North American Approach (APHENA),” Health Effects Institute, 2009. [33] C. S. Berkey, D. C. Hoaglin, A. Antczak-Bouckoms, F. Mosteller and G. A. Colditz, “Meta-Analysis of Multiple Outcomes by Regression with Random Effects,” Statistics in Medicine, Vol. 17, 1998, pp. 2537-2550. http://dx.doi.org/10.1002/(SICI)1097-0258(19981130)17: 22<2537::AID-SIM953>3.0.CO;2-C [34] T. B. Huedo-Medina, J. Sanchez-Meca, F. Marin-Marti- nez and J. Botella, “Assessing Heterogeneity in Meta- Analysis: Q Statistic or I-2 Index?” Psychological Meth- ods, Vol. 11, No. 2, 2006, pp. 193-206. http://dx.doi.org/10.1037/1082-989X.11.2.193 [35] R Development Core Team, “R: A Language and Envi- ronment for Statistical Computing,” R Foundation for Statistical Computing, Vienna, 2007. [36] G. Touloumi, R. Atkinson, A. Le Tertre, E. Samoli, J. Schwartz, C. Schindler, J. M. Vonk, G. Rossi, M. Saez, D. Rabszenko and K. Katsouyanni, “Analysis of Health Outcome Time Series Data in Epidemiological Studies,” Environmetrics, Vol. 15, No. 2, 2004, pp. 101-117. http://dx.doi.org/10.1002/env.623 [37] F. Ballester, P. Rodriguez, C. Iniguez, M. Saez, A. Daponte, I. Galan, M. Taracido, F. Arribas, J. Bellido, F. B. Cirarda, A. Canada, J. J. Guillen, F. Guillen-Grima, E. Lopez, S. Perez-Hoyos, A. Lertxundi and S. Toro, “Air Pollution and Cardiovascular Admissions Association in Spain: Results within the EMECAS Project,” Journal of Epidemiology and Community Health, Vol. 60, No. 4, 2006, pp. 328-336. http://dx.doi.org/10.1136/jech.2005.037978 [38] F. Dominici, R. D. Peng, M. L. Bell, L. Pham, A. Mc- Dermott, S. L. Zeger and J. M. Samet, “Fine Particulate Air Pollution and Hospital Admission for Cardiovascular and Respiratory Diseases,” Journal of the American Medi- cal Association, Vol. 295, No. 10, 2006, pp. 1127-1134. http://dx.doi.org/10.1001/jama.295.10.1127 [39] L. J. Welty and S. L. Zeger, “Are the Acute Effects of Particulate Matter on Mortality in the National Morbidity, Mortality, and Air Pollution Study the Result of Inadequate Control for Weather and Season? A Sensitivity Analysis Open Access JEP  Short-Term Effects of Ozone and PM2.5 on Mortality in 12 Canadian Cities 31 Using Flexible Distributed Lag Models,” American Journal of Epidemiology, Vol. 162, No. 1, 2005, pp. 80-88. http://dx.doi.org/10.1093/aje/kwi157 [40] World Health Organization, “Health Aspects of Air Pollu- tion with Particulate Matter, Ozone and Nitrogen Dioxide,” Report on a WHO Working Group. WHO Regional Office for Europe, Copenhagen, 13-15 January 2003, pp. 1-92. http://www.euro.who.int/__data/assets/pdf_file/0005/112 199/E79097.pdf [41] A. L. F. Braga, A. Zanobetti and J. Schwartz, “The Lag Structure between Particulate Air Pollution and Respira- tory and Cardiovascular Deaths in 10 US Cities,” Journal of Occupational and Environmental Medicine, Vol. 43, No. 11, 2001, pp. 927-933. http://dx.doi.org/10.1097/00043764-200111000-00001 [42] EPA, “Fourth External Review for Air Quality Criteria for Particulate Matter (Draft),” 2003. [43] Y. H. Zhang, W. Huang, S. J. London, G. X. Song, G. H. Chen, L. L. Jiang, N. Q. Zhao, B. H. Chen and H. D. Kan, “Ozone and Daily Mortality in Shanghai, China,” Envi- ronmental Health Perspectives, Vol. 114, No. 8, 2006, pp. 1227-1232. http://dx.doi.org/10.1289/ehp.9014 [44] F. J. Kelly, “Oxidative Stress: Its Role in Air Pollution and Adverse Health Effects,” Occupational and Environ- mental Medicine, Vol. 60, No. 8, 2003, pp. 612-616. http://dx.doi.org/10.1136/oem.60.8.612 [45] J. Schwartz, D. W. Dockery and L. M. Neas, “Is Daily Mor- tality Associated Specifically with Fine Particles?” Journal of the Air & Waste Management Association, Vol. 46, No. 10, 1996, pp. 927-939. http://dx.doi.org/10.1080/10473289.1996.10467528 [46] H. Kim, Y. Kim and Y. C. Hong, “The Lag-Effect Pattern in the Relationship of Particulate Air Pollution to Daily Mortality in Seoul, Korea,” International Journal of Bio- meteorology, Vol. 48, No. 1, 2003, pp. 25-30. http://dx.doi.org/10.1007/s00484-003-0176-0 [47] S. Ahmad, A. Ahmad, G. McConville, B. K. Schneider, C. B. Allen, R. Manzer, R. J. Mason and C. W. White, “Lung Epithelial Cells Release ATP during Ozone Expo- sure: Signaling for Cell Survival,” Free Radical Biology and Medicine, Vol. 39, No. 2, 2005, pp. 213-226. http://dx.doi.org/10.1016/j.freeradbiomed.2005.03.009 [48] N. Kunzli, M. Jerrett, W. J. Mack, B. Beckerman, L. LaBree, F. Gilliland, D. Thomas, J. Peters and H. N. Hodis, “Ambient Air Pollution and Atherosclerosis in Los Angeles,” Environmental Health Perspectives, Vol. 113, No. 2, 2005, pp. 201-206. http://dx.doi.org/10.1289/ehp.7523 [49] I. S. Mudway, N. Stenfors, A. Blomberg, R. Helleday, C. Dunster, S. L. Marklund, A.J. Frew, T. Sandstrom and F. J. Kelly, “Differences in Basal Airway Antioxidant Con- cen-Trations Are Not Predictive of Individual Respon- siveness to Ozone: A Comparison of Healthy and Mild Asthmatic Subjects,” Free Radical Biology and Medicine, Vol. 31, No. 8, 2001, pp. 962-974. http://dx.doi.org/10.1016/S0891-5849(01)00671-2 [50] R. D. Brook, B. Franklin, W. Cascio, Y. L. Hong, G. Ho- ward, M. Lipsett, R. Luepker, M. Mittleman, J. Samet, S. C. Smith and I. Tager, “Air Pollution and Cardiovascu- lar Disease—A Statement for Healthcare Professionals from the Expert Panel on Population and Prevention Science of the American Heart Association,” Circulation, Vol. 109, No. 21, 2004, pp. 2655-2671. http://dx.doi.org/10.1161/01.CIR.0000128587.30041.C8 [51] W. P. Watkinson, M. J. Campen, J. P. Nolan and D. L. Costa, “Cardiovascular and Systemic Responses to Inhaled Pollut- ants in Rodents: Effects of Ozone and Particulate Matter,” Environmental Health Perspectives, Vol. 109, No. S4, 2001, pp. 539-546. [52] P. S. Gilmour, D. M. Brown, T. G. Lindsay, P. H. Beswick, W. MacNee and K. Donaldson, “Adverse Health Effects of PM(10) Particles: Involvement of Iron in Generation of Hydroxyl Radical,” Occupational and Environmental Me- dicine, Vol. 53, No. 12, 1996, pp. 817-822. http://dx.doi.org/10.1136/oem.53.12.817 [53] R. J. Pritchard, A. J. Ghio, J. R. Lehmann, D. W. Winsett, J. S. Tepper, P. Park, M. I. Gilmour, K. L. Dreher and D. L. Costa, “Oxidant Generation and Lung Injury after Par- ticulate Air Pollutant Exposure Increase with the Concen- trations of Associated Metals,” Inhalation Toxicology, Vol. 8, No. 5, 1996, pp. 457-477. http://dx.doi.org/10.3109/08958379609005440 [54] E. W. Spannhake, S. P. M. Reddy, D. B. Jacoby, X. Y. Yu, B. Saatian and J. Y. Tian, “Synergism between Rhinovirus Infection and Oxidant Pollutant Exposure Enhances Air- way Epithelial Cell Cytokine Production,” Environmental Health Perspectives, Vol. 110, No. 7, 2002, pp. 665-670. [55] J. T. Zelikoff, M. W. Frampton, M. D. Cohen, P. E. Mor- row, M. Sisco, Y. Tsai, M. J. Utell and R. B. Schlesinger, “Effects of Inhaled Sulfuric Acid Aerosols on Pulmonary Immunocompetence: A Comparative Study in Humans and Animals,” Inhalation Toxicology, Vol. 9, No. 8, 1997, pp. 731-752. http://dx.doi.org/10.1080/089583797197971 [56] Q. H. Sun, A. X. Wang, X. M. Jin, A. Natanzon, D. Du- quaine, R. D. Brook, J. G. S. Aguinaldo, Z. A. Fayad, V. Fuster, M. Lippmann, L. C. Chen and S. Rajagopalan, “Long-Term Air Pollution Exposure and Acceleration of Atherosclerosis and Vascular Inflammation in an Animal Model,” Journal of the American Medical Association, Vol. 294, No. 23, 2005, pp. 3003-3010. http://dx.doi.org/10.1001/jama.294.23.3003 [57] A. Le Tertre, S. Medina, E. Samoli, B. Forsberg, P. Mi- chelozzi, A. Boumghar, J. M. Vonk, A. Bellini, R. Atkinson, J. G. Ayres, J. Sunyer, J. Schwartz and K. Katsouyanni, “Short-Term Effects of Particulate Air Pollution on Car- diovascular Diseases in Eight European Cities,” Journal of Epidemiology and Community Health, Vol. 56, No. 10, 2002, pp. 773-779. http://dx.doi.org/10.1136/jech.56.10.773 [58] M. L. Bell, J. M. Samet and F. Dominici, “Time-Series Studies of Particulate Matter,” Annual Review of Public Health, Vol. 25, 2004, pp. 247-280. http://dx.doi.org/10.1146/annurev.publhealth.25.102802.1 24329 [59] M. S. Goldberg, R. T. Burnett and J. R. Brook, “Counter- point: Time-Series Studies of Acute Health Events and Environmental Conditions Are Not Confounded by Per- sonal Risk Factors,” Regulatory Toxicology and Phar- macology, Vol. 51, No. 2, 2008, pp. 141-147. Open Access JEP  Short-Term Effects of Ozone and PM2.5 on Mortality in 12 Canadian Cities Open Access JEP 32 http://dx.doi.org/10.1016/j.yrtph.2008.03.006 [60] N. A. Janssen, J. J. de Hartog, G. Hoek, B. Brunekreef, T. Lanki, K. L. Timonen and J. Pekkanen, “Personal Exposure to Fine Particulate Matter in Elderly Subjects: Relation between Personal, Indoor, and Outdoor Concentrations,” Journal of the Air & Waste Management Association, Vol. 50, No. 7, 2000, pp. 1133-1143. http://dx.doi.org/10.1080/10473289.2000.10464159 [61] D. Kim, A. Sass-Kortsak, J. T. Purdham, R. E. Dales and J. R. Brook, “Associations between Personal Exposures and Fixed-Site Ambient Measurements of Fine Particulate Matter, Nitrogen Dioxide, and Carbon Monoxide in To- ronto, Canada,” Journal of Exposure Science and Environ- mental Epidemiology, Vol. 16, No. 2, 2006, pp. 172-183. http://dx.doi.org/10.1038/sj.jea.7500446 [62] G. Hoek, B. Brunekreef, S. Goldbohm, P. Fischer and P. A. van den Brandt, “Association between Mortality and Indicators of Traffic-Related Air Pollution in the Nether- lands: A Cohort Study,” Lancet, Vol. 360, No. 9341, 2002, pp. 1203-1209. http://dx.doi.org/10.1016/S0140-6736(02)11280-3 [63] M. Jerrett, R. T. Burnett, R. J. Ma, C. A. Pope, D. Krewski, K. B. Newbold, G. Thurston, Y. L. Shi, N. Finkelstein, E. E. Calle and M. J. Thun, “Spatial Analysis of Air Pollution and Mortality in Los Angeles,” Epidemiology, Vol. 16, No. 6, 2005, pp. 727-736. http://dx.doi.org/10.1097/01.ede.0000181630.15826.7d [64] S. L. Zeger, D. Thomas, F. Dominici, J. M. Samet, J. Schwartz, D. Dockery and A. Cohen, “Exposure Measure- ment Error in Time-Series Studies of Air Pollution: Con- cepts and Consequences,” Environmental Health Perspec- tives, Vol. 108, No. 5, 2000, pp. 419-426. [65] E. Samoli, R. D. Peng, T. Ramsay, G. Touloumi, F. Do- minici, R. W Atkinson, A. Zanobetti, A. Le Tertre, H. R. Anderson, J. Schwartz, A. Cohen, D. Krewski, J. M. Sa- met and K. Katsouyani, “What Is the Impact of System- atically Missing Exposure Data on Air Pollution Health Effect Estimates?” [66] P. Bellini, M. Baccini, A. Biggeri and B. Terracini, “The Meta-Analysis of the Italian Studies on Short-Term Ef- fects of Air Pollution (MISA): Old and New Issues on the Interpretation of the Statistical Evidences,” Environmet- rics, Vol. 18, No. 3, 2007, pp. 219-229. http://dx.doi.org/10.1002/env.836 [67] M. Goldberg, “On the Interpretation of Epidemiological Studies of Ambient Air Pollution,” Journal of Exposure Science and Environmental Epidemiology, Vol. 17, No. S2, 2007, pp. S66-S70. http://dx.doi.org/10.1038/sj.jes.7500629 [68] R. T. Burnett, J. R. Brook, W. T. Yung, R. E. Dales and D. Krewski, “Association between Ozone and Hospitali- zation for Respiratory Diseases in 16 Canadian Cities,” Environmental Research, Vol. 72, No. 1, 1997, pp. 24-31. http://dx.doi.org/10.1006/enrs.1996.3685 [69] D. M. Stieb, R. C. Beveridge, B. H. Rowe, S. D. Walter and S. Judek, “Assessing Diagnostic Classification in an Emergency Department: Implications for Daily Time Se- ries Studies of Air Pollution,” American Journal of Epi- demiology, Vol. 148, No. 7, 1998, pp. 666-670. http://dx.doi.org/10.1093/aje/148.7.666 [70] M. J. Daniels, F. Dominici, J. M. Samet and S. L. Zeger, “Estimating Particulate Matter-Mortality Dose-Response Curves and Threshold Levels: An Analysis of Daily Time- Series for the 20 Largest US Cities,” American Journal of Epidemiology, Vol. 152, No. 5, 2000, pp. 397-406. http://dx.doi.org/10.1093/aje/152.5.397 [71] J. Schwartz, “Assessing Confounding, Effect Modifica- tion, and Thresholds in the Association between Ambient Particles and Daily Deaths,” Environmental Health Per- spectives, Vol. 108, No. 6, 2000, pp. 563-568.
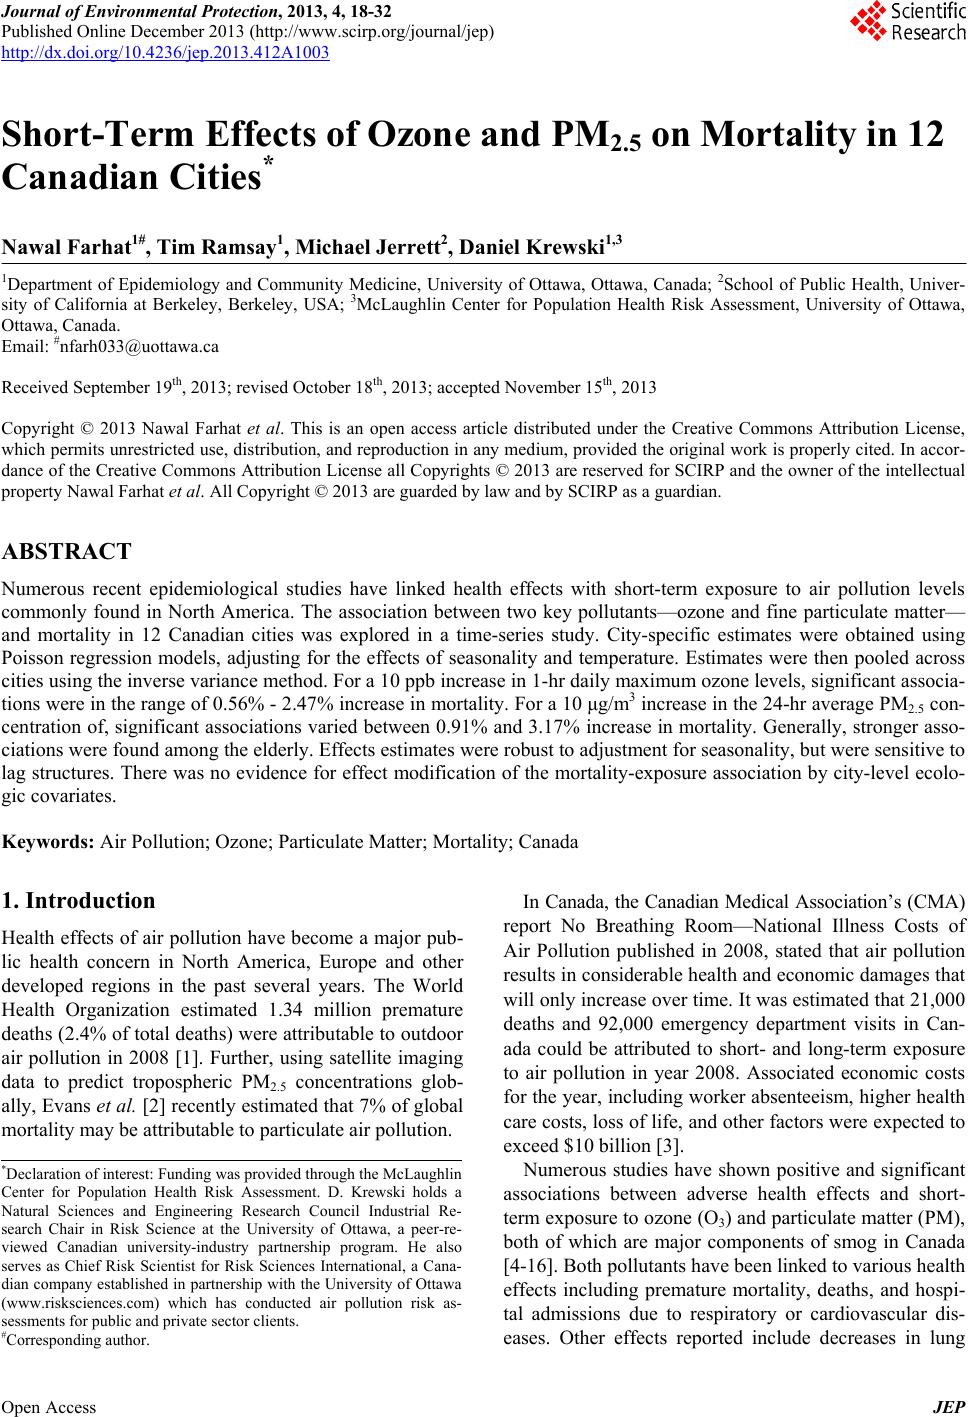
|